
 Open Access Article
 This Open Access Article is licensed under a Creative Commons Attribution-Non Commercial 3.0 Unported Licence
Optimization of flash extraction, separation of ginsenosides, identification by HPLC-FT-ICR-MS and determination of rare ginsenosides in mountain cultivated ginseng†
Lei Xu‡
a,
Jing Xu‡a,
Guohui Shia,
Shengnan Xiaoa,
Rongke Daia,
Shao Wua,
Baoshan Sun*a,
Xiaoshu Zhang*a and
Yuqing Zhao *ab
*ab
aSchool of Functional Food and Wine, Shenyang Pharmaceutical University, Shenyang 110016, China. E-mail: zyq4885@126.com; xiaoshu2397@163.com; sunbaoshan@syphu.edu.cn; Fax: +86 24 43520300; Tel: +86 24 43520309 Tel: +86 24 43520301
bKey Laboratory of Structure-based Drug Design & Discovery, Ministry of Education, Shenyang Pharmaceutical University, Shenyang 110016, China
First published on 11th December 2020
Abstract
In this paper, we used the flash extraction method (FEM) to extract ginsenosides from mountain cultivated ginseng (MCG), optimized the FEM process by response surface methodology (RSM), and separated 23 kinds of ginsenosides from MCG, including rare ginsenoside Rg3, 20(R/S)-Rg2, Rk3, 20(S)-Rh2, 20(R)-Rh1, F1 and Rg6. Among them, notoginsenoside R1 was isolated from MCG for the first time. Additionally, we established an HPLC-FT-ICR-MS method to accurately identify 20 ginsenosides in MCG, and quantitatively analyzed the differences in the content of rare ginsenosides in MCG and Garden-Cultivated Ginseng (CG) by HPLC-UV. The results showed that the chemical components of MCG and CG were similar, but the ginsenoside content of MCG was double that of CG. Notably, the content of ginsenoside 20 (S)-Rh2 and 20 (R)-Rh1 had the largest difference, and the content in MCG was 33 and 24 times higher than that in CG, respectively. Through quantitative analysis, we clarified the reason why the activity of MCG is stronger than that of CG, which provided a theoretical basis for clinical application and further research of MCG.
1 Introduction
Panax ginseng Meyer is a slow-growing perennial plant belonging to the Araliaceae family and is widely grown in regions of Korea, China, and Asian countries. As a famous tonic in traditional Chinese medicine in the northeast of China, ginseng has been used for a long time in the treatment of splenic asthenia, wheezing, insomnia and spontaneous perspiration. It has been used as a medicinal plant in China for more than 2000 years.1 Recent reports have shown that ginseng possesses numerous biological activities, including anti-cancer,2 immunomodulatory effects,3 anti-oxidant,4 anti-aging,5 anti-inflammation,6 anti-diabetic.7 Studies have shown that these beneficial effects are attributed to ginsenosides, polysaccharides, and volatile oils. Ginsenosides in particular have been shown to exhibit significant anti-oxidant, anti-cancer, and anti-apoptotic activity.8,9In recent years, due to the increased destruction of forest resources and the predatory excavation of ginseng, the availability of wild ginseng resources had plummeted. Mountain cultivated ginseng (MCG), which simulates the growth habit and ecological environment of wild ginseng, can be regarded as an imitation of wild ginseng.10 Many results showed that the MCG had stronger pharmacological activities than Garden-Cultivated Ginseng (CG).11 MCG has been collected in the Chinese pharmacopoeia since 2005,12 considered as the sources of ginseng, using the same standard with CG. But at present there are no clear methods for the identification of two kinds of ginseng, which can easily lead to ginseng market chaos. In the Chinese pharmacopoeia and many existing ginseng standards, the extraction of ginseng requires a long time of heating with some ginsenosides may be transformed.13 Therefore, there is an urgent need for a room temperature and fast extraction method in order to better extract and distinguish MCG and CG.
The flash extraction method (FEM) is a convenient and efficient extraction process that can effectively shorten room temperature extractions.14 FEM performs high-speed stirring, strong vibration, and negative pressure percolation to achieve extractions, which are conducive to the extraction of heat-sensitive components.15 Song16 used FEM to rapidly isolate 27 compounds in Nitraria sibirica fruit, and reported the benefits of FEM over conventional extraction processes. Kan17 used FEM to extract the seed oil of Elaeagnus mollis, which compared to the Soxhlet extraction method, improved oxidative stability in volatile oil. Zhang18 showed that using FEM, the structure of soybean flour could be protected from temperature induced damage, improving the analysis of its structural, physical and chemical properties. However, FEM has not been used for the rapid extraction and separation of ginseng.
High performance liquid chromatography (HPLC) and Fourier transform ion cyclotron resonance mass spectrometry (FT-ICR-MS) can provide accurate molecular mass and structural information due to their high sensitivity, resolution, and rapid scanning speed.19 In this study, the efficient extraction of ginsenoside at room temperature was reported for the first time. The extraction conditions were optimized using response surface methodology (RSM). Further study, the semi preparative HPLC, MCI gels, and other chromatographic methods were used to isolate the components of ginsenosides in MCG. Meanwhile, more rigorous identification methods for ginseng (HPLC-FT-ICR-MS) were proposed and the ginsenosides in MCG and CG were qualitatively detected. We finally clarified the superior performance of MCG over CG, which provided a theoretical basis for the application of MCG in future studies.
2 Materials and methods
2.1 Reagents and materials
Semipreparative high performance liquid chromatography was carried out on an Agela Innoval ODS-2 column (5 μm, 10 × 250 nm, China) with an LC3000 instrument (Beijing Tong Heng Innovation Technology Co., Ltd. China). NMR spectra: Bruker ARX-600 spectrometer in pyridine-d5 with trimethylchlorosilane as internal standard.The flash extractor was obtained by All Herbal Scientech, LLC (JHBE-20A, Beijing, China). HPLC-FT-ICR-MS was performed with auto-sampler, thermostatic column chamber, online degasser, quadruple pump on Agilent 1260 system and diode-array detector (Agilent Corporation, Santa Clara, CA, USA) with ESI interface and a 7.0 tesla magnet. HPLC analyses were performed on CXTH LC-3000 (Beijing, China). Octadecyl silica chromatographic column [Agilent 5 HC-C18 column (250 × 4.6 mm)]. Chromatographic grade methanol, acetonitrile and purified water were purchased from Fisher Scientific International Inc.and Wahaha (Hangzhou, China) respectively.
Samples of MCG and CG were collected from Huanren, Liaoning Province, China. All of the plants were identified as 15 and 5 years ginseng by Prof. Jincai Lu of Shenyang Pharmaceutical University. A voucher specimen (PT 20190316) was deposited in the herbarium of Shenyang Pharmaceutical University. The samples were dried at 45 °C to constant weight.
2.2 Extraction procedures
All the samples were pulverized into powder of over 100 mesh. Weighed 1.0 g dried ginseng powder and mixed with different volume of ethanol–water solution were put in the flash extractor for extracting different time in different times. After extracting, the extract was filtered, and then the content of total ginsenoside in the extract was tested. In this study, the optimal extraction conditions were established through RSM.2.3 Selection of variables
The total ginsenoside content of the MCG extract extracted by flash extractor is influenced by various factors, such as liquid–solid ratio, ethanol concentration, time of extraction and extraction voltage.18 In our preliminary experiment, we found that the extraction time also affected the total content of ginsenoside in MCG extracts. To select the appropriate range of the variables, single factor experiment was carried out on the extraction time (1–5 min), ethanol concentration (10–90%), extraction times (1–5) and liquid–solid ratio (10–50 mL g−1) separately. The total ginsenoside was extracted under different conditions with one factor changed at a time and the other three remain the same.2.4 The design of Box–Behnken
RSM method was used to optimize the extraction method of ginsenosides in MCG. According to the single factor experiments, the experimental variables were ethanol concentration (X1, %), extraction times (X2, times) and liquid–solid ratio (X3, mL g−1). Each variable was encoded at three levels (−1, 0, 1), a Box–Behnken response surface experimental design (BBD) was applied which leading to 17 experiments. The regression coefficient is obtained by fitting the experimental data to the second-order polynomial model. The best condition was defined as the factor to maximize the yield of the reaction.2.5 Total ginsenoside content of MCG
Total ginsenoside content of MCG was determined by the vanillin method. The extract solution (100 μL) was mixed with 200 μL 5% vanillin in acetic acid and 800 μL 70% perchloric acid. The mixture was incubated at 60 °C for 15 min, and then 5 mL acetic acid was added and incubated at room temperature (25 °C) for 30 min. Ginsenoside Re solution with different concentration were used as the quantification standard. UV-2800AH spectrophotometer (UNICO, Shanghai) was used to measure the absorbance of the mixture.2.6 Extraction and isolation
To obtain the ginsenosides, the dried MCG samples (80 g) were extracted by flash extractor with the optimal extraction conditions. The extract (15 g) was fractionated by silica gel with a gradient of CH2Cl2–MeOH–EtOAc–H2O (2![[thin space (1/6-em)]](https://www.rsc.org/images/entities/char_2009.gif) :2:4:1) to obtain seven fractions (Fr. A–G). We further isolated the components of fractions by semi preparative HPLC, MCI gels, and other chromatographic methods. The schematic representation of the extraction and isolation procedure is shown in Fig. 1.
:2:4:1) to obtain seven fractions (Fr. A–G). We further isolated the components of fractions by semi preparative HPLC, MCI gels, and other chromatographic methods. The schematic representation of the extraction and isolation procedure is shown in Fig. 1.
 | ||
| Fig. 1 MCG separation process. | ||
2.7 HPLC-FT-ICR-MS analysis
The HPLC-FT-ICR-MS were carried out on an Agilent 1260 system with a FT-ICR-MS equipped with ESI interface and a 7.0 tesla magnet. The HPLC mobile phase consisted of water (A) and acetonitrile (B) at 0.8 mL min−1 flow through an Agilent 5 HC-C18 column (250 × 4.6 mm). Mobile phase elution system was performed in linear gradient (28–35% B at 0–5 min, 35–50% B at 5–15 min, 50–68% B at 15–25 min, 68–90% B at 25–28 min, 90% B at 28–40 min). The column temperature was kept at 25 °C, the UV detection wavelength was 203 nm, and the injection amount was 10 μL.The API source conditions were as follows: the ion source is ESI source; the capillary voltage is 4.0 kV, the end plate offset is −500 V and the transfer capillary temperature is 200 °C. The source gas tune was as follows: the nebulizer gas pressure is 1.0 bar; the dry gas flow rate is 1.2 L min−1; the dry gas temperature is 180 °C. In the range of m/z value from 150 to 2000, the full scan MS data are obtained, and the collision energy of the selected ion is initially set to 10 eV, then it is corrected according to the fragment. Under the soft ESI condition, most of the components showed negative ion mode in the full scan mass spectra. Calibrate the FT-ICR mass spectrometer in negative mode using NaTFA in accordance with the manufacturer's instructions. FT-MS control, Bruker Compass-Hystar and DataAnalysis Software (Bruker Daltonics, Bremen, Germany) were used to control the equipment, collect and analyze the data.
2.8 Simultaneous determination of individual ginsenosides
Analyses were performed on a CXTH-3000 HPLC system. The mobile phase consisted of water (A) and acetonitrile (B) at a flow rate of 1.0 mL min−1 through an Agilent 5 HC-C18 column (250 × 4.6 mm). Mobile phase elution system was performed in a linear gradient (28–35% B at 0–5 min, 35–50% B at 5–15 min, 50–68% B at 15–25 min, 68–90% B at 25–28 min, 90% B at 28–40 min). The column temperature was kept at 25 °C, the UV detection wavelength was 203 nm, and the injection amount was 20 μL.2.9 Preparation of standard solutions and sample solutions
Compounds 1 to 23 were dissolved by HPLC grade methanol. 23 ginsenosides mixed stock solution were prepared by mixing 23 ginsenosides standard stock solution and diluting to scale with methanol (the concentrations of compounds 1 to 23 (mg mL−1): 0.01, 0.02, 0.02, 0.13, 0.10, 0.15, 0.18, 0.15, 0.18, 0.20, 0.19, 0.18, 0.15, 0.08, 0.13, 0.15, 0.15, 0.14, 0.20, 0.11, 0.10, 0.10, 0.14). All the solutions were stored at 4 °C until use.Accurately 0.5 mg of MCG extract were weighed and dissolved in 1 mL of HPLC grade methanol, and then filtrated before use. A volume of 10 μL was injected into the HPLC-FT-ICR-MS and HPLC system for further analysis.
2.10 Statistical analysis
All data were expressed as the mean ± SD. Software Design Expert 8.05 was used to determine the linear, quadratic and interaction regression coefficients of RSM experiment.3 Results and discussion
3.1 Extraction parameters
The total ginsenosides content of the ginseng extract extracted by FEM is influenced by various factors, including ethanol concentration, extraction time and liquid–solid ratio. In our preliminary study, extraction times were also affected by the total ginsenosides content in MCG extracts. The effects of extraction times, ethanol concentration, extraction time and liquid–solid ratio on the yield of total ginsenosides extract from MCG were preliminarily evaluated to determine the effective factors. As shown in Fig. 2A, excluding the extraction time, all parameters significant impacted the extraction rate of total ginsenosides in MCG. The total ginsenosides content was directly proportional to the liquid–solid ratio range from 10 to 40 mL g−1. The total ginsenosides content increased using 50% to 70% ethanol as the solvent, but did not significant differ from 70% to 90% ethanol. The extraction times also affected the extraction of total ginsenosides. Ultimately, the effective factors for latter response surface experiments were ethanol concentration (%, X1), extraction times (times, X2) and liquid–solid ratio (mL g−1, X3) based on the experimental results, and their values were 60–80%, 3–5 times and 1:30–1:50, respectively.
 | ||
| Fig. 2 Optimization of FEM process. (A) Effects of extraction ethanol concentration, extraction times, liquid–solid ratio and extraction time. (B) The 2D contour maps and 3D response surface of RSM showing the effect of extraction variables on total ginsenoside yields (I–III). *P < 0.05, **P < 0.01. | ||
3.2 Effects of the extraction variables on total ginsenosides content
In total, 17 experiments were performed for the analysis of variance for the fitted second-order regression model (Tables 1 and 2). According to the results, the model of experiment was adequate (p < 0.01) and the lack of fit was not significant (p > 0.05). The determination coefficient (R2) of the total ginsenosides was 0.9815, meaning 98.15% of the variations could be explained by the model. The model was highly significant and fitted the experimental data well. The positive linear effects of three independent variables on all response variables were significant (p < 0.05), indicating that the model was highly significant and could fit the experimental data well. The positive linear effects of the three independent variables were significant (p < 0.05) for all the response variables: the ethanol concentration (X1) (p < 0.05), the extraction times (X2) and liquid–solid ratio (X3) (p < 0.01) had significantly influenced the total ginsenoside content.| Source | Analytical results | |
|---|---|---|
| Total ginsenoside | ||
| a *** indicates a statistically significant difference P < 0.001, ** indicates a significant statistical significance P < 0.01, * indicates statistical significance P < 0.05. | ||
| Intercept | 45.61 | |
| Liner | X1 | 1.13** |
| X2 | 2.74*** | |
| X3 | 1.95*** | |
| Quadratic | X12 | −6.29*** |
| X22 | −3.21*** | |
| X32 | −1.94** | |
| Interactions | X1X2 | −0.49 |
| X1X3 | 0.31 | |
| X2X3 | 0.16 | |
| R2 | 0.98 | |
| Adj R2 | 0.96 | |
| F Value (model) | 41.36*** | |
| F Value (lack of fit) | 1.16 | |
| Run | Factors | Experimental values | ||
|---|---|---|---|---|
| X1 ethanol concentration (%) | X2 extraction times | X3 liquid–solid ratio (mL g−1) | Total ginsenoside content (mg g−1) | |
| 1 | 80 | 3 | 20 | 36.96 ± 0.34 |
| 2 | 70 | 4 | 40 | 45.25 ± 1.23 |
| 3 | 60 | 3 | 40 | 37.19 ± 0.56 |
| 4 | 80 | 4 | 30 | 39.43 ± 1.89 |
| 5 | 80 | 2 | 30 | 34.23 ± 0.67 |
| 6 | 80 | 3 | 40 | 40.92 ± 1.87 |
| 7 | 60 | 3 | 20 | 34.49 ± 0.65 |
| 8 | 70 | 3 | 30 | 45.22 ± 0.87 |
| 9 | 60 | 4 | 30 | 38.98 ± 0.45 |
| 10 | 70 | 3 | 30 | 44.33 ± 1.86 |
| 11 | 70 | 3 | 30 | 46.20 ± 2.01 |
| 12 | 70 | 3 | 30 | 46.77 ± 1.45 |
| 13 | 70 | 2 | 40 | 40.15 ± 1.09 |
| 14 | 60 | 2 | 30 | 31.81 ± 0.54 |
| 15 | 70 | 4 | 20 | 40.45 ± 1.65 |
| 16 | 70 | 2 | 20 | 36.00 ± 1.21 |
| 17 | 70 | 3 | 30 | 45.55 ± 1.69 |
The second order polynomial model of ginsenoside was established by multiple regression analysis. According to the given coding factors, the mathematical regression model is as follows:
| Y = 45.61 + 1.13X1 + 2.74X2 + 1.95X3 − 0.49X1X2 + 0.31X1X3 + 0.16X2X3 − 6.29X12 − 3.21X22 − 1.94X32. |
3.3 Optimized conditions and experimental verification
The expected function method was used to optimize the maximum output of all three responses. Using the RSM generation model, the best experimental conditions for the maximum yield of all three reactions was 70.86% (ethanol content), 3.43 times (extraction times), and 35.29:1 mL g−1 (liquid–solid ratio). The optimal levels of extraction included an ethanol content of 71%, extraction times of 3 and liquid–solid ratio of 36:1 mL g−1. To corroborate these results, five parallel assays were assessed under optimal levels. The average total ginsenosides content was 45.01 ± 0.1 mg g−1. The correlation between these results confirmed that the model fully reflected the expected optimization factors (Fig. 2B).
3.4 Phytochemical investigation
Twenty-three compounds (1–23) were obtained from the MCG. According to the structural of these compounds, the isolated compounds could be divided into two subtypes, including panaxadiol and panaxatriol. The structures of the compounds were showed in Fig. 3A. Based on 13C-NMR data and comparison of known compound spectrum information, the compounds were determined as notoginsenoside R1 (1), 20-O-glu-ginsenoside Rf (2), ginsenoside Rf (3), ginsenoside Re (4), ginsenoside Rg1 (5), 20(S)-notoginsenoside G (6), vina-ginsenoside R4 (7), ginsenoside Rb1 (8), ginsenoside Ia (9), ginsenoside Rc (10), notoginsenoside Fz (11), ginsenoside Rb2 (12), ginsenoside Rb3 (13), 20(S)-ginsenoside Rg2 (14), 20(R)-ginsenoside Rg2 (15), 20(R)-ginsenoside Rh1 (16), ginsenoside F1 (17), notoginsenoside Fe (18), ginsenoside Rd2 (19), ginsenoside Rg6 (20), ginsenoside Rk3 (21), ginsenoside Rg3 (22) and 20(S)-ginsenoside Rh2 (23). The structure analysis and spectrums of all compounds are in ESI.†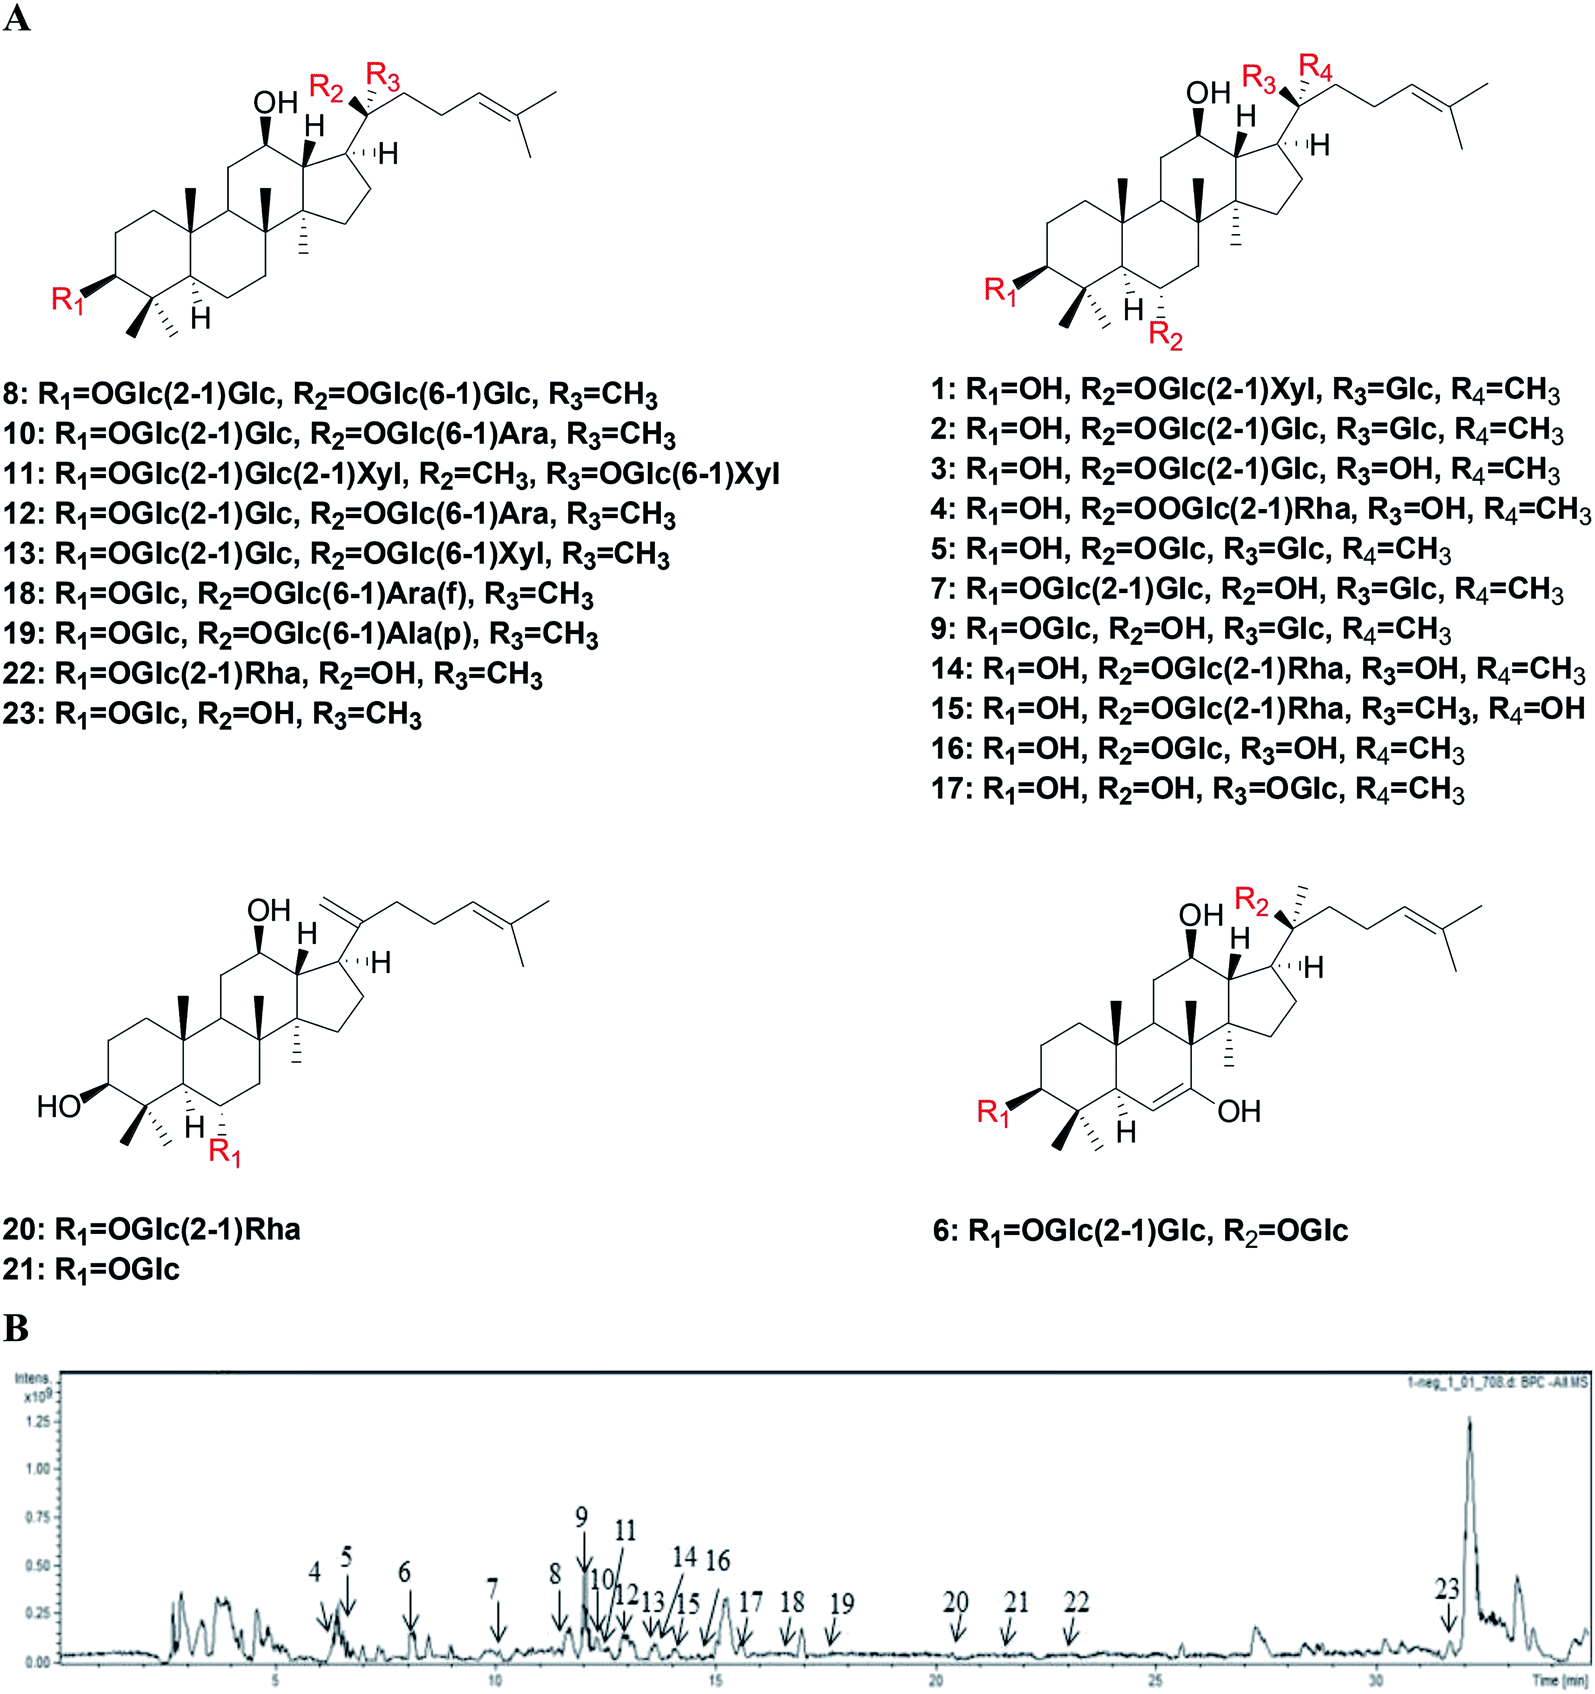 | ||
| Fig. 3 Separation and HPLC-FT-ICR MS identification of MCG. (A) The structures of 23 compounds isolated from MCG. (B) The HPLC-FT-ICR MS chromatograms of MCG. | ||
Amongst the compounds, compound 1 (notoginsenoside R1) was regarded as the characteristic components of Panax notoginseng. Zhu20 used UPLC-QTOF-MS/MS/MS and Unifi new information platform to rapidly analyze and identify the small and medium molecular components (molecular weight 100–1200 Da) of MCG and CG. Notoginsenoside R1 was detected in MCG and CG, but not isolated from MCG. This was the first study to isolate notoginsenoside R1 from MCG.
3.5 HPLC-FT-ICR-MS determination of individual ginsenoside
Compounds were analyzed using the by HPLC-FT-ICR-MS method for qualitative analysis. In total, 23 ginsenosides were identified from MCG. Gradient elutions performed to increase the resolution of HPLC analysis du to complexity of the components contained in MCG. Upon comparison of acetonitrile–water and methanol–water as mobile phases, the separation effect of the acetonitrile–water system performed to a higher level.To determine the conditions for MS analysis, we tested both positive and negative ionization modes. The results showed that the negative ionization mode ([M − H]− peak) provided more intense proton signals. The peak information for HPLC-FT-ICR-MS analysis is provided in Table 3 and the HPLC-FT-ICR-MS chromatograms of MCG along with the HPLC-FT-ICR-MS spectra are shown in Fig. 3B. The 23 tested compounds were assessed by HPLC from mixed stock solutions and mass spec analysis. A total of 20 samples in the reference substance showed a mass spectrum response. Upon comparison of the liquid phase and mass spectrometry information of the sample and reference substance, 20 ginsenosides were accurately identified, whilst 3 were undetected due to their low content.
| No. | Ginsenoside | [M − H]− | MCG | Comp. | ||||
|---|---|---|---|---|---|---|---|---|
| tR | m/z | Error | tR | m/z | Error | |||
| 1 | 6.28 | 945.54858 | −0.26 | C48H81O18 | 6.34 | 945.54832 | −1.21 | Ginsenoside Re |
| 2 | 6.46 | 799.49041 | −1.70 | C42H71O14 | 6.67 | 799.49041 | 1.18 | Ginsenoside Rg1 |
| 3 | 7.98 | 959.52758 | 3.51 | C48H79O19 | 8.05 | 959.52758 | 2.62 | 20(S)-Notoginsenoside G |
| 4 | 9.42 | 961.54323 | 1.80 | C48H81O19 | 10.04 | 961.54323 | −4.00 | Vina-ginsenoside R4 |
| 5 | 11.53 | 1107.60114 | 4.22 | C54H91O23 | 11.59 | 1107.60114 | 3.12 | Ginsenoside Rb1 |
| 6 | 12.09 | 799.49041 | 0.22 | C42H71O14 | 12.01 | 799.49041 | −2.36 | Ginsenoside Ia |
| 7 | 12.33 | 1077.59058 | 2.25 | C53H89O22 | 12.30 | 1077.59058 | 4.65 | Ginsenoside Rc |
| 8 | 12.64 | 1209.63284 | 0.22 | C58H97O26 | 12.59 | 1209.63284 | 1.89 | Notoginsenoside Fz |
| 9 | 12.94 | 1077.59058 | 3.98 | C53H89O22 | 12.91 | 1077.59058 | 0.41 | Ginsenoside Rb2 |
| 10 | 13.56 | 1077.59180 | −1.09 | C53H89O22 | 13.40 | 1077.59058 | −1.09 | Ginsenoside Rb3 |
| 11 | 13.94 | 783.49550 | 0.53 | C42H71O13 | 13.79 | 783.49550 | −0.59 | 20(S)-Ginsenoside Rg2 |
| 12 | 14.11 | 783.49550 | −1.03 | C42H71O13 | 14.08 | 783.49550 | −2.09 | 20(R)-Ginsenoside Rg2 |
| 13 | 14.56 | 637.43759 | −1.93 | C36H61O9 | 14.63 | 637.43759 | −0.61 | 20(R)-Ginsenoside Rh1 |
| 14 | 15.41 | 637.43759 | 0.62 | C36H61O9 | 15.72 | 637.43759 | −1.51 | Ginsenoside F1 |
| 15 | 16.72 | 915.53775 | −0.03 | C47H79O17 | 16.72 | 915.53775 | −2.37 | Notoginsenoside Fe |
| 16 | 17.41 | 779.46420 | −1.41 | C42H67O13 | 17.50 | 779.46420 | 2.51 | Ginsenoside Rd2 |
| 17 | 20.28 | 751.46928 | 0.19 | C41H67O12 | 20.34 | 751.46928 | −1.37 | Ginsenoside Rg6 |
| 18 | 21.57 | 619.42702 | −0.54 | C36H59O8 | 21.66 | 619.42702 | −1.42 | Ginsenoside Rk3 |
| 19 | 22.90 | 782.49550 | −0.91 | C42H71O13 | 22.96 | 782.49550 | 0.18 | Ginsenoside Rg3 |
| 20 | 31.56 | 621.44267 | −1.08 | C36H61O8 | 31.55 | 621.44267 | −1.60 | 20(S)-Ginsenoside Rh2 |
3.6 HPLC analysis of individual ginsenoside
The results of linearity, precision, accuracy and stability experiments are shown in Table 4. Rg1 and Re in MCG are 0.342% (not less than 0.27% according to Chinese Pharmacopoeia), the content was 1.47 times of CG; Rb1 in MCG was 0.24% (not less than 0.18% according to Chinese Pharmacopoeia), the content was 1.28 times of CG. The total content of all ginsenosides in MCG was twice that of CG. The content of rare ginsenosides Rg3, 20(R/S)-Rg2, Rk3, 20(S)-Rh2, 20(R)-Rh1, F1 in MCG were 2.5, 3.7, 1.7, 33, 24 and 5.5-fold higher than CG, respectively. The content of ginsenoside Rg6 in MCG was 0.01 mg g−1, which was not detected in CG. Rare ginsenoside Rg3 is the main component of “Shenyi capsule”, which is listed in China. Rh2 is the metabolite and transformation product of Rg3.21 Its anti-tumor activity is four-fold higher than that of Rg3.22 Rare ginsenosides Rg2, Rh1, Rk3 represent the transformation or metabolites of ginsenoside Re,23,24 have been touted as new ‘anti-neoplastic pharmacophores’, with improved bioavailability and potency compared to the prototype ginsenosides.25| No. | Comp. | Liner regression data | Precision RSD (%) | Stability RSD (%) | Content (mg g−1) | ||||
|---|---|---|---|---|---|---|---|---|---|
| Liner | R2 | Range (mg mL−1) | Intra-day | Inter-day | MCG | Garden ginseng | |||
| 1 | Ginsenoside Re/Rg1 | Y = 5 × 10⁶X + 11560 |
0.9995 | 0.02–2.33 | 2.28 | 1.44 | 2.54 | 3.42 ± 0.19 | 2.33 ± 0.21 |
| 2 | 20(S)-Notoginsenoside G | Y = 6 × 10⁶X + 9935.1 | 0.9994 | 0.02–1.50 | 2.16 | 2.30 | 1.52 | 0.79 ± 0.01 | 0.10 ± 0.01 |
| 3 | Vina-ginsenoside R4 | Y = 7 × 10⁶X + 1798.9 | 0.9999 | 0.02–1.82 | 1.95 | 1.92 | 1.62 | 0.38 ± 0.01 | 0.12 ± 0.07 |
| 4 | Ginsenoside Rb1 | Y = 7 × 10⁶X + 18577 |
0.9992 | 0.01–1.45 | 2.21 | 1.42 | 2.46 | 2.17 ± 0.12 | 1.69 ± 0.14 |
| 5 | Ginsenoside Ia | Y = 4 × 10⁶X − 4337.3 | 0.9994 | 0.02–1.86 | 1.04 | 2.77 | 2.52 | 0.28 ± 0.02 | 0.02 ± 0.00 |
| 6 | Ginsenoside Rc | Y = 1 × 10⁶X − 13539 |
0.9991 | 0.02–1.96 | 1.68 | 2.58 | 1.23 | 0.28 ± 0.03 | 0.04 ± 0.01 |
| 7 | Notoginsenoside Fz | Y = 1 × 10⁷X − 14124 |
0.9991 | 0.02–1.85 | 1.95 | 1.54 | 1.52 | 0.04 ± 0.00 | 0.02 ± 0.00 |
| 8 | Ginsenoside Rb2 | Y = 2 × 10⁶X − 2579.4 | 0.9997 | 0.02–1.77 | 1.19 | 1.31 | 2.49 | 0.05 ± 0.01 | 0.04 ± 0.01 |
| 9 | Ginsenoside Rb3 | Y = 2 × 10⁶X − 2128.4 | 0.9998 | 0.01–1.48 | 1.39 | 2.73 | 2.74 | 1.27 ± 0.11 | 0.14 ± 0.03 |
| 10 | 20(R/S)-Ginsenoside Rg2 | Y = 5 × 10⁶X + 3572.7 | 0.9994 | 0.02–2.17 | 2.13 | 2.29 | 1.64 | 0.11 ± 0.02 | 0.03 ± 0.00 |
| 11 | 20(R)-Ginsenoside Rh1 | Y = 3 × 10⁶X − 3519.3 | 0.9996 | 0.01–1.46 | 1.05 | 1.19 | 2.40 | 0.24 ± 0.06 | 0.01 ± 0.00 |
| 12 | Ginsenoside F1 | Y = 8 × 10⁶X – 435.51 | 0.9996 | 0.01–1.46 | 2.22 | 2.74 | 2.65 | 0.11 ± 0.03 | 0.02 ± 0.00 |
| 13 | Notoginsenoside Fe | Y = 5 × 10⁶X − 3287.5 | 0.9996 | 0.01–1.41 | 1.44 | 2.84 | 1.79 | 0.05 ± 0.01 | 0.03 ± 0.01 |
| 14 | Ginsenoside Rd2 | Y = 3 × 10⁶X − 3709.4 | 0.9990 | 0.02–1.97 | 1.60 | 1.47 | 2.09 | 0.03 ± 0.00 | 0.01 ± 0.00 |
| 15 | Ginsenoside Rg6 | Y = 6 × 10⁶X − 981.37 | 0.9999 | 0.01–1.07 | 2.42 | 2.56 | 2.43 | 0.01 ± 0.00 | — |
| 16 | Ginsenoside Rk3 | Y = 1 × 10⁷X − 6306.3 | 0.9998 | 0.01–1.02 | 1.73 | 1.01 | 2.35 | 0.05 ± 0.01 | 0.03 ± 0.00 |
| 17 | Ginsenoside Rg3 | Y = 8 × 10⁶X + 3700.7 | 0.9994 | 0.01–1.04 | 2.62 | 2.10 | 2.79 | 0.05 ± 0.01 | 0.02 ± 0.00 |
| 18 | 20(S)-Ginsenoside Rh2 | Y = 6 × 10⁶X − 4268.1 | 0.9999 | 0.01–1.36 | 1.90 | 1.13 | 2.53 | 0.33 ± 0.08 | 0.01 ± 0.00 |
4 Conclusion
In this study, FEM protocol was used to extract ginsenosides from MCG. In total, 23 ginsenosides were isolated from the MCG and were determined by HPLC-FT-ICR-MS. We isolated notoginsenoside R1 for the first time in MCG. The simultaneous determination of 20 ginsenosides in MCG and CG by HPLC-UV showed that the ginsenoside content in MCG was significantly higher than that in CG. The content of rare ginsenosides Rg3, 20(R/S)-Rg2, Rk3, 20(S)-Rh2, 20(R)-Rh1, F1 and Rg6 in MCG were higher than those of CG, respectively. The FEM not only provided a simple, feasible, quick and efficient sample processing method for the quality analysis of MCG and CG, but avoided the unstable or uncontrollable quality caused by the thermal transformation or decomposition of the prototype ginsenosides. The discovery of high content of rare ginsenosides in MCG provides characteristic detection indices for quality evaluation. This provides an important theoretical basis for its significant biological activities including anti-tumor and immune enhancement of MCG and its clinical medicinal and health care value.Conflicts of interest
There is no conflict of interests regarding the publication of this paper.Acknowledgements
The research was supported by National Natural Science Foundation of China (81903518 and 81703389), Doctoral Research Startup Fund Item of Liaoning Province (2019-BS-232), Liaoning (FGW) Engineering Technology Research Center for industrial chromatographic preparation of natural innovative drugs materials (2017-1007) and Technology Platform of Industrialization Chromatographic Preparation for Standard Extract of Traditional Chinese Medicine (2010ZX09401-304-105B).References
- G. Y. Hou, J. Niu, F. R. Song, Z. Q. Liu and S. Y. Liu, J. Chromatogr. B, 2013, 923–924, 1–7 CrossRef CAS
.
- T. Li, W. Sun, X. Q. Dong, W. H. Yu, J. Y. Cai, Q. Yuan, L. Shan and T. Efferth, Oncol. Lett., 2018, 16, 4640–4648 Search PubMed
- L. L. Jiao, X. Y. Zhang, B. Li, Z. Liu, M. Z. Wang and S. Y. Liu, Int. J. Biol. Macromol., 2014, 65, 229–233 CrossRef CAS
- B. Zhao, X. Wang, H. Liu, C. Lv and J. Lu, Int. J. Biol. Macromol., 2020, 150, 737–745 CrossRef CAS
- H. S. Lee, M. R. Kim, Y. Park, H. J. Park, Y. J. Chang, S. Y. Kim and H. J. Suh, J. Med. Food, 2012, 15, 1015–1023 CrossRef CAS
- S. Lee, K. Youn and M. Jun, Food Funct., 2018, 9, 4122–4134 RSC
- J. Xu, X. Wang, G. Su, J. Yue, Y. Sun, J. Q. Cao, X. S. Zhang and Y. Zhao, J. Funct. Foods, 2018, 46, 567–578 CrossRef CAS
- Y. Q. Zhao, L. J. Wu, C. L. Yuan, X. Li and J. Chen, Chin. Chem. Lett., 1992, 3, 887–888 CAS
- Y. Q. Zhao, W. Wang, E. Rayburn, D. L. Hill, H. Wang and R. W. Zhang, Med. Chem., 2007, 3, 51–60 CrossRef CAS
- H. Fan, K. Li, F. Yao, L. W. Sun and Y. J. Liu, BMC Plant Biol., 2019, 19, 82 CrossRef
- D. Xiao, H. Yue, Y. Xiu, X. L. Sun, Y. B. Wang and S. Y. Liu, J. Ginseng Res., 2015, 39, 338–344 CrossRef CAS
- The Pharmacopoeia of the People's Republic of China, 2015 Search PubMed.
- X. Huang, Y. Liu, Y. Zhang, S. P. Li, H. Yue, C. B. Chen and S. Y. Liu, J. Ginseng Res., 2019, 43, 27–37 CrossRef
- H. D. Song, R. J. Yang, W. Zhao, W. Katiyo, X. Hua and W. B. Zhang, J. Agric. Food Chem., 2014, 62, 3802–3812 Search PubMed
- J. Liu, C. Liu, Y. H. Rong, L. Rong and G. L. Huang, Solvent Extr. Res. Dev., 2012, 19, 137–145 CrossRef CAS
- Q. B. Song, X. Xia, C. M. Ji, D. F. Chen and Y. Lu, J. Pharm. Biomed. Anal., 2019, 172, 379–387 CrossRef CAS
- L. Kan, L. Wang, Q. Ding, Y. Wu and J. Ouyang, J. Oleo Sci., 2017, 66, 345–352 CrossRef CAS
- Y. P. Zhang, R. J. Yang and W. N. Zhang, Food Chem., 2017, 219, 48–53 CrossRef CAS
- H. Suo, R. C. Tian, J. Li, S. T. Zhang, Y. Cui, L. X. Li and B. S. Sun, Food Res. Int., 2019, 123, 440–449 CrossRef CAS
- H. Zhu, H. Lin, J. Tan, C. Wang, H. Wang, F. Wu, Q. Dong, Y. Lin, P. Li and J. Liu, Molecules, 2019, 224, 33–54 Search PubMed
- E. A. Bae, M. J. Han, M. K. Choo, S. Y. Park and D. H. Kim, Biol. Pharm. Bull., 2002, 25, 58–63 CrossRef CAS
- J. H. Cheong, H. Kim, M. J. Hong, M. H. Yang, J. W. Kim, H. Yoo, H. Yang, J. H. Park, S. H. Sung, H. P. Kim and J. Kim, Pharm. Bull., 2015, 38, 102–108 CrossRef CAS
- H. Y. Wang, C. Wang, S. C. Guo, Z. C. Chen, Z. T. Peng, R. Duan, T. T. X. Dong and K. W. K. Tsim, J. Pharm. Biomed. Anal., 2019, 175, 112779 CrossRef CAS
- J. Han, J. Xia, L. Zhang, E. Cai, Y. Zhao, X. Fei, X. Jia, H. Yang and S. Liu, J. Ginseng Res., 2019, 43, 618–624 CrossRef
- T. Biswas, A. K. Mathur and A. Mathur, Appl. Microbiol. Biotechnol., 2017, 101, 4009–4032 CrossRef CAS
Footnotes |
| † Electronic supplementary information (ESI) available. See DOI: 10.1039/d0ra07517e |
| ‡ Two authors contributed equally to this work. |
| This journal is © The Royal Society of Chemistry 2020 |