DOI:
10.1039/D0RA07423C
(Paper)
RSC Adv., 2020,
10, 39712-39721
Preparation and properties of aramid pulp/acrylonitrile-butadiene rubber composites
Received
29th August 2020
, Accepted 14th October 2020
First published on 30th October 2020
Abstract
In this investigation, aramid pulp (AP) was introduced into acrylonitrile-butadiene rubber (NBR)-based composites in various amounts by two different introduction methods. An AP/NBR predispersion was applied to improve the AP dispersion in the matrix, and its effects on the characteristics and properties of the composites were studied. The results showed that the optimum curing time of the compounds was affected by the AP introduction method due to heat generation at different mixing stages. The addition of AP affected the swelling properties and significantly improved the hardness, modulus and tear strength. The tensile strength decreased and then increased with increasing AP content. The AP predispersion obviously further improved the tensile strength of the composites with AP content above 7.5 phr owing to better fiber network formation inside the rubber matrix during the stretching process. The dynamic mechanical properties were not sensitive to the AP introduction method. The addition of AP was conducive to the wear resistance, and the dispersion improvement could further enhance the uniformity of the worn surface and mitigate crack generation.
1. Introduction
Fibrillation is the longitudinal splitting of a single fiber filament into microfibers.1 It is a common phenomenon for synthetic fibers with relatively small number of lateral links between the crystallites2–5 and occurs under various conditions, such as beating,6–8 agitation,9–11 dry milling,5 transverse compression,3 stretching12,13 and the mixing process.14,15 Aramid pulp (AP) is a type of highly fibrillated aramid fiber (AF).16–18 AP retains a high tensile-strength-to-weight ratio, excellent thermal resistance, wear resistance and flame retardancy, and furthermore dramatically increases the surface area compared to that of AF. So far, AP has been applied in the field of specialty/functional and high-performance paper.19–21 Another important application of AP is as a reinforcement in the preparation of polymer-based composites. These composites have been widely used in adhesives,22 packaging material,23 thermal insulators,24–26 wind turbine generator blades,27 tires28,29 and braking systems.30–33 It should be emphasized that AP is considered to be an eco- and health-friendly substitute for asbestos fiber, especially in braking systems.
Though the large surface area of AP promotes its adhesion with the matrix when applied as reinforcement in composite materials, there are some disadvantages for this high fibrillation. First, the increased pulp volume compared to that of the AFs and the static electricity on the AP enhance the difficulty of the mixing process. Second, the entanglement between the microfibers leads to fiber aggregation in the matrix, which may decrease the properties of the AP-reinforced composites.16,34,35 In recent years, the dispersion improvement of the AP in polymer matrix, including resin and rubber, has attracted more attention from the academic world. Many methods, such as chemical modification of the AP,17,34 predispersion in the low-molecular-weight polymer36 and physical isolation,37,38 have been developed. Kong et al.34 synthesized and deposited ZnO nanoparticles on the AP surface with the assistance of supercritical CO2, which improved AP dispersion in the epoxy matrix. Zhang et al.38 improved the dispersion of AP by adding isolation media (including hollow glass beads and a lubricant). The results showed that AP dispersion via this method was conducive to increasing the tensile strength of AP/rubber composites.
Acrylonitrile-butadiene rubber (NBR) is a type of synthetic rubber with excellent oil resistance and good wear resistance. It has been widely applied in the fields such as tubes, seals and bearings. Nowadays, NBR composites reinforced with novel fillers, such as nano-fillers, green fillers and high-performance fibers are investigated and reported by researchers.39–42 The AP/NBR composite is considered to be a good candidate in many application fields, such as the damping material,43 the friction material,44 seals,45 and the heat-insulating layer.46 As reported by Teng et al.,47 surface treatments of the AP can improve the tensile strength of the AP/NBR composites by increasing both adhesion between the AP and the NBR matrix and the AP dispersibility. However, the complex procedures and high cost may limit its practical application. In this study, the AP/NBR composites with various AP contents were prepared, and a simple predispersion method was developed for AP dispersion improvement without introducing any extra ingredients or complex process. The effects of the AP content and its introduction method on swelling properties, thermal decomposition, physical/mechanical properties, dynamic mechanical properties and composite wear resistance were systematically evaluated.
2. Experimental
2.1. Main materials
The AP (specific surface area: 10–14 m2 g−1; length: 1.5 mm) was supplied by Selen Advanced Material, Chengdu, China. The acrylonitrile-butadiene rubber (NBR) (NANCAR1051, ACN content: 41%) was purchased from Nantex Industry Co., Ltd., Zhenjiang, China. Carbon black (CB, a reinforcing filler) N550 was supplied from Kabote (China) Investment Co., Ltd. ZnO (an activator) was obtained from US Zinc (Changshu), China. Stearic acid (SA, an activator) was obtained from Qingdao Kangan Rubber Co., Ltd., China. Polymerized 1,2-dihydro-2,2,4-trimethyl-quinoline (TMQ, an antiaging reagent) was supplied from Sinopec Nanjing Co., Ltd., China. Dioctyl phthalate (DOP, a plasticizer) was purchased from Wuxi Yatai Chemicals, China. Insoluble sulfur (S, a curing agent) was purchased from Shandong Sunsine Chemical, China. N-Cyclohexyl-2-benzothiazole sulphonamide (CBS, an accelerator) was supplied by Puyang Willing Chemicals, China.
2.2. Preparation of the rubber compounds
The components of the AP/NBR composites are presented in Table 1. AP was introduced into the rubber compounds through the two methods listed below.
Table 1 Ingredients and composition of the AP/NBR composites
| Component |
Content/phra |
| Parts per hundred of the rubber. |
| NBR |
100 |
| ZnO |
5 |
| SA |
1 |
| CB N550 |
50 |
| TMQ |
1.2 |
| DOP |
10 |
| AP |
0/2.5/5/7.5/10/15/25 |
| CBS |
1 |
| S |
1.5 |
2.2.1. Predispersion method. In this method, AP was first mixed with NBR in a ratio of 25![[thin space (1/6-em)]](https://www.rsc.org/images/entities/char_2009.gif) :
:![[thin space (1/6-em)]](https://www.rsc.org/images/entities/char_2009.gif) 80 (mass ratio) on an open two-roll mill (BL-6175-AL, Dongguan Baolon, China, initial temperature: 40 °C, roll speed: 20 rpm), and a predispersed AP/NBR blend was obtained (Fig. 1(b)). Then, the composites were prepared using the following steps. The predispersed AP/NBR blends, NBR, ZnO, SA, TMQ, CB and DOP were first mixed in an internal mixer (XSM-500, Shanghai Kechuang, China) for 8 min (initial temperature: 90 °C, rotor speed: 35 rpm). Then, the blend was further mixed on a two-roll mill, and CBS and S were added in sequence. After being fully mixed, the rubber compounds were obtained.
80 (mass ratio) on an open two-roll mill (BL-6175-AL, Dongguan Baolon, China, initial temperature: 40 °C, roll speed: 20 rpm), and a predispersed AP/NBR blend was obtained (Fig. 1(b)). Then, the composites were prepared using the following steps. The predispersed AP/NBR blends, NBR, ZnO, SA, TMQ, CB and DOP were first mixed in an internal mixer (XSM-500, Shanghai Kechuang, China) for 8 min (initial temperature: 90 °C, rotor speed: 35 rpm). Then, the blend was further mixed on a two-roll mill, and CBS and S were added in sequence. After being fully mixed, the rubber compounds were obtained.
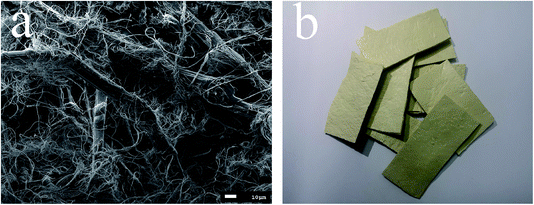 |
| | Fig. 1 (a) SEM image of the AP and (b) the photograph of the cut AP/NBR predispersion blend. | |
2.2.2 Open-mixing method. In this method, the rubber blends containing NBR, SA, ZnO, TMQ, DOP and CB were first obtained via internal mixing for 8 min (initial temperature: 90 °C, rotor speed: 35 rpm). Then, the blend was further mixed on a two-roll mill with AP, CBS and S, and the rubber compounds were obtained.
2.3. Vulcanization
The compounds obtained in Section 2.2 were cured at 155 °C at a pressure of 10 MPa, and the curing time was determined by the optimum cure time (t90). The composites were named according to the mixing method and the AP content. For example, the samples with 10 phr AP prepared via predispersion and open-mixing methods were denoted as 10pd-AP and 10AP, respectively. For comparison, the sample without AP was also prepared and denoted as Ref.
2.4. Characterization
A moving die rheometer (MDR2000, Alpha Technologies, US) was used to evaluate the vulcanizing properties of the rubber compounds in accordance with GB/T 16584-1996. Thermogravimetric analysis (TGA) was performed on a thermogravimetric analyzer (STA 449F5, NETZSCH, Germany) in N2 within the temperature range of 50–700 °C at a ramp rate of 10 °C min−1. The hardness test was conducted using a GT-GS-MB Shore A hardness tester (Gotech Testing Machines Co., Ltd. China) in accordance with GB/T 531.1-2008. The rebound resilience was tested by GT-7042-RDH rebound tester (Gotech Testing Machines Co., Ltd., Taiwan) in accordance with GB/T 1681-2009. The density of the composites was tested by XB 220A balance (Precisa, Switzerland) according to GB/T 533-2008. Three samples were tested for hardness, density and rebound resilience, and the mean values were calculated and reported. Tensile and tear tests were conducted using a Z005 universal testing machine (Germany) at a drawing rate of 500 mm min−1 in accordance with GB/T 528-2009 and GB/T 529-2008 standards, respectively. Five specimens were tested for each type of sample. The mean value and the standard deviation were reported. A dynamic mechanical analyzer (DMA, TA instrument Q800, US) was applied to characterize the dynamic mechanical properties of the composites in tension mode at a constant frequency of 10 Hz and strain of 0.2%. The temperature range of this test was −40 °C to 50 °C, and the heating rate was 3 °C min−1.
For the swelling ratio and crosslinking density tests, the cured NBR-based composites were cut into circular samples with 30 mm diameter and 2 mm thickness. These composite samples were immersed in 100 mL toluene at room temperature for 72 h to reach equilibrium, separately, and then the samples were vacuum drying at 80 °C. The swelling ratio (Q) was calculated according to eqn (1), and the crosslinking density (Vr) of the composites was calculated according to Flory–Rehner equation (eqn (2) and eqn (3)):
| |
 | (1) |
| |
 | (2) |
| |
 | (3) |
where
Vs is the molar volume of the solvent toluene;
V2 is the volume fraction of the rubber phase in the swelling samples;
χ is the interaction parameter between NBR and the toluene (0.435);
m1 is the mass of the composite sample before immersing;
m2 is the mass after swelling balance;
m3 is the mass of composite sample after vacuum drying at 80 °C; the
ρ1,
ρ2,
ρ3 are the density of the corresponding sample, respectively; and
ρs is the density of the toluene. Three samples were tested for each composite and the mean value was calculated.
A high-speed block-on-ring wear testing machine (MR-H3B, Jinan Time Shijin Testing Machine Co., Ltd., China) was used to evaluate the wear resistance of the AP/NBR composites under dry conditions. The dimensions of the composite block and the stainless-steel (304#) ring and the calculation of the specific wear rate (Ws) were the same as described in our previous study.48 The normal load, sliding speed and duration applied in this study were 40 N, 300 rpm and 90 min, respectively.
The surface morphologies of AP, the AP/NBR premixture and the typical fracture/worn surfaces of the final composites were observed by scanning electron microscopy (SEM, JEOL JSM-7500F, Japan).
3. Experimental results and discussion
3.1. Composite preparation
The AP morphology is as shown in Fig. 1(a). A great number of microfibers split from the main body and twisted together, which increased the difficulty of dispersion in the rubber matrix. In this study, AP/NBR composites were prepared via two methods. For the predispersion method, the AP/NBR ratio of the pre-dispersed blend was optimized from two aspects. (1) The AP should be evenly dispersed in the matrix; and (2) the AP content in the pre-dispersed blend should be as high as possible so that the AP content in the final composites could reach a high level. In this study, the AP was first mixed with NBR in a ratio of 25![[thin space (1/6-em)]](https://www.rsc.org/images/entities/char_2009.gif) :
:![[thin space (1/6-em)]](https://www.rsc.org/images/entities/char_2009.gif) 80, and the blends were prepared in pieces with 1 mm thickness (Fig. 1(b)) before further mixing with the rest of the rubber and other ingredients. Influences of the AP content and its introduction method on the vulcanizing properties of the NBR-based compounds are shown in Table 2. AP did not participate in the vulcanization of NBR; however, t90 was determined by the AP introduction process. When AP was predispersed in NBR, it did not considerably affect t90, which obviously decreased when the AP/NBR composites were prepared via an open-mixing method. This result occurred because of the impact of heat generation during AP/NBR mixing, which should not be ignored. For the composites prepared via the predispersion method, heat generation mainly occurred in the predispersion and internal mixing processes. For example, Table 3 lists different discharging temperatures in the internal mixing process, showing an obvious temperature increase for the pd-AP samples compared with the AP samples. However, for the composites prepared via the open-mixing method, mixing of the stiff pulp and NBR was finished on an open mill, and slight crosslinking between the rubber molecular chains occurred due to heat generation since S was already added to the compounds in this step. This crosslinking led to a decrease in the measured t90, which was basically decreased with increasing AP content. However, for the pd-samples, heat generation during open mixing was much lower because the AP and rubber were fully mixed before this step, and the measured t90 of the composites was independent of the AP content. Furthermore, the cure rate index (CRI) of the AP samples increased with the AP content in general, whereas the CRI of the pd-AP samples was not much affected.
80, and the blends were prepared in pieces with 1 mm thickness (Fig. 1(b)) before further mixing with the rest of the rubber and other ingredients. Influences of the AP content and its introduction method on the vulcanizing properties of the NBR-based compounds are shown in Table 2. AP did not participate in the vulcanization of NBR; however, t90 was determined by the AP introduction process. When AP was predispersed in NBR, it did not considerably affect t90, which obviously decreased when the AP/NBR composites were prepared via an open-mixing method. This result occurred because of the impact of heat generation during AP/NBR mixing, which should not be ignored. For the composites prepared via the predispersion method, heat generation mainly occurred in the predispersion and internal mixing processes. For example, Table 3 lists different discharging temperatures in the internal mixing process, showing an obvious temperature increase for the pd-AP samples compared with the AP samples. However, for the composites prepared via the open-mixing method, mixing of the stiff pulp and NBR was finished on an open mill, and slight crosslinking between the rubber molecular chains occurred due to heat generation since S was already added to the compounds in this step. This crosslinking led to a decrease in the measured t90, which was basically decreased with increasing AP content. However, for the pd-samples, heat generation during open mixing was much lower because the AP and rubber were fully mixed before this step, and the measured t90 of the composites was independent of the AP content. Furthermore, the cure rate index (CRI) of the AP samples increased with the AP content in general, whereas the CRI of the pd-AP samples was not much affected.
Table 2 Vulcanizing properties of the compounds
| |
Scorch time (t10)/min |
Optimum cure time (t90)/min |
Cure rate index (CRI)a/min−1 |
Minimum torque (ML)/(dN m) |
Maximum torque (MH)/(dN m) |
MH–ML/(dN m) |
| CRI = 100/(t90 − t10). |
| Ref |
2.5 |
12.2 |
10.3 |
1.3 |
14.4 |
13.1 |
| 2.5AP |
2.5 |
11.0 |
11.8 |
1.5 |
16.0 |
14.5 |
| 5AP |
2.6 |
10.6 |
12.5 |
2.3 |
20.1 |
17.8 |
| 7.5AP |
2.6 |
10.2 |
13.2 |
2.5 |
21.5 |
19.0 |
| 10AP |
2.6 |
10.2 |
13.2 |
2.7 |
22.8 |
20.1 |
| 15AP |
2.6 |
9.8 |
13.9 |
3.1 |
23.8 |
20.7 |
| 25AP |
2.6 |
10.0 |
13.5 |
3.2 |
27.9 |
24.7 |
| 2.5pd-AP |
2.7 |
11.9 |
10.9 |
1.5 |
15.8 |
14.3 |
| 5pd-AP |
2.7 |
11.8 |
11.0 |
2.0 |
18.3 |
16.3 |
| 7.5pd-AP |
2.8 |
11.7 |
11.2 |
2.2 |
19.7 |
17.5 |
| 10pd-AP |
2.8 |
11.6 |
11.4 |
2.6 |
21.9 |
19.3 |
| 15pd-AP |
2.8 |
11.7 |
11.2 |
3.4 |
25.9 |
22.5 |
| 25pd-AP |
2.8 |
12.3 |
10.5 |
4.4 |
32.7 |
28.3 |
Table 3 Discharging temperatures of rubber compounds in the internal mixing process (initial temperature: 90 °C)
| Sample |
Discharging temperature/°C |
| Ref |
120 |
| 2.5AP |
122 |
| 5AP |
121 |
| 7.5AP |
121 |
| 10AP |
120 |
| 15AP |
120 |
| 25AP |
122 |
| 2.5pd-AP |
124 |
| 5pd-AP |
128 |
| 7.5pd-AP |
131 |
| 10pd-AP |
133 |
| 15pd-AP |
137 |
| 25pd-AP |
143 |
Different from t90, the minimum torque (ML) and maximum torque (MH) were sensitive to both the AP content and the introduction method. As shown in Table 2, with increasing AP content, both ML and MH significantly increased, regardless of the preparation method, likely due to the high AP stiffness. It is worth noting that when the AP content was above 15 phr, the torque of the pd-AP samples rapidly increased with the AP content and became obviously higher than that of the samples prepared via the open-mixing method, which is attributed to the AP dispersion improvement (Fig. 2). With increasing AP content, the good AP dispersion in the matrix was more conducive to the formation of the uniform fiber network in the matrix and became the main factor in determining the measured torque.
3.2. Swelling properties
The swelling ratio and the crosslinking density of the typical AP/NBR composites are shown in Table 4. The addition of AP decreased the swelling ratio of the composites since the rubber content decreased. However, the introduction method of the AP did not much affect the swelling ratio since the connection between the fiber and the rubber was weak and the dispersion degree had little influence on the solvent absorption capacity. Furthermore, the test value of the crosslinking density of the composites increased with the AP content but was independent with its introduction method.
Table 4 The swelling ratio and crosslinking density of typical AP/NBR composites
| |
Swelling ratio/% |
Crosslinking density/(×10−3 mol cm−3) |
| Ref |
2.28 |
0.96 |
| 5AP |
2.07 |
1.37 |
| 25AP |
1.84 |
2.03 |
| 5pd-AP |
2.04 |
1.44 |
| 25pd-AP |
1.83 |
2.05 |
3.3. Thermal decomposition behavior
The thermal decomposition behavior of the AP and the NBR-based composites with 0- and 25-phr AP was shown in Fig. 3 and Table 5. For the composite without AP (Ref), the thermal decomposition can be divided into two steps. First, the low molecular components, such as the plasticizer were decomposed from around 200 °C, and then the polymer was decomposed from around 360 °C. When the AP was introduced, a third stage can be seen in the TG curves, since the AP is decomposed up to around 600 °C. The addition of the AP did not obviously impact the residue weight at 650 °C (Rw650) since the Rw650s of the pulp and the NBR composites were similar.
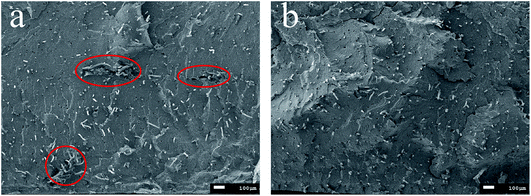 |
| | Fig. 2 SEM micrographs of brittle fracture surface of (a) 10AP and (b) 10pd-AP. | |
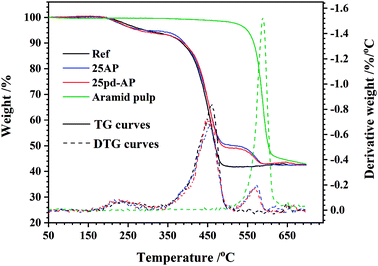 |
| | Fig. 3 TGA curves of the AP and typical AP/NBR composites. | |
Table 5 Thermal properties of the typical AP/NBR composites
| Sample |
Tonset/°C |
T10%a/°C |
Tmaxa/°C |
RW650a/% |
| T10%: temperature at 10% weight loss; Tmax: temperature at maximum weight loss rate; Rw650: residual weight ratio at 650 °C in nitrogen. |
| Ref |
405 |
386 |
460 |
43 |
| 25AP |
406 |
392 |
453 |
43 |
| 25pd-AP |
408 |
390 |
453 |
44 |
3.4. Characteristics and mechanical properties of the vulcanizates
The physical characteristics of the AP/NBR composites are displayed in Table 6. With increasing AP content, the hardness sharply increased; however, the rebound resilience and density of the composites were not obviously influenced. The preparation method did not influence the physical properties. In other words, the density, hardness and rebound resilience of the composites were not sensitive to the AP dispersion. Fig. 4 shows the influences of the AP content and the introduction method on the tensile strength and elongation at break of the NBR-based composites. With increasing AP content, the tensile strength initially decreased and then increased when the AP content was above 7.5 phr, and the elongation at break sharply decreased. Though the AP morphology was different from that of the AF, the effects of the AP on the tensile properties were similar to those of short AFs.41 In our previous study, it was demonstrated that the poor chemical bonding of AF/NBR was an obstacle in exploiting the full potential of the high-performance fibers, which led to a tensile strength decrease when the AF was introduced at a relatively low content (<7.5 phr). In this study, we found that the fibrillation of AF did not considerably influence this trend, though the physical connection was improved. However, when the AP content was above 7.5 phr, the tensile strength increased with AP content because of the fiber entanglement and the formation of the fiber network. The dispersion improvement of AP increased the tensile strength of the composites with a relatively high AP content. For example, the tensile strength of 15pd-AP was 24.5 MPa, which was approximately 36% higher than that of 15AP attributed to the decrease of crack origin caused by the fiber aggregation (Fig. 5) and the fiber entanglement improvement. It is worth noting that when the AP content was above 10 phr, the tensile strength of the pd-AP samples was better than that of the Ref, which demonstrated the enhancing effect of AP via physical entanglement. However, the elongation at break of the NBR-based composites was severely impacted even if the AP was evenly dispersed since the rubber matrix was serious damaged by the pulled-out AP and the entangled rigid AP bore the load independently. Furthermore, as shown in Fig. 6, the dispersion improvement of AP was also beneficial to the rapid increase in the modulus at the early stage of stretching, especially for samples with a high AP content.
Table 6 Physical properties of the AP/NBR composites
| |
Density/(g cm−3) |
Shore A hardness |
Rebound resilience/% |
| Ref |
1.19 |
65 |
28 |
| 2.5AP |
1.19 |
73 |
27 |
| 5AP |
1.20 |
74 |
27 |
| 7.5AP |
1.20 |
78 |
27 |
| 10AP |
1.20 |
80 |
27 |
| 15AP |
1.21 |
83 |
28 |
| 25AP |
1.21 |
89 |
30 |
| 2.5pd-AP |
1.20 |
72 |
26 |
| 5pd-AP |
1.20 |
75 |
26 |
| 7.5pd-AP |
1.20 |
78 |
27 |
| 10pd-AP |
1.20 |
80 |
27 |
| 15pd-AP |
1.21 |
84 |
27 |
| 25pd-AP |
1.22 |
89 |
28 |
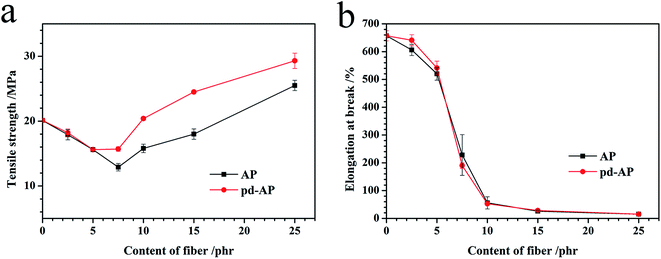 |
| | Fig. 4 (a) Tensile strength and (b) elongation at break of the AP/NBR composites with various AP contents prepared via different methods. | |
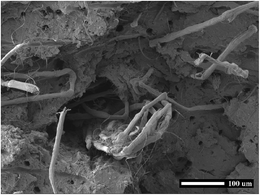 |
| | Fig. 5 SEM micrograph of tensile fracture section of 7.5AP. | |
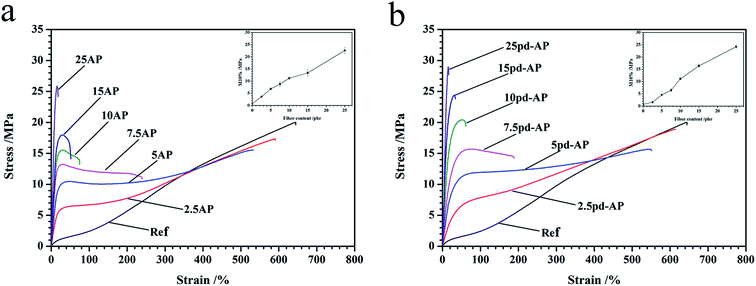 |
| | Fig. 6 Stress–strain behaviors of AP/NBR composites prepared via (a) the open-mixing method and (b) the predispersion method. | |
Fig. 7 show the typical SEM images of the tensile fracture of the Ref, and typical AP/NBR composite samples, respectively. The microfibers on the surface of AP (shown in Fig. 1(a)) were mainly peeled off from the main body during mixing and stretching and evenly dispersed in the matrix. As a consequence, the contact area between the fiber and the matrix was dramatically increased. When the AP content was 7.5 phr, the fibers were relatively sparsely arranged in the matrix (Fig. 7(b) and (d)); whereas for the composites with 25 phr AP, the pulp was entangled together (Fig. 7(c) and (e)). These phenomena could demonstrate the effect mechanism of the AP on the tensile properties. The weak connection between the fiber and the matrix led to their separation at the early stage, which resulted in the generation of crack origin and decreased the tensile strength/elongation at break. However, when the AP content was high, the entangled fibers bore the load independently, so the tensile strength obviously increased and the elongation at break dramatically decreased.
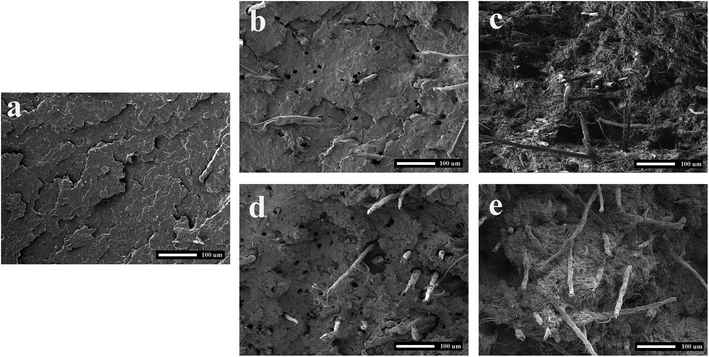 |
| | Fig. 7 SEM micrographs of tensile fracture section of (a) Ref; (b) 7.5AP; (c) 25AP; (d) 7.5pd-AP; and (e) 25pd-AP. | |
However, for the tear process, as shown in Fig. 8, the predispersed AP did not mitigate the matrix damage, and the tear strength of the pd-AP samples was slightly lower than that of the samples obtained via the open-mixing method (Fig. 9). The effect mechanism of the fibers on the tear properties of the rubber-based composites is preventing crack propagation, and the slight fiber aggregation may reinforce this effect.
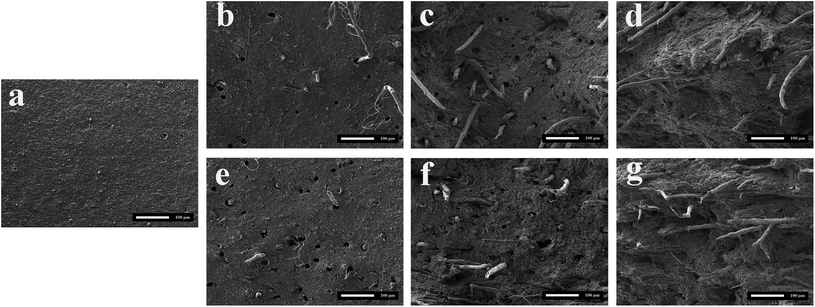 |
| | Fig. 8 SEM micrographs of tear fracture surface of (a) Ref; (b) 2.5AP; (c) 10AP; (d) 25AP; (e) 2.5pd-AP; (f) 10pd-AP; (g) 25pd-AP. | |
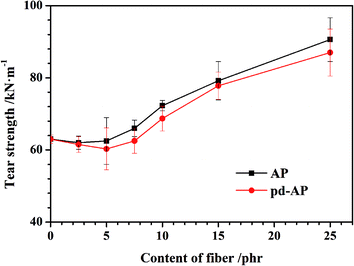 |
| | Fig. 9 Tear strength of the AP/NBR composites prepared via different methods. | |
3.5. Dynamic mechanical properties
Fig. 10 illustrates the storage modulus (E′), loss modulus (E′′) and loss tangent (tan![[thin space (1/6-em)]](https://www.rsc.org/images/entities/char_2009.gif) δ) curves of the NBR-based composites prepared via the open-mixing method and the predispersion method, respectively, and the main parameters are listed in Table 7. With increasing AP content, E′ at 20 °C increased, whereas tan
δ) curves of the NBR-based composites prepared via the open-mixing method and the predispersion method, respectively, and the main parameters are listed in Table 7. With increasing AP content, E′ at 20 °C increased, whereas tan![[thin space (1/6-em)]](https://www.rsc.org/images/entities/char_2009.gif) δmax decreased, which was due to the high rigidity of the AP. The dispersion improvement of the AP did not further impact the dynamic mechanical properties except decreasing the E′ of the composites. This phenomenon may be attributed to the weak chemical interaction between the fiber and the NBR molecular chain. The dispersion improvement did not enhance the limitation of the molecular chain movement.
δmax decreased, which was due to the high rigidity of the AP. The dispersion improvement of the AP did not further impact the dynamic mechanical properties except decreasing the E′ of the composites. This phenomenon may be attributed to the weak chemical interaction between the fiber and the NBR molecular chain. The dispersion improvement did not enhance the limitation of the molecular chain movement.
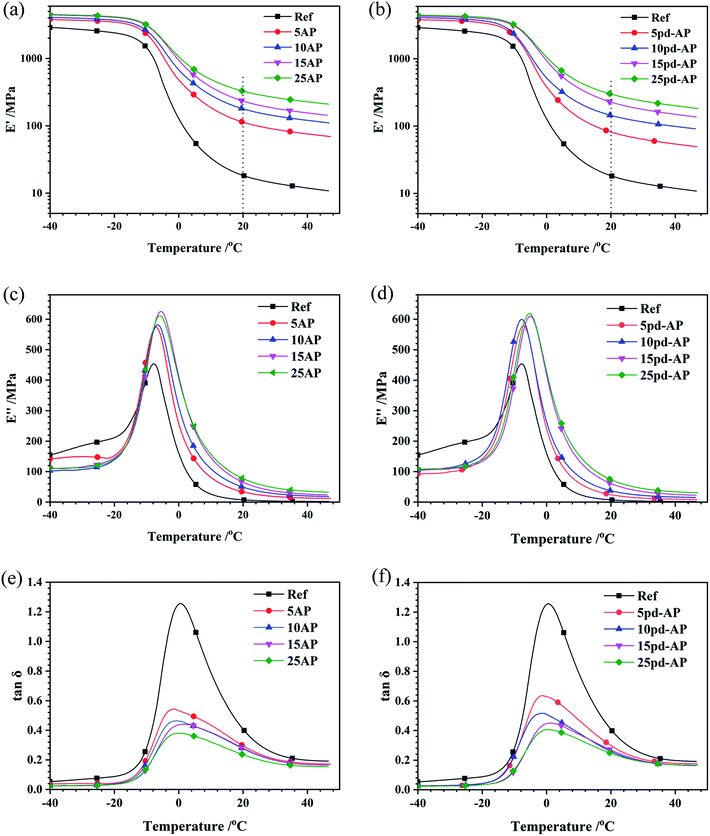 |
| | Fig. 10 Variations of (a) E′ of AP samples, (b) E′ of pd-AP samples, (c) E′′ of AP samples, (d) E′′ of pd-AP samples, (e) tan![[thin space (1/6-em)]](https://www.rsc.org/images/entities/char_2009.gif) δ of AP samples, and (f) tan δ of AP samples, and (f) tan![[thin space (1/6-em)]](https://www.rsc.org/images/entities/char_2009.gif) δ of pd-AP samples as a function of temperature for the AP/NBR composites. δ of pd-AP samples as a function of temperature for the AP/NBR composites. | |
Table 7 Viscoelastic parameters from the DMA analysis
| |
E′ at 20 °C/MPa |
Tg/°C |
tan![[thin space (1/6-em)]](https://www.rsc.org/images/entities/char_2009.gif) δmax δmax |
| Ref |
18.3 |
1 |
1.26 |
| 5AP |
113.0 |
−1 |
0.54 |
| 10AP |
179.0 |
−1 |
0.46 |
| 15AP |
233.6 |
2 |
0.44 |
| 25AP |
327.8 |
0 |
0.38 |
| 5pd-AP |
81.6 |
−1 |
0.64 |
| 10pd-AP |
144.1 |
−1 |
0.52 |
| 15pd-AP |
227.6 |
1 |
0.45 |
| 25pd-AP |
298.5 |
1 |
0.41 |
3.6. Wear resistance
The wear rate of the fiber/rubber composites is determined by the characteristics of the composites (such as hardness, tear strength, and interaction between the fiber and the matrix) and the friction condition (such as the characteristics of the counterpart surface, load, sliding speed and duration). The effects of the AP content and introduction method on the wear resistance are listed in Table 8. The addition of AP obviously improved the wear resistance, and with increasing AP content, the specific wear rate (Ws) significantly decreased. As discussed in the previous sections, the addition of AP increased the hardness and the tear strength of the NBR composites, which favored the wear resistance. In our previous study,41 the coated resorcinol-formaldehyde-latex (RFL) layer connected the aramid fiber and the NBR matrix by chemical bonding and decreased the fiber pull out from the matrix during sliding. In this study, the fiber/matrix connection improvement was achieved by the physical method, that is, increasing the contact area via fibrillation of the fiber. However, as shown in Fig. 11, no fiber, including the main fiber and the microfiber, remained on the worn surfaces, indicating that the physical connection was unable to resist the pull-out force under dynamic friction conditions. The debris of the pulled-out fiber and CB led to abrasive wear and cracks on the worn surface (Fig. 11(b) and (d)).
Table 8 Wear resistance of the NBR composites
| |
Vs/mm3 |
Ws/(10−7 mm3 N−1 mm−1) |
| Ref |
64.4 ± 0.90 |
3.9 ± 0.05 |
| 2.5AP |
61.1 ± 1.70 |
3.7 ± 0.10 |
| 5AP |
48.9 ± 2.22 |
2.9 ± 0.13 |
| 7.5AP |
37.7 ± 1.58 |
2.3 ± 0.09 |
| 10AP |
30.1 ± 5.45 |
1.8 ± 0.33 |
| 15AP |
25.6 ± 1.16 |
1.5 ± 0.07 |
| 25AP |
10.3 ± 0.89 |
0.6 ± 0.05 |
| 2.5pd-AP |
56.2 ± 4.16 |
3.4 ± 0.25 |
| 5pd-AP |
54.7 ± 0.65 |
3.3 ± 0.04 |
| 7.5pd-AP |
46.2 ± 7.47 |
2.8 ± 0.45 |
| 10pd-AP |
31.7 ± 1.81 |
1.9 ± 0.11 |
| 15pd-AP |
25.5 ± 0.27 |
1.5 ± 0.02 |
| 25pd-AP |
14.7 ± 0.22 |
0.9 ± 0.01 |
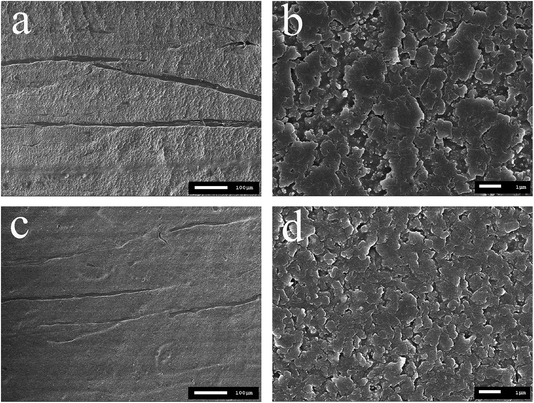 |
| | Fig. 11 SEM micrographs of the worn surfaces of the rubber blocks: (a) 15AP (150×); (b) 15AP (10![[thin space (1/6-em)]](https://www.rsc.org/images/entities/char_2009.gif) 000×); (c) 15pd-AP (150×); (d) 15pd-AP (10 000×); (c) 15pd-AP (150×); (d) 15pd-AP (10![[thin space (1/6-em)]](https://www.rsc.org/images/entities/char_2009.gif) 000×). 000×). | |
As shown in Fig. 11(c) and (d), the predispersion of AP improved the uniformity of the worn surface of the composites and mitigated cracks, which indicated that the friction stability was improved. However, the dispersion improvement did not show any advantage in further decreasing the Ws (Table 8). The slight decrease in the tear strength caused by the predispersion process should be the reason for this phenomenon.
4. Conclusions
In this investigation, AP/NBR composites were separately prepared via the opening-mixing and predispersion methods, and the influences of the AP content and the introduction method on the characteristics and properties of NBR-based composites were studied. The results showed that t90 was mainly affected by the AP introduction method since heat generation during the mixing could lead to precuring of the S-containing compounds. However, the torque was affected by both the AP content and the introduction method. The predispersion method could help to maintain t90 in the samples without AP and increase the torque of AP/NBR compounds with a high AP content. For the vulcanizates, with increasing AP content, the swelling ratio decreased; the hardness and tear strength were significantly improved, but the elongation at break was sharply reduced; the tensile strength decreased and then increased when the AP content was above 7.5 phr. The good AP dispersion promoted the modulus increase at the early stretching stage and the tensile strength of the composites with high AP content due to the fiber network improvement. Furthermore, the introduction of AP obviously decreased the Ws of the NBR-based composites, and the worn surface of pd-AP samples showed better uniformity. However, the predispersion process did not further lower the Ws of the composites. The slight decrease in the composite tear strength should be the main reason for this phenomenon.
Conflicts of interest
There are no conflict to declare.
Acknowledgements
This study was financially supported by the National Natural Science Foundation of China (grant number 51603110) and National College Students' Innovative Entrepreneurial Training Plan Program of China (grant number S202010426035).
References
- K. Singha, Int. J. Mater. Eng., 2012, 2, 10 CrossRef.
- H. Li, Y. Xu, T. Zhang, K. Niu, Y. Wang, Y. Zhao and B. Zhang, Polym. Test., 2020, 81, 106209 CrossRef CAS.
- P. B. McDaniel, S. Sockalingam, J. M. Deitzel, J. W. Gillespie Jr, M. Keefe, T. A. Bogetti, D. T. Casem and T. Weerasooriya, Composites, Part A, 2017, 94, 133 CrossRef CAS.
- A. Huang, X. Peng and L. S. Turng, Polymer, 2018, 134, 263 CrossRef CAS.
- X. Wang, J. Hu and Y. Liang, Eur. J. Chem., 2012, 9, 1581 CAS.
- M. Zhang, R. Huang, Z. Lu, B. Yang and T. Li, Adv. Mater. Res, 2011, 236–238, 1453 CAS.
- J. Bai, H. Wang, Y. Wang and J. Hu, Text. Res. J., 2018, 88, 1559 CrossRef CAS.
- L. Liu and G. Li, Adv. Mater. Res, 2012, 482–484, 1894 CAS.
- S. Zhang, L. Jiang, M. Zhang and Y. Wu, Nord. Pulp Pap. Res. J., 2010, 25, 488 Search PubMed.
- Y. Dai, C. Meng, Z. Cheng, L. Luo and X. Liu, Composites, Part A, 2019, 119, 217 CrossRef CAS.
- J. Luo, M. Zhang, B. Yang, G. Liu and S. Song, Appl. Nanosci., 2019, 9, 631 CrossRef CAS.
- P. Davies, A. R. Bunsell and E. Chailleux, J. Mater. Sci., 2010, 45, 6395 CrossRef CAS.
- M. Shimizu, C. Ikeda and M. Matsuo, Macromolecules, 1996, 29, 6724 CrossRef CAS.
- S. G. Sathi, J. Jeon, H. H. Kim and C. Nah, Plast., Rubber Compos., 2019, 48, 115 CrossRef.
- S. G. Sathi, H. Kim, Y. Seong, G. Kang and C. Nah, Polym. Compos., 2019, 40, 2993 CrossRef.
- H. Ding, H. Kong, H. Sun, Q. Xu, J. Zeng and M. Yu, Polym. Compos., 2020, 41, 1683 CrossRef CAS.
- H. Kong, H. Ding, M. Yu, X. Ding and M. Qiao, Polym. Compos., 2019, 40, E476 CrossRef CAS.
- Z. Li, L. Gong, C. Li, Y. Pan, Y. Huang and X. Cheng, J. Non-Cryst. Solids, 2016, 454, 1 CrossRef CAS.
- Z. Lu, L. Si, W. Dang and Y. Zhao, Composites, Part A, 2018, 115, 321 CrossRef CAS.
- B. Yang, Z. Lu, M. Zhang, Y. Liu and G. Liu, J. Appl. Polym. Sci., 2016, 133, 43209 Search PubMed.
- K. Xu, Y. Ou, Y. Li, L. Su, M. Lin, Y. Li, J. Cui and D. Liu, Mater. Design, 2020, 187, 108404 CrossRef CAS.
- D. Zhang, CN102604571A, 2012.
- V. D. da Silva, Í. R. de Barros, D. K. S. da Conceição, K. N. de Almeida, H. S. Schrekker, S. C. Amico and M. M. Jacobi, J. Appl. Polym. Sci., 2019, 137, 48702 CrossRef.
- M. Natali, M. Rallini, J. Kenny and L. Torre, Polym. Degrad. Stab., 2016, 130, 47 CrossRef CAS.
- A. F. Ahmed and S. V. Hoa, J. Compos. Mater., 2012, 46, 1549 CrossRef.
- J. H. Oh, J. H. Bae, J. H. Kim, C. S. Lee and J. M. Lee, Polym. Test., 2019, 80, 106093 CrossRef CAS.
- F. Cheng, Y. Hu, B. Yuan, X. Hu and Z. Huang, Composites, Part B, 2020, 188, 107897 CrossRef CAS.
- N. Park, J. Seo, K. Kim, J. Sim, Y. Kang, M. Han and W. Kim, Compos. Interfaces, 2016, 23, 781 CrossRef CAS.
- V. D. da Silva, M. M. Jacobi, H. S. Schrekker and S. C. Amico, Polym. Bull., 2019, 76, 3451 CrossRef.
- W. Lertwassana, T. Parnklang, P. Mora, C. Jubsilp and S. Rimdusit, Composites, Part B, 2019, 177, 107280 CrossRef CAS.
- C. F. Tang and Y. Lu, J. Reinf. Plast. Compos., 2004, 23, 51 CrossRef CAS.
- N. Aranganathan, V. Mahale and J. Bijwe, Wear, 2016, 354–355, 69 CrossRef CAS.
- J. Bijwe, Polym. Compos., 1997, 18, 378 CrossRef CAS.
- H. Kong, J. Chai, H. Ding and M. Yu, Composites Communications, 2020, 18, 1 CrossRef.
- Y. Ma, J. Pang, C. Zhu and X. Shi, Polym. Mater. Sci. Eng., 2017, 33, 29 CAS.
- M. Nillawong, P. Sae-oui, K. Suchiva and C. Sirisinha, Rubber Chem. Technol., 2016, 89, 640 CrossRef CAS.
- A. Frances and W. Del, US pat., 4514541, 1985.
- L. Zhang, W. Wu, M. Tian, L. Liu and J. Cao, CN1896369A, 2007.
- X. Hu, H. Zhao, T. Li, X. He, X. Wang, C. Pellerin and R. Zhang, Plast., Rubber Compos., 2020, 49, 141 CrossRef CAS.
- C. D. M. Dominic, R. Joseph, P. M. S. Begum, A. Raghunandanan, N. T. Vackkachan, D. Padmanabhan and K. Formela, Carbohydr. Polym., 2020, 245, 116505 CrossRef.
- Z. Li, Y. Li, S. Wan, J. Cheng, L. Li and C. Yue, Polym. Compos., 2020, 41, 2713 CrossRef CAS.
- Z. Li, Y. Li, J. Cheng, X. Lu and Y. Yang, Iran. Polym. J., 2020, 29, 361 CrossRef CAS.
- B. Yuan, M. Chen, Y. Liu, S. Zhao and H. Jiang, J. Reinf. Plast. Compos., 2017, 36, 137 CrossRef CAS.
- X. Li, J. Liu, J. Zhou, W. Shi, W. Zuo and J. Li, China Synth. Rubber Ind., 2016, 39, 308 CAS.
- X. Liu, C. Zhou, L. Zhao, F. Yang, J. Zhang and Z. Liu, Special Purpose Rubber Products, 2013, 34, 30 Search PubMed.
- L. Li, Z. Lin, X. He and F. Wang, Hi-Tech Fiber Appl., 2016, 41, 48 Search PubMed.
- C. Teng, T. Wang, M. Qin, H. Kong, J. Zhang and M. Yu, Polym. Compos. DOI:10.1002/pc.25735.
- Z. Li, Y. Li, Y. Xiao, Y. Yang and L. Li, RSC Adv., 2019, 9, 34744 RSC.
|
| This journal is © The Royal Society of Chemistry 2020 |
Click here to see how this site uses Cookies. View our privacy policy here.  Open Access Article
 *,
Sheng Wan,
Xinna Yuan and
Yuping Wang
![[thin space (1/6-em)]](https://www.rsc.org/images/entities/char_2009.gif) :
:![[thin space (1/6-em)]](https://www.rsc.org/images/entities/char_2009.gif) 80 (mass ratio) on an open two-roll mill (BL-6175-AL, Dongguan Baolon, China, initial temperature: 40 °C, roll speed: 20 rpm), and a predispersed AP/NBR blend was obtained (Fig. 1(b)). Then, the composites were prepared using the following steps. The predispersed AP/NBR blends, NBR, ZnO, SA, TMQ, CB and DOP were first mixed in an internal mixer (XSM-500, Shanghai Kechuang, China) for 8 min (initial temperature: 90 °C, rotor speed: 35 rpm). Then, the blend was further mixed on a two-roll mill, and CBS and S were added in sequence. After being fully mixed, the rubber compounds were obtained.
80 (mass ratio) on an open two-roll mill (BL-6175-AL, Dongguan Baolon, China, initial temperature: 40 °C, roll speed: 20 rpm), and a predispersed AP/NBR blend was obtained (Fig. 1(b)). Then, the composites were prepared using the following steps. The predispersed AP/NBR blends, NBR, ZnO, SA, TMQ, CB and DOP were first mixed in an internal mixer (XSM-500, Shanghai Kechuang, China) for 8 min (initial temperature: 90 °C, rotor speed: 35 rpm). Then, the blend was further mixed on a two-roll mill, and CBS and S were added in sequence. After being fully mixed, the rubber compounds were obtained.


![[thin space (1/6-em)]](https://www.rsc.org/images/entities/char_2009.gif) :
:![[thin space (1/6-em)]](https://www.rsc.org/images/entities/char_2009.gif) 80, and the blends were prepared in pieces with 1 mm thickness (Fig. 1(b)) before further mixing with the rest of the rubber and other ingredients. Influences of the AP content and its introduction method on the vulcanizing properties of the NBR-based compounds are shown in Table 2. AP did not participate in the vulcanization of NBR; however, t90 was determined by the AP introduction process. When AP was predispersed in NBR, it did not considerably affect t90, which obviously decreased when the AP/NBR composites were prepared via an open-mixing method. This result occurred because of the impact of heat generation during AP/NBR mixing, which should not be ignored. For the composites prepared via the predispersion method, heat generation mainly occurred in the predispersion and internal mixing processes. For example, Table 3 lists different discharging temperatures in the internal mixing process, showing an obvious temperature increase for the pd-AP samples compared with the AP samples. However, for the composites prepared via the open-mixing method, mixing of the stiff pulp and NBR was finished on an open mill, and slight crosslinking between the rubber molecular chains occurred due to heat generation since S was already added to the compounds in this step. This crosslinking led to a decrease in the measured t90, which was basically decreased with increasing AP content. However, for the pd-samples, heat generation during open mixing was much lower because the AP and rubber were fully mixed before this step, and the measured t90 of the composites was independent of the AP content. Furthermore, the cure rate index (CRI) of the AP samples increased with the AP content in general, whereas the CRI of the pd-AP samples was not much affected.
80, and the blends were prepared in pieces with 1 mm thickness (Fig. 1(b)) before further mixing with the rest of the rubber and other ingredients. Influences of the AP content and its introduction method on the vulcanizing properties of the NBR-based compounds are shown in Table 2. AP did not participate in the vulcanization of NBR; however, t90 was determined by the AP introduction process. When AP was predispersed in NBR, it did not considerably affect t90, which obviously decreased when the AP/NBR composites were prepared via an open-mixing method. This result occurred because of the impact of heat generation during AP/NBR mixing, which should not be ignored. For the composites prepared via the predispersion method, heat generation mainly occurred in the predispersion and internal mixing processes. For example, Table 3 lists different discharging temperatures in the internal mixing process, showing an obvious temperature increase for the pd-AP samples compared with the AP samples. However, for the composites prepared via the open-mixing method, mixing of the stiff pulp and NBR was finished on an open mill, and slight crosslinking between the rubber molecular chains occurred due to heat generation since S was already added to the compounds in this step. This crosslinking led to a decrease in the measured t90, which was basically decreased with increasing AP content. However, for the pd-samples, heat generation during open mixing was much lower because the AP and rubber were fully mixed before this step, and the measured t90 of the composites was independent of the AP content. Furthermore, the cure rate index (CRI) of the AP samples increased with the AP content in general, whereas the CRI of the pd-AP samples was not much affected.


![[thin space (1/6-em)]](https://www.rsc.org/images/entities/char_2009.gif) δ) curves of the NBR-based composites prepared via the open-mixing method and the predispersion method, respectively, and the main parameters are listed in Table 7. With increasing AP content, E′ at 20 °C increased, whereas tan
δ) curves of the NBR-based composites prepared via the open-mixing method and the predispersion method, respectively, and the main parameters are listed in Table 7. With increasing AP content, E′ at 20 °C increased, whereas tan![[thin space (1/6-em)]](https://www.rsc.org/images/entities/char_2009.gif) δmax decreased, which was due to the high rigidity of the AP. The dispersion improvement of the AP did not further impact the dynamic mechanical properties except decreasing the E′ of the composites. This phenomenon may be attributed to the weak chemical interaction between the fiber and the NBR molecular chain. The dispersion improvement did not enhance the limitation of the molecular chain movement.
δmax decreased, which was due to the high rigidity of the AP. The dispersion improvement of the AP did not further impact the dynamic mechanical properties except decreasing the E′ of the composites. This phenomenon may be attributed to the weak chemical interaction between the fiber and the NBR molecular chain. The dispersion improvement did not enhance the limitation of the molecular chain movement.
![[thin space (1/6-em)]](https://www.rsc.org/images/entities/char_2009.gif) δmax
δmax
![[thin space (1/6-em)]](https://www.rsc.org/images/entities/char_2009.gif) 000×); (c) 15pd-AP (150×); (d) 15pd-AP (10
000×); (c) 15pd-AP (150×); (d) 15pd-AP (10![[thin space (1/6-em)]](https://www.rsc.org/images/entities/char_2009.gif) 000×).
000×).


