
 Open Access Article
 This Open Access Article is licensed under a
 Creative Commons Attribution 3.0 Unported Licence
Analysis of Xinjiang asphaltenes using high precision spectroscopy
Xiong Qiyonga,
Kiyingi Wyclif *b,
Pan Jingjuna,
Ruiying Xiongb,
Weibing Denga,
Shiling Zhangb,
Jixiang Guo*b and
Yuqi Yangc
*b,
Pan Jingjuna,
Ruiying Xiongb,
Weibing Denga,
Shiling Zhangb,
Jixiang Guo*b and
Yuqi Yangc
aPetroChina Karamay Petrochemical Co., Karamay, Xinjiang 834000, China
bUnconventional Petroleum Research Institute, China University of Petroleum, Beijing 102249, China. E-mail: guojx003@163.com
cState Key Laboratory of Heavy Oil Processing at Karamay, China University of Petroleum-Beijing at Karamay, Karamay 834000, China
First published on 27th October 2020
Abstract
Asphaltenes are known for causing flow assurance problems in numerous oil fields. In this study we present a comparative spectroscopic analysis of Xinjiang heavy oil asphaltenes as part of ongoing research for an environmentally friendly and cheap chemical inhibitor. The goal is to predict the internal morphology of these asphaltenes through comparative analysis using high precision spectroscopy. Fourier transform infrared spectroscopy (FTIR), proton-nuclear magnetic resonance (H-NMR) and electrospray ionization Fourier transform ion cyclotron resonance combined with mass spectroscopy were used in this analysis. Several studies have demonstrated the enormous potential of these techniques to characterize hydrocarbons. Here we comparatively apply these techniques to characterize Xinjiang asphaltenes with reference to earlier imaging studies with atomic force and scanning tunneling microscopy to assign a structure to these asphaltenes. Results revealed the nature of the asphaltenes to be polycyclic, aromatic with both heteroatomic and metallic content. Thirteen basic and eleven non-basic/acidic nitrogen compounds fused within the aromatic network were identified. The mass distribution is in the range between 100–800 Da. H-NMR revealed various structural parameters (aromaticity and degree of unsaturation) and together with FTIR various functional groups were identified that include: ethers, sulphides, amides and sulfoxides. The predicted structures are consistent with the “island” and “aryl linked core” models.
Introduction
Among the problems during the production of heavy oil in Eastern China is the precipitation of asphaltenes. Therefore, their mitigation and control is of vital importance. Among the most used mitigation measures is the use of chemical inhibitors or dispersants to alleviate asphaltene related problems. During formulation of remediation chemicals; it is imperative to know the structural chemistry of asphaltenes, yet their complexity makes this challenging.1 The asphaltenes used in this research were extracted from Xinjiang crude oil. The oil field is a carbonate reservoir located in the northwest of china and is characterized by shallow burial and low temperatures. The oil is categorized as heavy due to low H/C ratio and high viscosity.2 For analysis purposes the oil can be separated into four fractions: saturates, aromatics, resins and asphaltenes. Separation/extraction of these components simplifies oil characterization as each fraction can be independently analysed.3,4 Saturates are aliphatic, non-polar, branched or linear including cycloalkanes. Aromatics have one or more benzene rings. On the other hand, resins and asphaltenes both have high molecular weights and contain heteroatoms. The difference lies in their solubility in non-polar solvents. Whereas resins are soluble in pentane and in higher alkane solvents, asphaltenes are insoluble in the later but soluble in benzene and toluene.3–6Quantitative analysis for SARA fractions shown in Table 1 substantiates the asphaltene problem in this crude oil. According to oil stability models, this disproportionality between asphaltenes and resins risks the stability of the oil that consequently results into aggregation and deposition of asphaltene blockages causing flow assurance problems, increased work overs and pipe replacements.7,8
| Oil | Saturates% | Aromatics% | Resins% | Asphaltenes% |
|---|---|---|---|---|
| XJ-1 | 11.70 | 41.86 | 18.16 | 28.28 |
| XJ-2 | 17.69 | 27.92 | 10.45 | 43.94 |
| XJ-3 | 13.13 | 28.12 | 8.93 | 49.82 |
Indeed, over the past two decades a number of spectroscopic and microscopic studies have been used to deduce the structural morphology of asphaltenes.9–11 The most prominent breakthrough was in 2015 when a team at IBM Zurich were able to provide for the first-time microscopic images for 100 asphaltenes from both coal and crude oil revealing the molecular structures of asphaltenes.12 This was achieved through use of a custom made experimental setup that combined scanning tunnelling (STM) and atomic force (AFM) microscopy. These breakthroughs have to a great extent provided answers as well as providing evidence to earlier debates on molecular weight and structural models of asphaltenes.13–16 It's now generally accepted that “island” or “aryl linked core” models are more representative of asphaltenes whereas the archipelago model has been either redefined or has been neglected entirely.13 With this new information coming to light; in this paper we combine this microscopy information with results obtained using renown spectroscopic methods to characterize and assign chemical structures to these asphaltenes. Various studies in the past have shown that these methods can be used to effectively characterize asphaltenes although did not answer the questions on the type of model.13,14
ESI FT ICR MS mass spectrometry
This is an ionization technique that involves electrospray ionization coupled with Fourier transform-ion cyclotron mass spectroscopy (ESI FT-ICR MS).17–22 Xinjiang oil contains considerable amounts of heteroatoms,2 thus their analysis is warranted. The ESI FT-ICR MS mass spectra provide ultra-high resolution and quality accuracy, enabling the precise determination of mass distributions of heteroatoms for both basic and non-basic nitrogen compounds (BNC and NBC) in the asphaltenes as well as approximate asphaltene molecular weight. This is because these compounds respectively can be ionized in both the positive and negative. Electrospray ionization modes.20 Moreover, the carbon number and degree of unsaturation can as well be deduced.23 The degree of unsaturation/condensation is represented by the double bond equivalent index (DBE), eqn (1).9,24
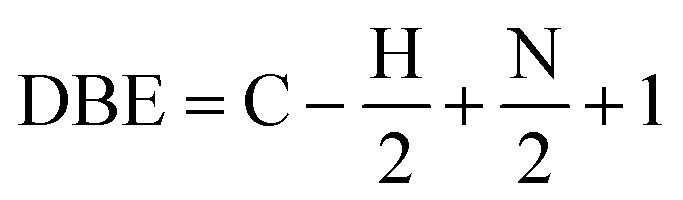 | (1) |
The lower the DBE, the more aliphatic the molecule and degree of saturation. Whereas the higher the DBE, the high the degree of aromaticity and unsaturation/condensation.
Nuclear magnetic resonance (1H-NMR)
This method is key in identifying chemical environments through analysis of the chemical shifts in the spectrum that are vital in determination of asphaltenes' structural parameters like aromaticity, degree of branching, aromaticity and naphthenic ring numbers among others.25Aromaticity, fA, of asphaltenes can be determined using the modified Brown and Lander method that utilizes the intensities of the resonated aromatic (HA) and alkyl hydrogen atoms (Hα, Hβ, Hγ) using eqn (2).26,27
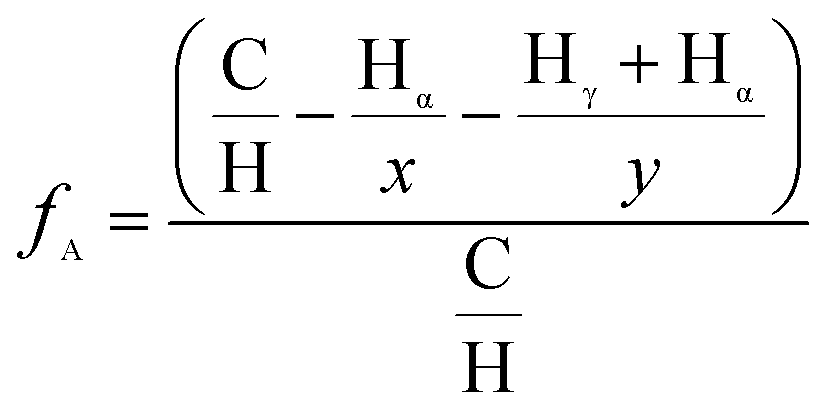 | (2) |
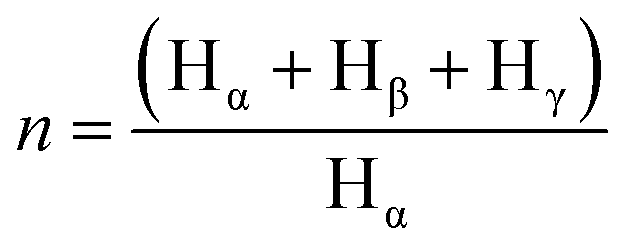
Apart from, aromaticity, the average carbon number per alkyl substituent, n, is obtained from the hydrogen spectrum and calculated as per eqn (3).
 | (3) |
Various methods for calculations are used to determine the parameters and reference is given to the works by D. R. Clutter and his team.28
Fourier transform infrared spectroscopy
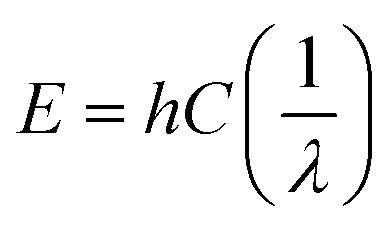
This spectroscopy is based on the principle that bonds between molecules act just like springs, thus they can absorb energy and undergo vibration or stretching. The energy, E, absorbed is directly proportional to the wave number, ν, of vibration (eqn (4)) and it is inversely proportional to the wavelength, λ, (Beer's law).29,30
 | (4) |
And from Hooke's law, wavenumber can be calculated as;
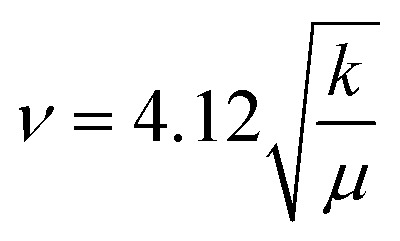 | (5) |
As a result, this technique can determine the functional groups in the asphaltenes that together with the NMR spectroscopy can give a detailed insight into the asphaltenes molecular structure and assembly units.31,32
This study focuses on the use these techniques in unison to provide a more detailed comparative understanding of the internal structure of the asphaltenes to form logical conclusions.
Results and discussion
Elemental analysis
Non-metallic and metallic elemental composition in the asphaltenes is presented in Table 2. This experimental data is key in determining structural properties of the asphaltenes especially the hydrogen and carbon quantities.| Non-metals | Metals | ||||||||
|---|---|---|---|---|---|---|---|---|---|
| Asphaltene | C% | H% | S% | N% | O% | (NSO) % | H/C | V (μg g−1) | Ni (μg g−1) |
| XJ-1 | 74.29 | 6.00 | 3.15 | 1.08 | 3.27 | 7.50 | 0.9692 | 618 | 92 |
| XJ-2 | 77.67 | 6.72 | 3.38 | 1.17 | 2.75 | 7.31 | 1.0382 | 795 | 106 |
| XJ-3 | 74.87 | 6.34 | 3.38 | 1.26 | 3.13 | 7.77 | 1.0162 | 852 | 109 |
| Mean | 75.61 | 6.35 | 3.30 | 1.17 | 3.05 | 7.53 | 1.0078 | 755 | 307 |
It can be seen that the asphaltenes are characterized by a lower nitrogen content as compared to oxygen and sulphur heteroatoms, Table 2. It was also observed that the variations in non-metallic elements of the three samples is significantly small.
The low nickel to vanadium ratio is indicative of the origin of the crude oil from which the asphaltenes were extracted (carbonate reservoir). They make up the smallest portion of the asphaltenes and for this reason we considered their contribution to structural assignments to be inconsequential.
ESI FT-ICR MS analysis of XJ-1 asphaltenes
Fig. 1 shows ESI FT ICR mass spectra analysis for asphaltene sample XJ-1. In the positive mode Fig. 1(a and b) where basic nitrogen compounds where selectively ionized, the mass distribution range (m/z) was between 100–800 Da. A mono-modal mass distribution was observed to be mainly concentrated in the range 220–780 Da. | ||
| Fig. 1 Positive ion ESI FT-ICR mass spectra and at nominal mass, (a); basic nitrogen species and DBE in positive mode (b); negative-ion ESI FT ICR mass spectra and at nominal mass, (c); non-basic/acidic species and their DBE (d). | ||
In the anion mode, Fig. 1(c and d), majority of the hetero atoms were oxygen-containing species. The mass distribution range was mainly between 170 and 780 Da, and peak intensities were highest between 230 and 420 Da. Considering the mass distribution in both broadband, the average mass of these asphaltene molecules is ∼400 Da. This determination is consistent with what has been reported in earlier studies for asphaltenes molecular weights.33,34 Thus an implication that the Xinjiang asphaltenes as well have got low molecular weights.
In both modes the spectra were zoomed to nominal mass to provide a detailed analysis for the spectra. In the positive mode, the spectrum was focused to nominal mass m/z = 404 whereby the baseline resolution exhibited 10 peaks whereas in negative mode Fig. 1(c) at nominal mass m/z = 405, the baseline resolution was 12 peaks. These are homologous series that are grouped according to their carbon number, degree of unsaturation (DBE) and heteroatom species (NnOoSs), Fig. 1(b and d). Positive ESI sensed thirteen nitrogen species with DBEs' ranging between 0–22, Fig. 1(b).
The abundance of the species was in the order: N1S1 > N2S1 > N1S2 > N1O1S1 ≈ N1O2S2 > N1O1S2 > N2O1S1 > N2S2 > N1O2S1 ≈ O1S1 > O2S2 and majority of the species were in the nitrogen–sulphur classes (N1S1, N2S1 and N1S2). The abundance of N2O2S1 and N2O2S2 was minuscule albeit detectable.
Negative ESI FT ICR MS detected nine (9) non-basic nitrogen compounds and two (2) acidic species in the asphaltenes Fig. 1(d).
The abundance was in the order N2O3 > N1O1 > N2O1 > N2 > O3S1 > N2O3S1 > N1O1S1 > N2S1 > N1O2 > O2 > N1O1S2 and their DBE were between 0 and 25, majority being nitrogen–oxygen containing species (N2O3, N1O1 and N2O1).
This high concentration of oxygen species is consistent we the elemental analysis and may be an indicator of some form of biodegradation due to shallowness of the reservoir and somewhat low temperature. The most abundant class had DBEs ranging from 8–14 indicating a high degree of condensation and aromaticity. Compounds with carbon numbers 22–24 and double bond equivalent of 14 were the most abundant class, Fig. 2.
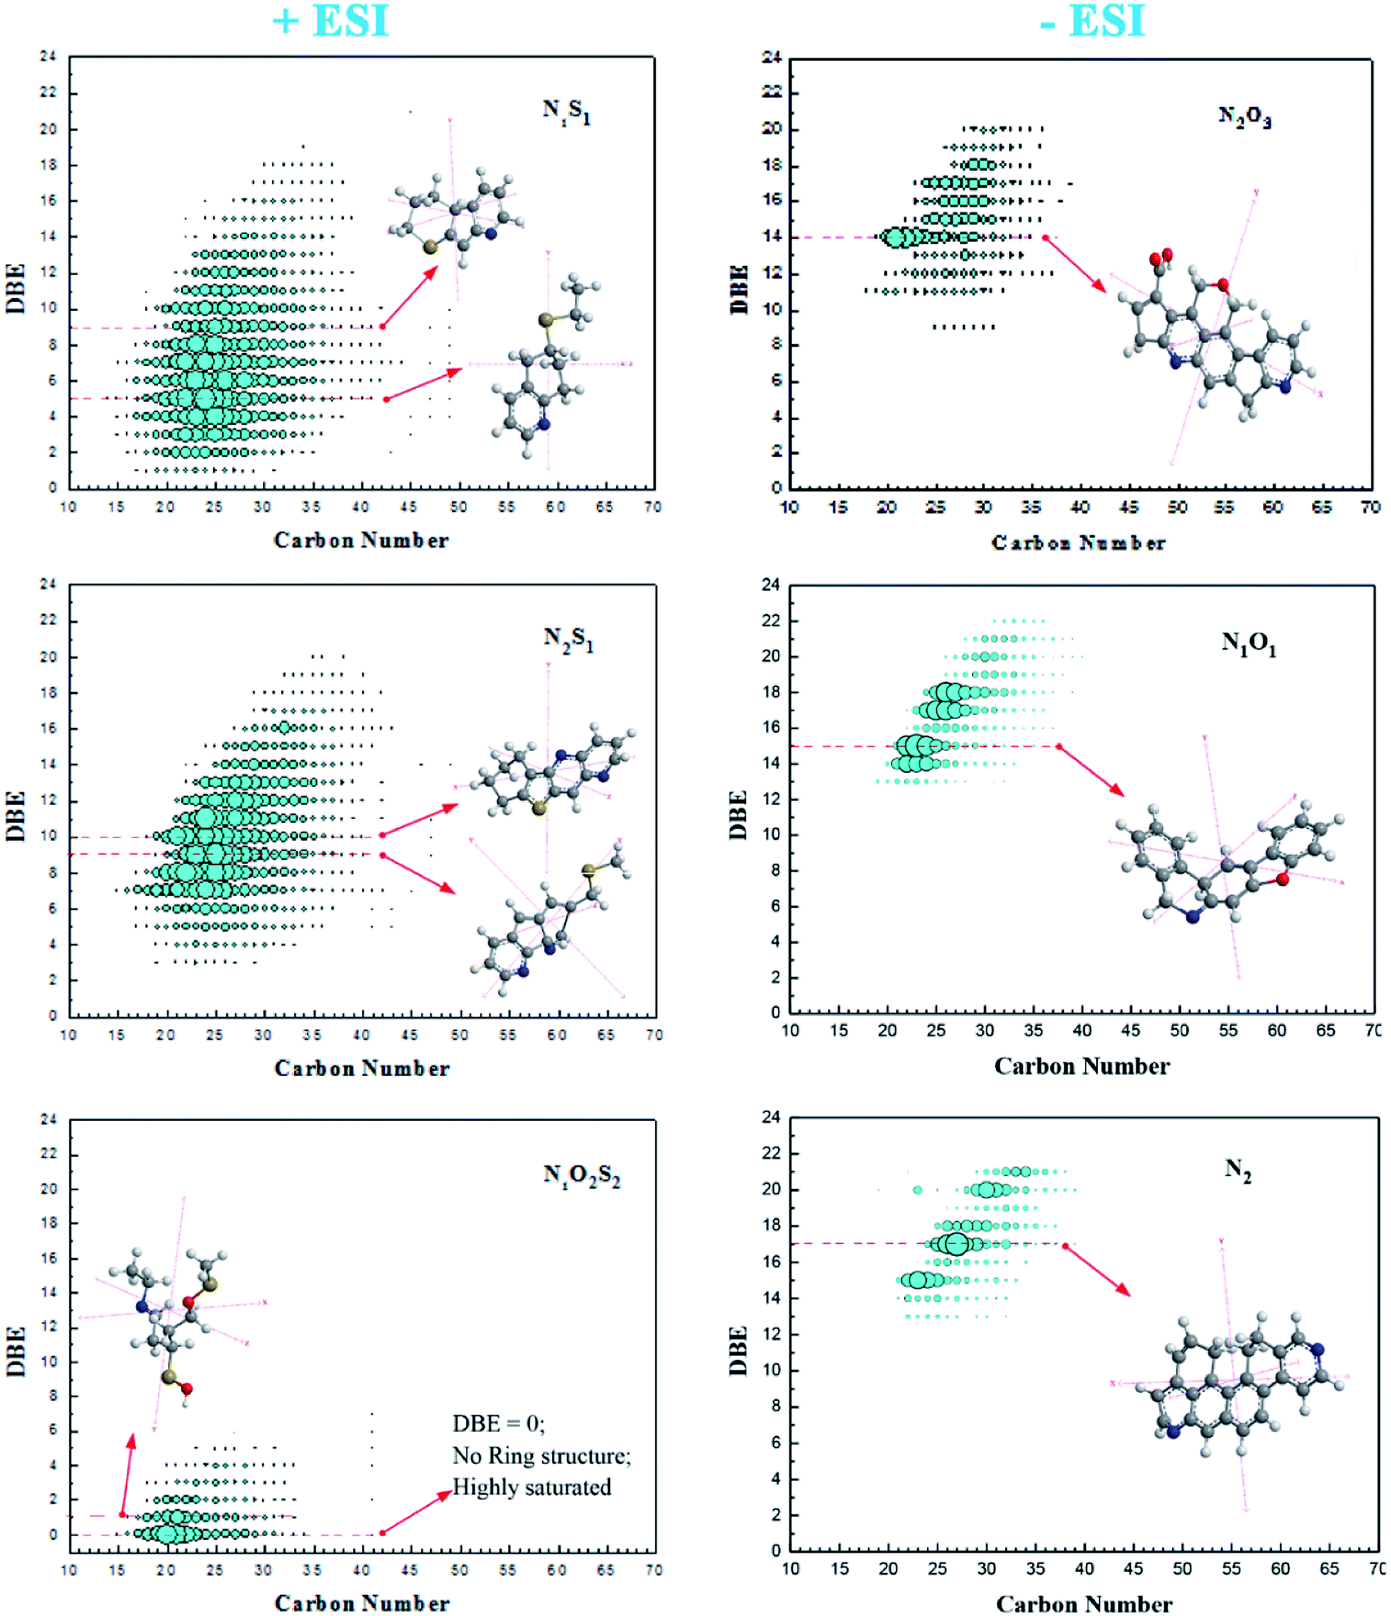 | ||
| Fig. 2 DBE distribution and carbon number for the heteroatom classes detected in positive (right) and negative (left) ESI FT ICR MS. | ||
The degree of unsaturation is obvious in Fig. 2 but noticeable observation is the group of compounds with zero DBE that justify existence of typical aliphatic compounds. In this case, its suffice to say, that the basic compounds in the N1O2S2 class identified in positive mode are mostly unsaturated and aliphatic compounds that may be attached to ring systems as branches. Bruno Schuler and his team using AFM measurements showed the possibility of some asphaltene structures being aliphatic in crude oil though with high uncertainty.9
The asphaltenes contain heteroatoms that are majorly unsaturated. This signifies presence of various polycyclic aromatic hydrocarbons (PAHs).
FTIR-analysis of XJ-1 asphaltenes
The obtained FTIR spectrum of the asphaltenes is presented in the Fig. 3. It has been divided into two important regions: diagnostic (<1500 cm−1) and fingerprint (>1500 cm−1) region.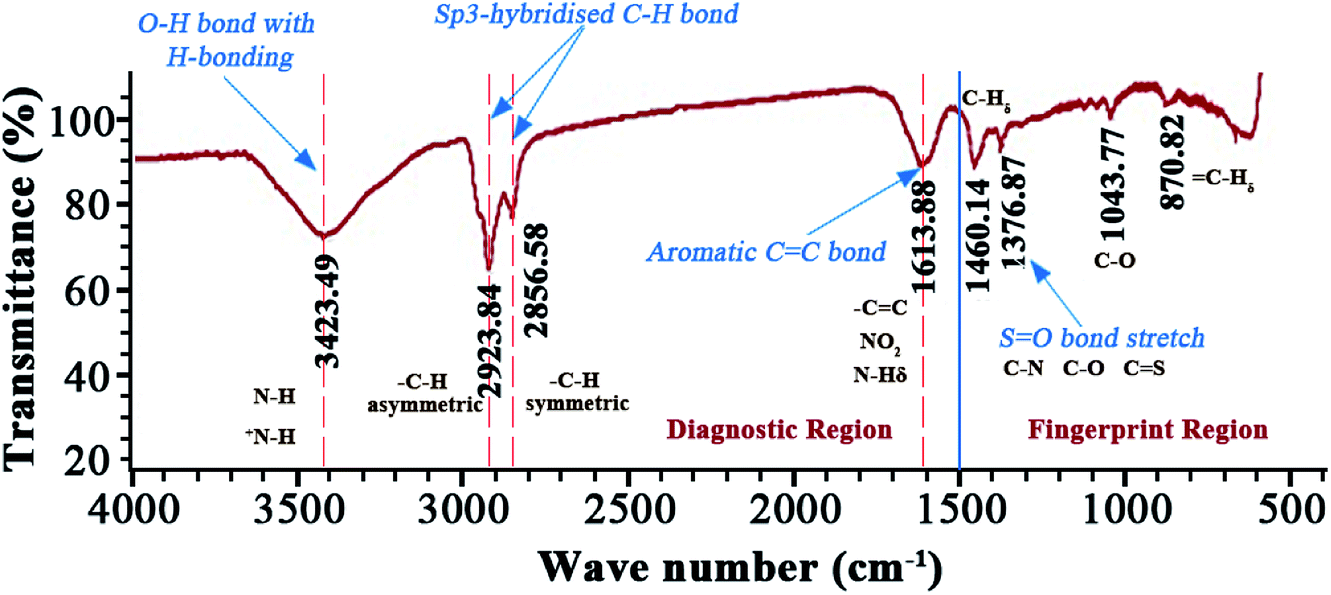 | ||
| Fig. 3 FTIR spectrum of XJ-1 asphaltenes. | ||
It is observed, in the region where wavenumber is greater than 3000 cm−1, a broad shaped, medium intensity signal at wavenumber 3423.49 cm−1 exists. Signals in this region are attributed to N–H and O–H bond stretching.31 However, in this case the broad shape is characteristic of an O–H stretching bond with some hydrogen bonding. This also justifies existence of –OH containing groups like phenols and alcohols. Between 3000 and 2800 cm−1, exists sp3-hybridized C–H stretching bond. This is an alkyl group and two signals are observed because of the differences in bond stretching. The signal at higher wavenumber (2923.84 cm−1) belongs to an asymmetrical bond stretching since it requires a significantly high amount of energy as compared to symmetrical bonds (2856.58 cm−1). Between 1700 and 1500 cm−1, exists a double bond region of a C![[double bond, length as m-dash]](https://www.rsc.org/images/entities/char_e001.gif) C stretching bond representing aromaticity in the asphaltenes and unsaturation.32 Signals from aromatic amines in this region are overlapped by the vibrations from alkyl aliphatic C–H groups. Vibrations from sulfoxide and C–O groups are noticeable in the finger print region. The C–O peak is attributed to stretching in ethers and C–O–H groups in phenols and probably alcohol groups as well.
C stretching bond representing aromaticity in the asphaltenes and unsaturation.32 Signals from aromatic amines in this region are overlapped by the vibrations from alkyl aliphatic C–H groups. Vibrations from sulfoxide and C–O groups are noticeable in the finger print region. The C–O peak is attributed to stretching in ethers and C–O–H groups in phenols and probably alcohol groups as well.
These deductions emphasize the observations of the ESI FT ICR MS. The absence of the carbonyl peak at ∼1700 cm−1 indicates that the oxygen is from alcohols and ether functional groups (–COOR or C–OH groups). It's imperative to note that sulphur is from sulphides, sulfoxides and thiophenes. Even though some of these signals are weak in the FTIR, it cannot be neglected to mention that earlier asphaltene studies35,36 with X-ray absorption near edge structure (XANES) have been efficient in identifying these groups.
1H-nuclear magnetic resonance (1H-NMR) analysis
The obtained 1H-NMR spectrum of the asphaltenes is presented in Fig. 4.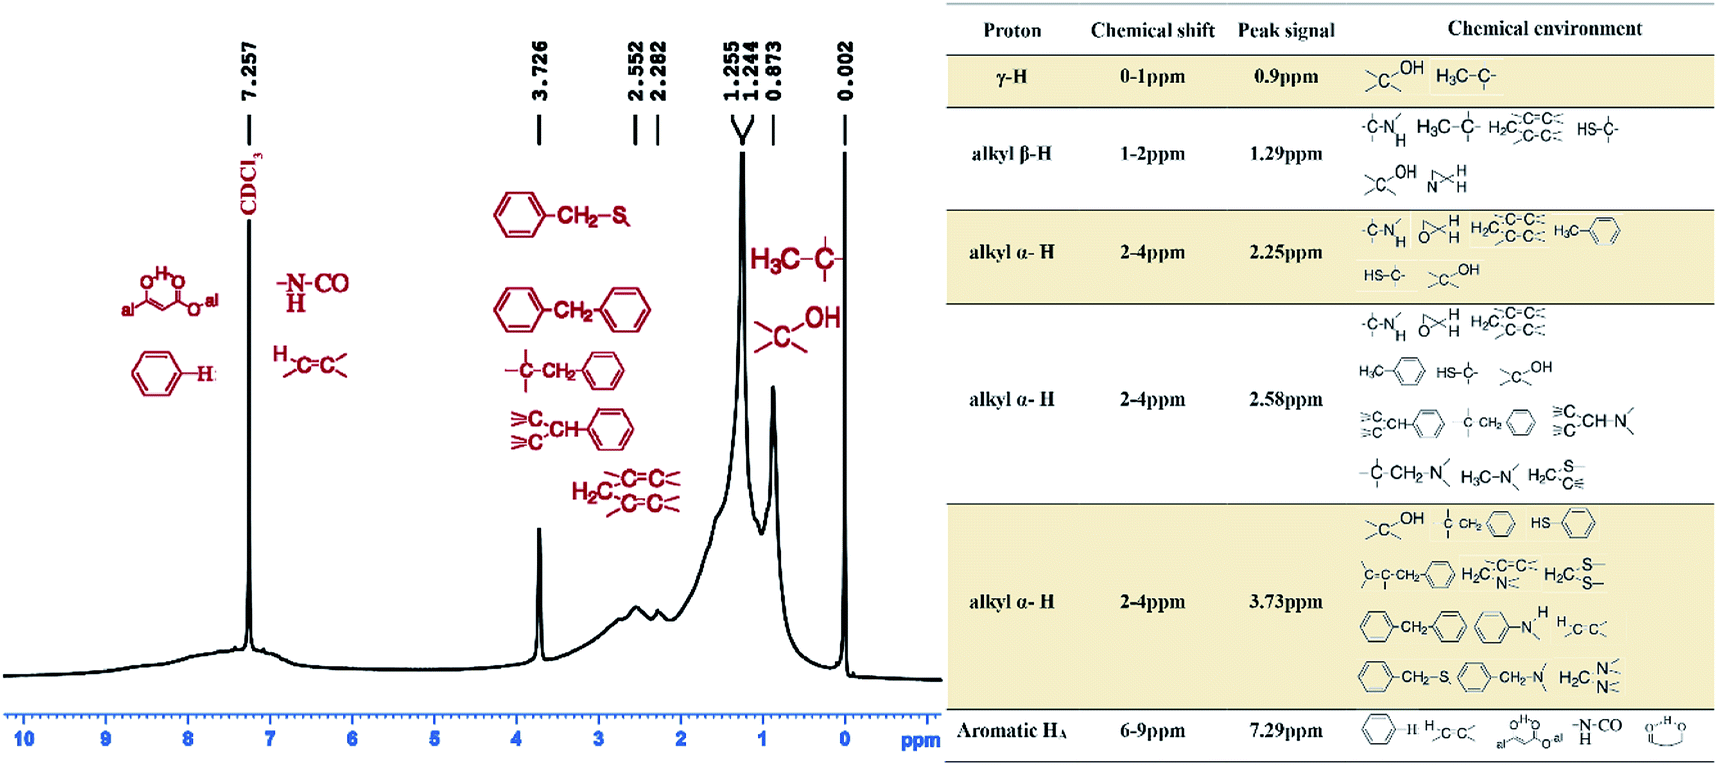 | ||
| Fig. 4 The 1H-NMR spectra of XJ-1 asphaltenes. | ||
Using hydrogen intensities obtained from the spectrum data, elemental analysis and molecular weight; average structural parameters were calculated and shown in Table 3. It is to be noted that since porphyrins have been reported as a main constituent of asphaltenes,37 their resonance occurs in the negative region of the spectrum and as such in this analysis, their existence is simply supported by the presence of Ni/V metallic elements. Chemical shifts in the regions 6–9 ppm, 2–4 ppm, 1–2 ppm and 1–0 ppm are of significant value since the aromatic, alpha, beta and gamma alkyl hydrogens respectively resonate in those regions.
| Structural parameters | |
| w (C) % | 75.61 |
| w (H) % | 6.35 |
| HAU/CA | 0.41 |
| Avg. number of aromatic ring carbon per molecule, CA | 66.20 |
| Avg. number of naphthenic ring carbon per molecule, CN | 26.00 |
| Avg. number of alkyl carbon number, CP | 35.91 |
| Avg. number of aromatic rings per molecule, RA | 22.65 |
| Avg. number of naphthenic rings per average molecule, RN | 8.11 |
| Ratio of aromatic carbon to total carbon, fa | 0.48 |
| Ratio of alky carbon attached to naphthalene rings, fp | 0.27 |
| Hydrogen–carbon ratio, H/C | 1.37 |
A chemical shift at 0.9 ppm, is from hydrogen of a –CH3 group belonging to either an iso-paraffin or normal alkyl paraffin38,39 and further away from the aromatic ring. Resonance at 1.29 ppm, is most probably from CH2- at beta position from the aromatic ring in a long alkyl aliphatic branch since resonance in this group has been reported to be 1.30 ppm which is very close to 1.29 ppm.39,40 This explains the zero DBE observed in ESI FT ICR mass spectra. However, because we are dealing with a complex molecule, it is safe to deduce that the proton may as well be from a β-positioned = CH- in an alkyl branch.40 Resonance signals at 2.25 ppm and 2.58 ppm are most probably from a –CH3 (methyl group) with the carbon atom at α-position in respect to the aromatic carbon to which it is attached.
Literature sources report signals from this methyl group at 2.30 ppm and 2.60 ppm.39,41 It is also to be noted that α-protons in aromatic rings on CH- and CH2- groups as well resonate between 2.4–3.5 ppm.39–41 The proton shifts at 3.72 ppm is attributed to the bonding –CH2- group in the diphenyl chemical environment, Fig. 4.
The signal at 7.29 ppm is normally attributed to the deuterated chloroform but it should be noted that due some overlapping issues, some chemical shifts that exist in this range may exist. Among them that have been documented in earlier studies include the di-, tri- and tetra-aromatic ring groups.38,40,42 The proton in these groups resonates at concentrations between 7.2–8.3 ppm.
On average more γ hydrogens were protonated implying a vast network of alkyl branches longer than ethyl groups attached to the ring network. This is also evinced in the average chain length, n, of 4.37.
As per the calculated structural parameters, Table 3, the asphaltenes, contain as up to 66.20 aromatic ring carbons and an aromaticity of about 48% that results into formation of a conjugated π bond system. Besides, a low HAU/CA ratio was observed that represents high tendency of aromatization, condensation of the rings thus easier formation of conjugated π bond system. However, it should be noted that when the degree of alkylation increases, the spatial steric hindrance between asphaltene molecules also increases, hindering association between molecules hence reducing the number of structural units and consequently the low molecular weights observed in ESI FT ICR spectra.
It is also plausible to deduce that the conjugated π bond system causes polarizability in the molecules which creates a series of both deficient and electron rich molecules that counters the hydrogen bonding in the asphaltenes as seen in solubility studies for asphaltenes.43–45 Based on these deductions the asphaltenes may take on the structures as observed in Fig. 5(a and b).
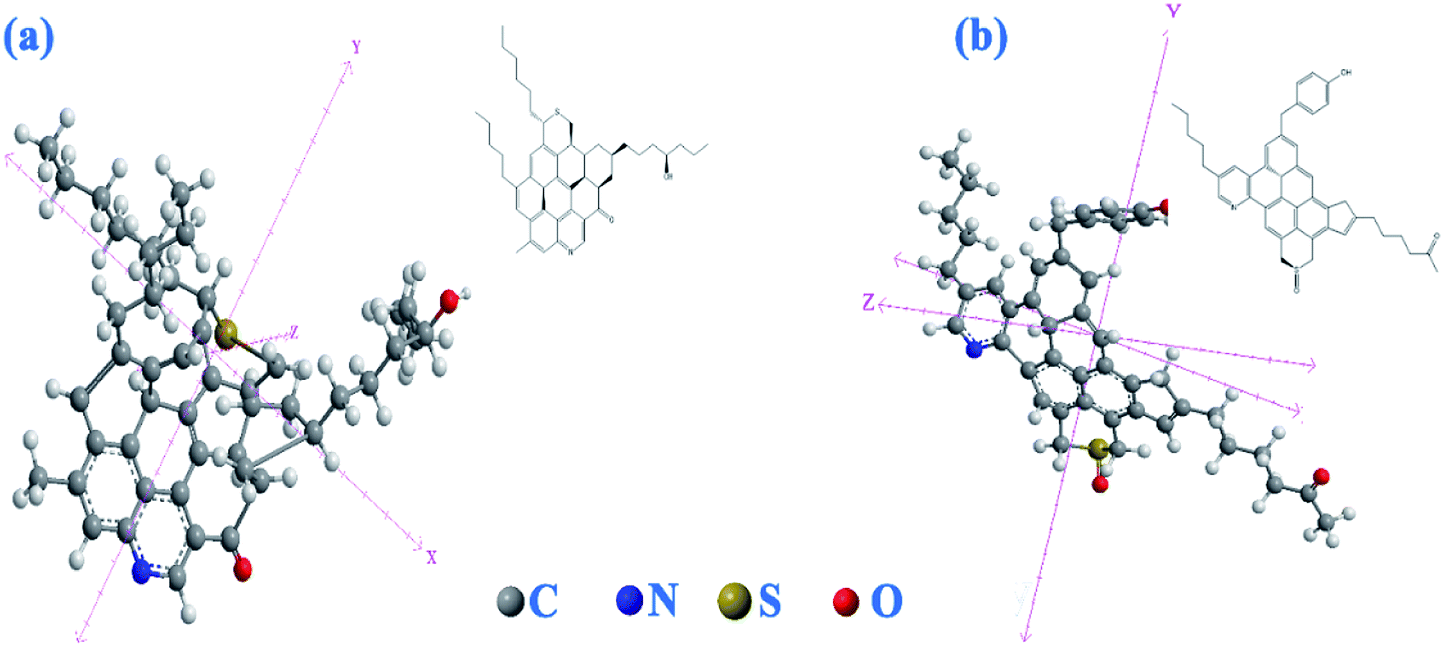 | ||
| Fig. 5 Assigned structure for the Xinjiang asphaltenes, (a) island like model, (b) aryl linked like structure. | ||
The predicated structures are similar to those reported for crude oil asphaltenes using STM/AFM results9 and considering the observed polycyclic aromatic system with side branches, Fig. 5(b), this structural assignment is consistent with the aryl linked core model Fig. 5(b) due to the probable diphenyl group in the NMR spectrum albeit the island model is still plausible Fig. 5(a).
Conclusions
In this study, with hindsight we have been able to analyse Xinjiang asphaltenes using NMR, ESI FT ICR MS, and FTIR to characterize their internal makeup.We conclude that generally, they have low metallic content, a modest molecular weight, high degree of unsaturation and contain homologous series with long alkyl branches. The functional groups of the homologous series are alcohols, ethers, sulphides, amides and sulfoxides.
The inferences are based entirely on spectroscopy information’ but the asphaltene molecules are more complex and also contain Ni/V metallic constituents. While we couldn't successfully ascertain the real structure of the asphaltenes due lack of STM/AFM measurements we were able to develop a modest thought of their internal likeness based on scientific information collected from high resolution spectroscopy. The structural assignments for these asphaltenes are consistent with the “island” and “aryl-linked core” models.
In our next phase, we will focus on these findings to develop an environmentally friendly inhibitor that remedies the underlying problems posed by asphaltenes during oil production.
Experiment and methods
Asphaltene extraction
Using the Polar separation method, the main components/fractions (saturates, aromatics, resins, asphaltenes) in the heavy oil were separated. The separation was in accordance with the ASTM-2007-03 standard test procedure.5Fourier transform-infrared spectroscopy (FT-IR)
Conducted at room temperature; the MAGNA-IR 560 ESP spectrometer with a scan range between 4000–400 cm−1 was used to analyse the asphaltene sample at resolution of 0.35 cm−1. The spectrometer has a 30![[thin space (1/6-em)]](https://www.rsc.org/images/entities/char_2009.gif) 000:1 signal to noise ratio. The data was processed and output using the OMNIC software.
000:1 signal to noise ratio. The data was processed and output using the OMNIC software.
NMR spectroscopy analysis
The experiment was performed at 24.5 °C using deuterated chloroform (chloroform-d) as the solvent and tetramethylsilane (TMS) as the internal calibration standard.The Avance-600 MHz nuclear magnetic resonance spectrometer was used in this investigation.25,46
ESI FT-ICR MS analysis
The asphaltenes' solution was prepared in reference to Klein's experiment47 and then infused into Bruker Apex-Ultra FT-ICR MS fitted with a 9.4-Tesla super-conducting magnet and an ESI source using an Apollo electrospray at a rate of 180 μL h−1. The ESI was operated both in positive/negative modes under voltages −4/3.5 kV emitter voltage, −4.5/4 kV capillary front and −320/−320 V capillary end voltage. Detailed experimental procedure and data processing is reported elsewhere in earlier academic advances.21,47–49Metallic and non-metallic analysis
Metallic elements were determined using the PerkinElmer Optima 3000 emission spectrometer that can measure wavelengths between 167–782 nm for over 5000 emissions. The liquid sample was rapidly atomized using an argon plasma at 7000 °C and electrons excited for detection and analysis using WinLab32 software. The non-metallic elements were analysed using the Vario EL Elementar equipment. It was conducted in accordance to the Petrochemical industry standard GB/T 19143-2003.Conflicts of interest
There are no conflicts to declare.Acknowledgements
The authors would like to thank the National Natural Science Foundation of China (No. 51674274) for financially supporting this research.References
- O. C. Mullins, The Asphaltenes, Annu. Rev. Anal. Chem., 2011, 4, 393–418 CrossRef CAS.
- C. Zou, Heavy Oil and Bitumen, in Unconventional Petroleum Geology, Elsevier, 2013, pp. 307–335 Search PubMed.
- C. Chen, J. Guo, N. An, Y. Pan, Y. Li and Q. Jiang, Study of Asphaltene Dispersion and Removal for High-Asphaltene Oil Wells, Pet. Sci., 2012, 9, 551–557 CrossRef CAS.
- J. G. Speight, The Chemistry and Technology of Petroleum, CRC Press, 2014 Search PubMed.
- ASTM D2007, A Standard Test Method for Characteristic Groups in Rubber Extender and Processing Oils and Other Petroleum-Derived Oils by the Clay-Gel Absorption Chromatographic Method, Annual Book of Standards, 2012 Search PubMed.
- W. Loh, R. S. Mohamed and R. G. dos Santos, Crude Oil Asphaltenes: Colloidal Aspects, in Encyclopedia of Surface and Colloid Science, CRC Press, 2015, pp. 1546–1562 Search PubMed.
- S. Ashoori, M. Sharifi, M. Masoumi and M. M. Salehi, The Relationship Between SARA Fractions and Crude Oil Stability, Egypt. J. Pet., 2017, 26, 209–213 CrossRef.
- R. Guzmán, J. Ancheyta, F. Trejo and S. Rodríguez, Methods for Determining Asphaltene Stability in Crude Oils, Fuel, 2017, 188, 530–543 CrossRef.
- B. Schuler, S. Fatayer, G. Meyer, E. Rogel, M. Moir, Y. Zhang, M. R. Harper, A. E. Pomerantz, K. D. Bake and M. Witt, Heavy Oil Based Mixtures of Different Origins and Treatments Studied by Atomic Force Microscopy, Energy Fuels, 2017, 31, 6856–6861 CrossRef CAS.
- L. Gross, F. Mohn, N. Moll, B. Schuler, A. Criado, E. Guitian, D. Pena, A. Gourdon and G. Meyer, Bond-Order Discrimination by Atomic Force Microscopy, Science, 2012, 337, 1326–1329 CrossRef CAS.
- G. Zajac, N. Sethi and J. Joseph, Molecular Imaging of Petroleum Asphaltenes by Scanning-Tunneling-Microscopy-Verification of Structure from C-13 and Proton Nuclear-Magnetic-Resonance Data, Scanning Microsc., 1994, 8, 463–470 CAS.
- B. Schuler, G. Meyer, D. Pena, O. C. Mullins and L. Gross, Unraveling the Molecular Structures of Asphaltenes by Atomic Force Microscopy, J. Am. Chem. Soc., 2015, 137, 9870–9876 CrossRef CAS.
- B. Schuler, Y. Zhang, F. Liu, A. E. Pomerantz, A. B. Andrews, L. Gross, V. Pauchard, S. Banerjee and O. C. Mullins, Overview of Asphaltene Nanostructures and Thermodynamic Applications, Energy Fuels, 2020 DOI:10.1021/acs.energyfuels.0c00874.
- O. C. Mullins, B. Martínez-Haya and A. G. Marshall, Contrasting Perspective on Asphaltene Molecular Weight. This Comment vs. the Overview of A. A. Herod, K. D. Bartle, and R. Kandiyoti, Energy Fuels, 2008, 22, 1765–1773 CrossRef CAS.
- H. Sabbah, A. L. Morrow, A. E. Pomerantz and R. N. Zare, Evidence for Island Structures as the Dominant Architecture of Asphaltenes, Energy Fuels, 2011, 25, 1597–1604 CrossRef CAS.
- H. Groenzin and O. C. Mullins, Molecular Size and Structure of Asphaltenes from Various Sources, Energy Fuels, 2000, 14, 677–684 CrossRef CAS.
- A. Gaspar, E. Zellermann, S. Lababidi, J. Reece and W. Schrader, Impact of Different Ionization Methods on the Molecular Assignments of Asphaltenes by FT-ICR Mass Spectrometry, Anal. Chem., 2012, 84, 5257–5267 CrossRef CAS.
- G. C. Klein, A. Angström, R. P. Rodgers and A. G. Marshall, Use of Saturates/Aromatics/Resins/Asphaltenes (SARA) Fractionation to Determine Matrix Effects in Crude Oil Analysis by Electrospray Ionization Fourier Transform Ion Cyclotron Resonance Mass Spectrometry, Energy Fuels, 2006, 20, 668–672 CrossRef CAS.
- T. M. Pereira, G. Vanini, E. C. Oliveira, F. M. Cardoso, F. P. Fleming, A. C. Neto, V. Lacerda Jr, E. V. Castro, B. G. Vaz and W. Romão, An Evaluation of the Aromaticity of Asphaltenes Using Atmospheric Pressure Photoionization Fourier Transform Ion Cyclotron Resonance Mass Spectrometry–APPI (±) FT-ICR Ms, Fuel, 2014, 118, 348–357 CrossRef CAS.
- K. Qian, R. P. Rodgers, C. L. Hendrickson, M. R. Emmett and A. G. Marshall, Reading Chemical Fine Print: Resolution and Identification of 3000 Nitrogen-Containing Aromatic Compounds from a Single Electrospray Ionization Fourier Transform Ion Cyclotron Resonance Mass Spectrum of Heavy Petroleum Crude Oil, Energy Fuels, 2001, 15, 492–498 CrossRef CAS.
- Q. Shi, C. Xu, S. Zhao, K. H. Chung, Y. Zhang and W. Gao, Characterization of Basic Nitrogen Species in Coker Gas Oils by Positive-Ion Electrospray Ionization Fourier Transform Ion Cyclotron Resonance Mass Spectrometry, Energy Fuels, 2010, 24, 563–569 CrossRef CAS.
- X. Zhu, Q. Shi, Y. Zhang, N. Pan, C. Xu, K. H. Chung and S. Zhao, Characterization of Nitrogen Compounds in Coker Heavy Gas Oil and Its Subfractions by Liquid Chromatographic Separation Followed by Fourier Transform Ion Cyclotron Resonance Mass Spectrometry, Energy Fuels, 2011, 25, 281–287 CrossRef CAS.
- C. Xiaobo, L. Yibin, W. Jin, S. Honghong, Y. Chaohe and L. Chunyi, Characterization of Nitrogen Compounds in Coker Gas Oil by Electrospray Ionization Fourier Transform Ion Cyclotron Resonance Mass Spectrometry and Fourier Transform Infrared Spectroscopy, Appl. Petrochem. Res., 2014, 4, 417–422 CrossRef.
- P. Vollhardt and N. Schore, Organic Chemistry: Structure and Function, WH Freeman and Company, 2018 Search PubMed.
- A. B. Andrews, J. C. Edwards, A. E. Pomerantz, O. C. Mullins, D. Nordlund and K. Norinaga, Comparison of Coal-Derived and Petroleum Asphaltenes by13C Nuclear Magnetic Resonance, DEPT, and XRS, Energy Fuels, 2011, 25, 3068–3076 CrossRef CAS.
- J. Brown and W. Ladner, A Study of the Hydrogen Distribution in Coal-Like Materials by High-Resolution Nuclear Magnetic Resonance Spectroscopy. 2. A Comparison with Infra-Red Measurement and the Conversion to Carbon Structure, Fuel, 1960, 39, 87–96 CAS.
- Y. Sun, C. Yang, H. Zhao, H. Shan and B. Shen, Influence of Asphaltene on the Residue Hydrotreating Reaction, Energy Fuels, 2010, 24, 5008–5011 CrossRef CAS.
- D. Clutter, L. Petrakis, R. Stenger and R. Jensen, Nuclear Magnetic Resonance Spectrometry of Petroleum Fractions. Carbon-13 and Proton Nuclear Magnetic Resonance Characterizations in Terms of Average Molecule Parameters, Anal. Chem., 1972, 44, 1395–1405 CrossRef CAS.
- W. Kemp, Organic Spectroscopy, Macmillan International Higher Education, 2017 Search PubMed.
- J. Mohan, Organic Spectroscopy: Principles and Applications, Alpha Science Int'l Ltd., 2004 Search PubMed.
- M. Asemani and A. R. Rabbani, Detailed FTIR spectroscopy characterization of crude oil extracted asphaltenes: curve resolve of overlapping bands, J. Pet. Sci. Eng., 2020, 185, 106618 CrossRef CAS.
- J. Ancheyta, F. Trejo and M. S. Rana, Asphaltenes: Chemical Transformation During Hydroprocessing of Heavy Oils, CRC Press, 2010 Search PubMed.
- R. P. Rodgers and A. G. Marshall, Petroleomics: Advanced Characterization of Petroleum-Derived Materials by Fourier Transform Ion Cyclotron Resonance Mass Spectrometry (FT-ICR MS), in Asphaltenes, Heavy Oils, and Petroleomics, Springer, 2007, pp. 63–93 Search PubMed.
- Asphaltenes, Heavy Oils, and Petroleomics, ed. O. C. Mullins, E. Y. Sheu, A. Hammami and A. G. Marshall, Springer, New York, 2007 Search PubMed.
- A. Sharma, H. Groenzin, A. Tomita and O. C. Mullins, Probing Order in Asphaltenes and Aromatic Ring Systems by HRTEM, Energy Fuels, 2002, 16, 490–496 CrossRef CAS.
- A. E. Pomerantz, D. J. Seifert, K. D. Bake, P. R. Craddock, O. C. Mullins, B. G. Kodalen, S. Mitra-Kirtley and T. B. Bolin, Sulfur Chemistry of Asphaltenes from a Highly Compositionally Graded Oil Column, Energy Fuels, 2013, 27, 4604–4608 CrossRef CAS.
- L. Artok, Y. Su, Y. Hirose, M. Hosokawa, S. Murata and M. Nomura, Structure and Reactivity of Petroleum-Derived Asphaltene, Energy Fuels, 1999, 13, 287–296 CrossRef CAS.
- R. Dutta Majumdar, M. Gerken, R. Mikula and P. Hazendonk, Validation of the Yen–Mullins Model of Athabasca Oil-Sands Asphaltenes using Solution-State 1H NMR Relaxation and 2D HSQC Spectroscopy, Energy Fuels, 2013, 27, 6528–6537 CrossRef CAS.
- I. Rakhmatullin, S. Efimov, B. Y. Margulis and V. Klochkov, Qualitative and Quantitative Analysis of Oil Samples Extracted from Some Bashkortostan and Tatarstan Oilfields Based on NMR Spectroscopy Data, J. Pet. Sci. Eng., 2017, 156, 12–18 CrossRef CAS.
- J. Parlov Vuković, P. Novak, J. Plavec, M. Friedrich, L. Marinić Pajc and T. Hrenar, NMR and Chemometric Characterization of Vacuum Residues and Vacuum Gas Oils from Crude Oils of Different Origin, Croat. Chem. Acta, 2015, 88, 89–95 CrossRef.
- S. L. Silva, A. M. Silva, J. C. Ribeiro, F. G. Martins, F. A. Da Silva and C. M. Silva, Chromatographic and Spectroscopic Analysis of Heavy Crude Oil Mixtures with Emphasis in Nuclear Magnetic Resonance Spectroscopy: A Review, Anal. Chim. Acta, 2011, 707, 18–37 CrossRef CAS.
- T. Morgan, P. Alvarez-Rodriguez, A. George, A. Herod and R. Kandiyoti, Characterization of Maya Crude Oil Maltenes and Asphaltenes in Terms of Structural Parameters Calculated from Nuclear Magnetic Resonance (NMR) Spectroscopy and Laser Desorption-Mass Spectroscopy (LD-MS), Energy Fuels, 2010, 24, 3977–3989 CrossRef CAS.
- M. Morimoto, N. Fukatsu, R. Tanaka, T. Takanohashi, H. Kumagai, T. Morita, R. R. Tykwinski, D. E. Scott, J. M. Stryker and M. R. Gray, Determination of Hansen Solubility Parameters of Asphaltene Model Compounds, Energy Fuels, 2018, 32, 11296–11303 CrossRef CAS.
- T. Sato, S. Araki, M. Morimoto, R. Tanaka and H. Yamamoto, Comparison of Hansen Solubility Parameter of Asphaltenes Extracted from Bitumen Produced in Different Geographical Regions, Energy Fuels, 2014, 28, 891–897 CrossRef CAS.
- F. Mutelet, G. Ekulu, R. Solimando and M. Rogalski, Solubility Parameters of Crude Oils and Asphaltenes, Energy Fuels, 2004, 18, 667–673 CrossRef CAS.
- J. M. Sheremata, M. R. Gray, H. D. Dettman and W. C. McCaffrey, Quantitative Molecular Representation and Sequential Optimization of Athabasca Asphaltenes, Energy Fuels, 2004, 18, 1377–1384 CrossRef CAS.
- G. C. Klein, S. Kim, R. P. Rodgers, A. G. Marshall and A. Yen, Mass Spectral Analysis of Asphaltenes. II. Detailed Compositional Comparison of Asphaltenes Deposit to Its Crude Oil Counterpart for Two Geographically Different Crude Oils by ESI FT-ICR MS, Energy Fuels, 2006, 20, 1973–1979 CrossRef CAS.
- Q. Shi, Z. Dong, Y. Zhang, S. Zhao and C. Xu, Data Processing of High-Resolution Mass Spectra for Crude Oil and Its Distillations, J. Instrum. Anal., 2008, 27, 246–248 Search PubMed.
- Q. Shi, N. Pan, H. Long, D. Cui, X. Guo, Y. Long, K. H. Chung, S. Zhao, C. Xu and C. S. Hsu, Characterization of Middle-Temperature Gasification Coal Tar. Part 3: Molecular Composition of Acidic Compounds, Energy Fuels, 2013, 27, 108–117 CrossRef CAS.
| This journal is © The Royal Society of Chemistry 2020 |