
 Open Access Article
 This Open Access Article is licensed under a Creative Commons Attribution-Non Commercial 3.0 Unported Licence
Elaboration of soft porous ultrasound insulators
Romain Poupart *a,
Thomas Lacourb,
Pablo Darnigea,
Olivier Ponceletb,
Christophe Aristéguib,
Thomas Voisinc,
Samuel Marrec,
Thomas Brunetb and
Olivier Mondain-Monval*a
*a,
Thomas Lacourb,
Pablo Darnigea,
Olivier Ponceletb,
Christophe Aristéguib,
Thomas Voisinc,
Samuel Marrec,
Thomas Brunetb and
Olivier Mondain-Monval*a
aUniv. Bordeaux, CNRS, UMR 5031, Centre de Recherche Paul Pascal, F-33600 Pessac, France. E-mail: poupart@crpp-bordeaux.cnrs.fr; mondain@crpp-bordeaux.cnrs.fr
bUniv. Bordeaux, CNRS, Bordeaux INP, Arts-et-Métiers, UMR 5295, Institut de Mécanique et d’Ingénierie, F-33405 Talence, France
cUniv. Bordeaux, CNRS, UMR 5026, Institut de Chimie de la Matière Condensée de Bordeaux, F-33600 Pessac, France
First published on 17th November 2020
Abstract
A simple and easy way is proposed for the fabrication of a highly attenuating composite material for underwater acoustics. The approach involves the introduction of porous polymer beads into a polyurethane matrix. The porous beads are prepared through an emulsion-templating approach, and two different processes are used. The first one uses microfluidics to synthesize beads of controlled diameter and porosity. The control over the bead size allows the selection of the frequency range where the material exhibits the highest acoustic attenuation. The second one uses a double emulsion approach and allows for the production of much larger quantities of beads. Both approaches yield materials exhibiting much higher acoustic absorption than the one obtained using the most commonly used micro-balloon inclusion. We present both the synthesis procedures and the structural and acoustic characterizations of the beads and the final acoustic materials.
1. Introduction
Hiding an object in water is a commonly searched application in underwater acoustics, and most often relies on the use of an absorbing coating.1 The coating must at the same time decrease the reflection coefficient while reducing its transmission properties as much as possible. The former requirement involves impedance matching between water and the material, while the latter depends on its intrinsic damping and scattering properties. Elastomers, in particular polyurethanes (PU), show ideal impedance matching with water2 and damping properties, and have been commonly used in acoustic stealth for submarines. However, to enhance the internal scattering properties of the polymer structure and, consequently, the ability of the material to dissipate the incident wave energy, different types of fillers may be dispersed in the matrix, as done in several studies with glass spheres,3,4 lead and polystyrene microbeads,1 nanographene5 or carbon nanotube6 charges and most commonly micro-balloons.7,8 This last system is particularly efficient, since, owing to the large impedance contrast between air and PU, air cavities strongly scatter the acoustic waves within the composite. However, one drawback of this latter approach is that the micro-balloons are subjected to buckling instabilities and they collapse under finite static pressure, which strongly limits their use for underwater applications.8 Moreover, due to their size (typically of the order of a few tens of micrometers), their resonance frequency, at which the material absorption is maximum, is typically located in the megahertz range, i.e. far beyond the targeted frequency domain (typically a few kilohertz to some tens of kilohertz).A way to circumvent this is to rely on the use of porous polymeric microspheres.9,10 Recently, Sun et al.11 have described an elegant way to fabricate porous polymer beads, which should be less subjected to buckling instabilities owing to their porous structure while exhibiting larger sizes, thus decreasing the resonance frequency range. In their work, the beads were made from a copolymer of vinyl acetate and triallyl isocyanurate P(VAc-co-TAIC), while a porogenic solvent was used to generate the pores. This mixture was then emulsified to give spherical shape to the beads. However, the use of a porogenic solvent is not the only way to make porous polymeric materials and the used technology does not allow for the choice of the inclusion size and polydispersity. Other approaches such as track etching,12 particle leeching13–15 or emulsion-templating16 may also be used to obtain porous materials. The latter is of crucial interest and uses an emulsion dispersed in a soft polymer to create porous beads.17 When used with a microfluidic co-flow device to generate the particles, this method allows for the production of polymer beads, exhibiting a relatively narrow size distribution and a very accurate control over their porosity and, consequently, their acoustic index.17,18 An alternative technique involving a batch emulsion technology to produce spherical beads may also be used to increase the production rate, though it generates much wider polydispersities. As we show in this paper, these two approaches were used to generate materials with high acoustic absorption. Here, we investigate the longitudinal attenuation versus frequency behaviour of composite materials including polymer beads of controlled sizes and concentration in the matrix. Doing so, we demonstrate that, for an equivalent air volume fraction in the samples, the fabricated systems exhibit a much higher acoustic attenuation than the one containing micro-balloons that we here consider as the reference system. Moreover, we investigate the influence of the bead size on the attenuation–frequency curve and show that it is possible to control the frequency domain of maximum absorption.
2. Materials and methods
We have elaborated different composites through the use of silicone-based porous inclusions into a polyurethane matrix. As a reference, we used commercially available micro-balloons as fillers inside the PU matrix. In the following section, we describe the generation of the porous PDMS inclusions as well as the fabrication of the composites.2.1. Polymer matrices and products
The continuous phase of the emulsions was always obtained by mixing an epoxy-bearing silicone oil, an alcoholic solution containing a photoinitiator (iodonium salt), a photosensitizer (thioxanthone, ITX) and a surfactant. For the microfluidic beads, the composition is as follows: 12 g of silicone oil, 0.5 g of initiator solution, 10 mg of sensitizer and 50 mg of 2-octyl-1-dodecanol, later referred to as OH-457. In contrast to the double emulsion process, the composition slightly differed: 12.4 g of epoxy-silicone oil, 86 mg of initiator solution, 10 mg of ITX, 50 mg of a branched silicone chain, and polyglyceryl-3-polydimethylsiloxyethyl dimethicone (commercial name KF-6104) as a surfactant.The polyurethane used is a bi-component commercially available polyurethane (Axson Sika). One part of a polyol solution (containing tertiary aromatic amine as a catalyst, known as Part B) was added, while two parts of an isocyanate mixture were added (known as Part A).
The components used for all the syntheses are listed as follows: the matrix used to make the polymer beads is composed of Silcolease UV Cata221 TM, which is a 20 wt% alcoholic solution of (4-(1-methylethyl)phenyl)-(4-methylphenyl)iodonium tetrakis(pentafluorophenyl)borate dissolved in propan-2-ol, and of an epoxy-bearing PDMS rubber (Silcolease UV Poly200 TM), kindly provided by Elkem Silicones. Isopropylthioxanthone (ITX, ≥99%) was supplied by Rahn. Sodium dodecyl sulfate (SDS, ≥99%), 2-octyl-1-dodecanol (OH457, 97%), and NaCl (≥99%) were purchased from Merck. KF-6104 was kindly provided by Shin-Etsu. Glycerol (molecular biology) was ordered from Fisher Scientific. UR3440 kit (isocyanate Part A and polyol Part B) from Axson Sika was used to make polyurethanes. Expancel 461 DET 40 d25 from Nouryon has been used as reference micro-balloons. Here, 18.2 MΩ deionized water was filtered through a Milli-Q Plus purification pack.
2.2. Emulsion and matrices
In order to obtain 30 vol% emulsions, 5.4 g of water phase containing 1.5 wt% NaCl was introduced into the OH-based silicone mixture, under mechanical stirring using a home-made helical device. It was kept under stirring for further 2 min after the addition. As reported, these emulsions gave water droplets ranging from 1 to 10 μm in diameter.18For the double emulsion beads, the primary emulsion was again composed of 5.4 g of salted water (1.5 wt%) and, this time, added into our KF-6104-based silicone mixture. The size distributions of emulsions were characterized by both static light scattering and optical microscopy. Static light scattering experiments were performed using a Malvern Mastersizer S apparatus with dodecane as the continuous phase. In dodecane, emulsion droplets remain fully dispersed whatever surfactant is used. For optical measurements, a drop of the emulsion was placed between two glass slides and observed using a Leica DM 2500P microscope.
As reported elsewhere in the literature,19,20 KF-6104 has been chosen here as the surfactant for the primary emulsion, as it is able to emulsify water in the PDMS-based oil phase. Fig. 1A shows the size distribution of the W/O emulsion in dodecane, with a similar average size and size distribution as the one obtained with OH-457.18 Optical microscopy (Fig. 1B) of the emulsion also demonstrates that these droplets tend to aggregate, thus not showing isolated droplets but clusters, as observed in a previous study using another surfactant (namely, lauryl PEG-8 dimethicone Silube J208-812). As shown previously,18 the obtained interconnected droplet structure can also result in interconnected porosity due to the template of the emulsion during polymerization.
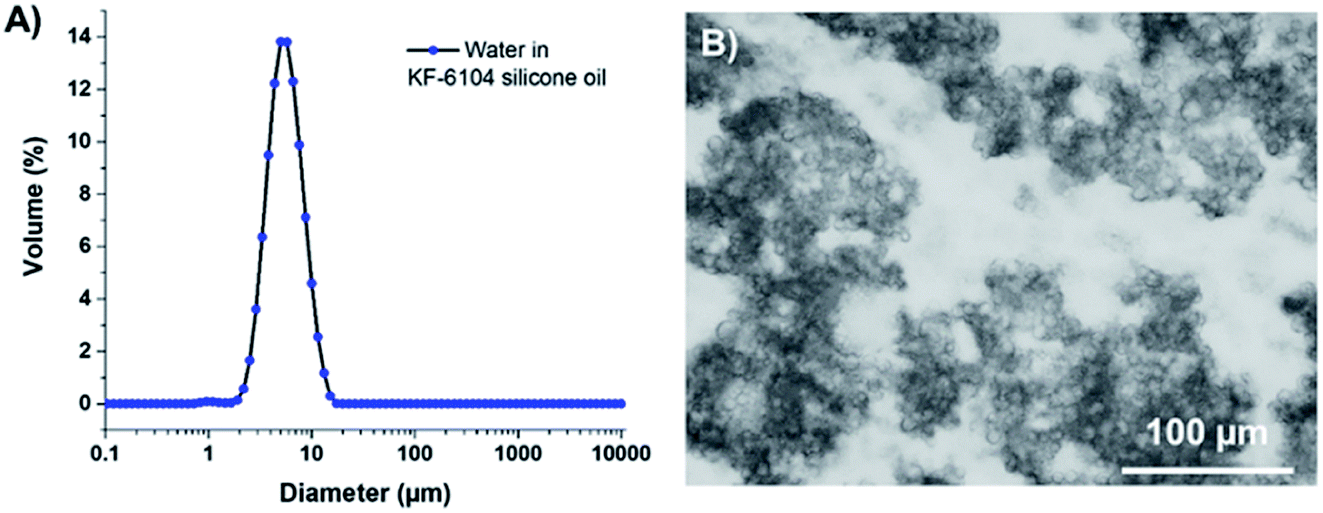 | ||
| Fig. 1 (A) Size distribution of the KF-6104-based emulsion and (B) optical microscopy picture of the same emulsion. The dark parts are aggregates of water droplets while the white part is the continuous phase of the emulsion composed of PDMS oil. | ||
The W/O emulsion being only the first step, the shaping of the bead has been performed in two ways: (i) using a microfluidic device in which the initial emulsion is injected in a glycerol solution in a co-flow geometry and (ii) introducing the initial W/O emulsion into a continuous water phase containing a surfactant under a controlled shear, thus making a double emulsion. In the first case (microfluidics), the OH-457-based emulsion has been placed into a homemade microfluidic co-flow device with a syringe pump and a pressure controller.18 A more accurate description of this co-flow device is available in ref. 18. In order to make beads of different controlled sizes, different pressures Pglycerol were applied to the external glycerol circulating around the injected emulsion in the co-flow geometry. Several values of the flow rates, Qemulsion, used for the injected emulsions have been tried. Beads with a diameter of 500 μm were obtained with Pglycerol fixed at 350 mbar and Qemulsion at 1.5 mL h−1. Beads of 300 μm of diameter and others of 200 μm can be achieved with a couple of pressure/flow rate of {1000 mbar; 1.5 mL h−1} and {1000 mbar; 1 mL h−1}, respectively. The drawback of this method is the relatively low number of object that can be made per amount of time. In fact, after around 6 hours of microfluidics, we are able to obtain 1.2 g of beads, i.e. a quantity approximately required to get a piece of final composite of typically 200 cm3.
In the double emulsion process, the second emulsion (i.e. W1/O/W2 emulsion) was prepared by adding the primary emulsion in an aqueous solution of SDS (3.6 g in 71.8 g of deionized water). The primary emulsion is loaded in a syringe and then added drop by drop to the second water phase under magnetic stirring at 1000 rpm. After emptying the syringe, the emulsion is stirred for 10 minutes still at 1000 rpm. This fast and straightforward method allows us to obtain approximately 12 g of double emulsion beads in only 10 minutes, which is about 360 times faster than microfluidics.
After making droplets (either by microfluidics or by double emulsion process), the samples were cross-linked by UV light, taking advantage of the epoxy-bearing PDMS oil used and using iodonium salt as a photoinitiator. For the microfluidic co-flow process, as the newly created droplets of emulsion inside the glycerol phase were flowing through the device, they would eventually enter a chamber containing a UV lamp (Dymax BlueWave 200) for a passing time estimated at 3 s. After polymerization, the beads were collected and thoroughly washed with ethanol prior to drying. For the double emulsion process, the as-made emulsion was polymerized under stirring (1000 rpm) for 10 minutes using the same UV lamp. Again, the beads were collected and washed with ethanol prior to any drying step.
In order to characterize the materials constituting the soft beads, we also made reference bulk samples. To do so, both inner emulsions (i.e. with OH-457 or KF-6104 as surfactant) were also polymerized in the shape of two cylinders (diameter 3.5 cm and thickness of 2 and 3 mm). After pouring the emulsions into PTFE moulds maintained between two quartz plates, they were polymerized under UV irradiation for 10 minutes for each side. Samples were washed several times with a mixture of water and ethanol, with the ethanol concentration increased until using pure ethanol, only to replace the water filling the pores with EtOH. Ethanol was used as it is fully miscible with CO2 used in the following supercritical drying process that was applied to our samples. Indeed, due to the difficulty of drying encountered with the OH-457-based emulsion,18 supercritical drying was implemented to our materials.21 The collected beads were put into a reactor dedicated to such drying. CO2 was introduced to fill the reactor until the pressure reached 110 bars. Simultaneously, the temperature inside the reactor was set to 50 °C. An automatic back pressure regulator (Jasco BP-2080), linked to the gas exit of the reactor, allowed the system to make a continuous flux for 2.5 h, thus washing the samples with supercritical CO2. After this, the reactor was allowed to reduce the pressure until reaching ambient pressure and opened to get the samples. Monolithic samples were also dried using the same process.
The dried beads (either microfluidic-based or double emulsion-based) were thoroughly characterized by microscopy. Optical microscopy (through a Nikon SMZ1270i) and SEM (Hitachi TM-1000, sampled having been metallized with a thin layer of Pt beforehand) were used to determine the size distribution of the aforementioned beads using the home-made MATLAB program to extract the size. Concerning the size distribution of the microfluidic beads, as shown in the sum up figures (Fig. 2A, C and E), Gaussian distributions are observed (Fig. 2B, D and F) with mean diameters of 192 ± 25 μm (sample MF1), 323 ± 18 μm (MF2) and 505 ± 40 μm (MF3) using the aforementioned couples of microfluidic parameters. In these figures, one can also observe that the beads bear a relatively smooth surface and a polydispersity around 10%, demonstrating the efficiency of the microfluidic process to deliver relatively monodisperse objects. For the double emulsion beads (sample DE), the size distribution follows a log-normal law and a high polydispersity is observed (Fig. 2G and H), with a mean diameter of 203 ± 110 μm. As observed in the SEM pictures (Fig. 2G), the surface obtained through the double emulsion process is rougher, with pores forming on the surface. This difference comes from the type of surfactant that was used to do the internal emulsion.
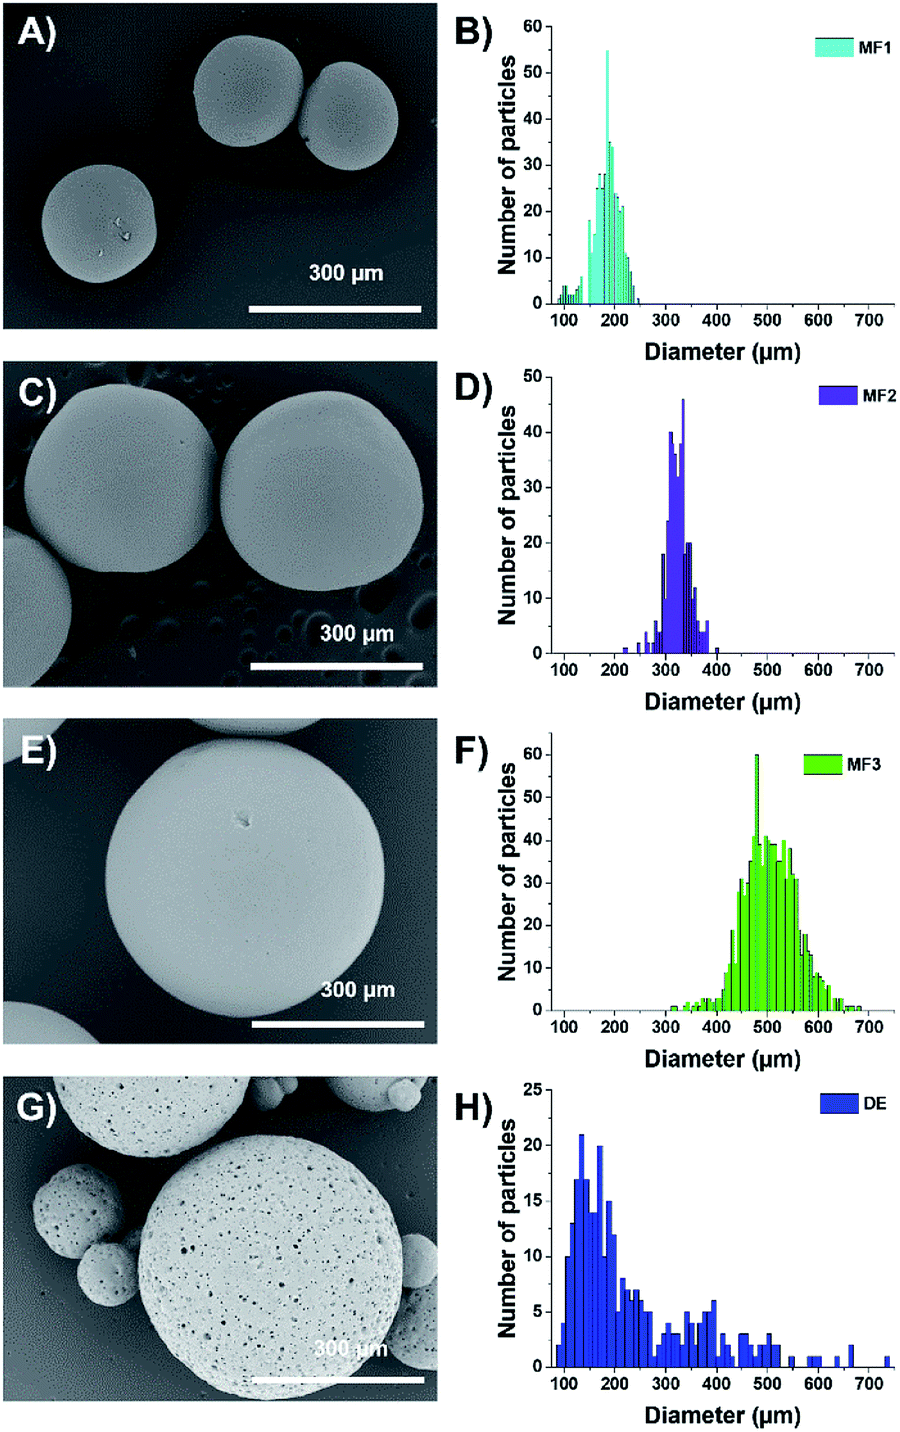 | ||
| Fig. 2 (A, C and E) SEM pictures of beads obtained by the microfluidic process with an average diameter of (A) 192 ± 25 μm (sample MF1), (C) 338 ± 32 μm (sample MF2), (E) 505 ± 40 μm (sample MF3). (B, D and F) The corresponding size histograms. (G) SEM picture of the beads obtained by the double emulsion process (sample DE) with an average diameter of 203 ± 110 μm. (H) The corresponding size histogram. | ||
For the inner structure of our materials, SEM was once again applied to cut beads. The porous silicone samples were obtained using either OH-457 or KF-6104 surfactants to stabilize the initial emulsions. Thus, as explained above, OH-457 yielded isolated independent emulsion droplets, whereas KF-6104 yielded aggregated droplets (Fig. 1B). As demonstrated in Fig. 3, the bulk materials obtained from both surfactants and their corresponding beads exhibit a close matched-up inner porosity. For the OH-based monolith (Fig. 3A and B), we observe a porous structure matching the initial emulsion as we can see spherical pores matching the initial isolated water droplets. The sizes of the pores are between 1 and 15 μm, as expected. For the KF-based monolith (Fig. 3C), pores are aggregated and slightly interconnected (with pore throats in the micrometer or less range) as we can observe chaplets of droplets in both materials (i.e. bulk monoliths 3C or beads 3D). It is noteworthy to mention that this porosity is uniformly spread in the beads up to the surface, thus explaining the rough surface observed on sample DE.
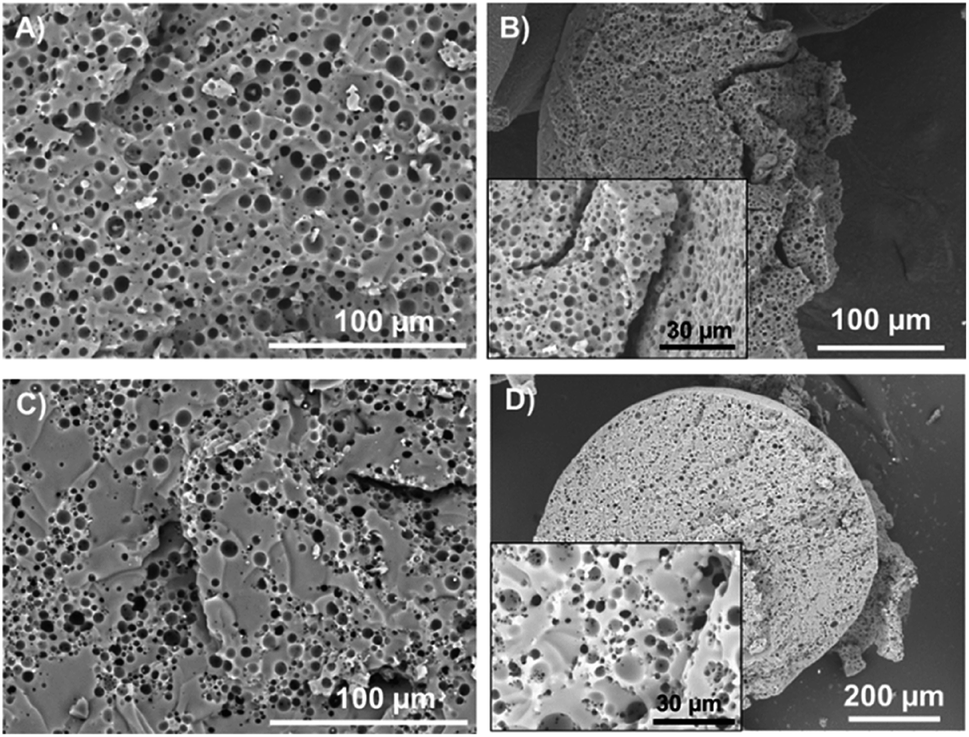 | ||
| Fig. 3 SEM pictures of (A) PDMS porous monolith arising from OH-457 surfactants and (B) the corresponding beads (MF3) obtained by the microfluidic process (inset: closeup of the pores), (C) monolith using KF-6104 as a surfactant and (D) the corresponding beads obtained by a double emulsion (sample DE) process (inset: closeup of the porosity). | ||
The bead's mass density (and consequently their porosity) was determined by a creaming speed method as described in ref. 18. As the initial density value of PDMS is 1004 kg m−3,17 the targeted 30% porosity is expected to lead to a density of around 700 kg m−3. The measured density of the DE beads was found to be around 770 ± 58 kg m−3, i.e. slightly above the expected one, while the density of MF samples was found to be equal to 669 ± 28 kg m−3, i.e. slightly below. Nevertheless, these two values are close to the targeted one.
2.3. Formulation of the composites
As the polyurethane is used for underwater-acoustics materials,11 our top choice of matrix is a commercially available bi-component PU. Reference samples, made only of pure PU, were also fabricated. For this purpose, 5 g of polyol B and 10 g of isocyanate A were individually degassed under vacuum for 30 minutes. Both parts were then mixed together under gentle stirring before being poured into two different cylindrical PTFE moulds (3.5 cm diameter, and 4 and 7 mm thickness, respectively). These samples were then kept in an oven at 80 °C for 2 h. The samples were then removed from the moulds and put back into the oven, still at 80 °C, for further 24 h.Three types of composites were fabricated. First, a PU matrix filled with porous microspheres, i.e. microballoons (Nouryon Expancel 461 DET 40 d25), was fabricated. To achieve such materials, the protocol is the same as described above, except that after degassing, 8 mg (sample PU + μballoons 1) and 24 mg (sample PU + μballoons 2) of such microballoons were added to the polyol B part. Then, isocyanate A was added under stirring and after complete mixing, the mixture was poured into the same cylindrical moulds. The samples were subjected to the same thermal treatment as the pure PU matrix.
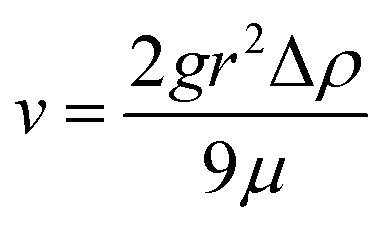
The other two types of composites were made by either adding microfluidic-based or double emulsion-based beads. Concerning the MF samples, as for the microballoons, the beads (MF3 – 650 mg, MF2 – 400 mg or MF1 – 240 mg) were added into the polyol B part after degassing and prior incorporation of isocyanate A. After mixing both parts under stirring, the bead-containing mixtures were kept under stirring for 10 minutes before being poured into the cylindrical moulds. During this 10 minutes duration, the viscosity of the mixture increased, thereby preventing the beads from going to the top of the matrix due to the mass density mismatch, which was more particularly observed with large beads when no precautions were taken. Indeed, the sedimentation speed v, given by Stokes' law, depends on the square of the radius r of the sphere considered:
 | (1) |
3. Results and discussion
3.1. Description of the composites
The different composites are listed in Table 1 and a macroscopic picture of the obtained samples is presented in Fig. 4A. Different inclusion concentrations were chosen to enable comparison of different conditions:| Sample | Gas vol. fraction (%) | Inclusion vol. fraction (%) | Inclusion size (μm) | |
|---|---|---|---|---|
| PU (pure) | 0 | — | — | |
| Bulk porous PDMS | OH-457 | 30 | — | — |
| KF-6104 | ||||
| μB1 = PU + μballoons 1 | 1.6 | 1.6 | 20–40 (ref. 22) | |
| μB2 = PU + μballoons 2 | 5.0 | 5.0 | 20–40 (ref. 22) | |
| MF3 = PU + Beads MF3 | 1.6 | 5.0 | 505 ± 40 | |
| MF2 = PU + Beads MF2 | 0.9 | 3.0 | 323 ± 18 | |
| MF1 = PU + Beads MF1 | 0.6 | 2.0 | 192 ± 25 | |
| DE = PU + Beads DE | 1.6 | 5.0 | 203 ± 110 | |
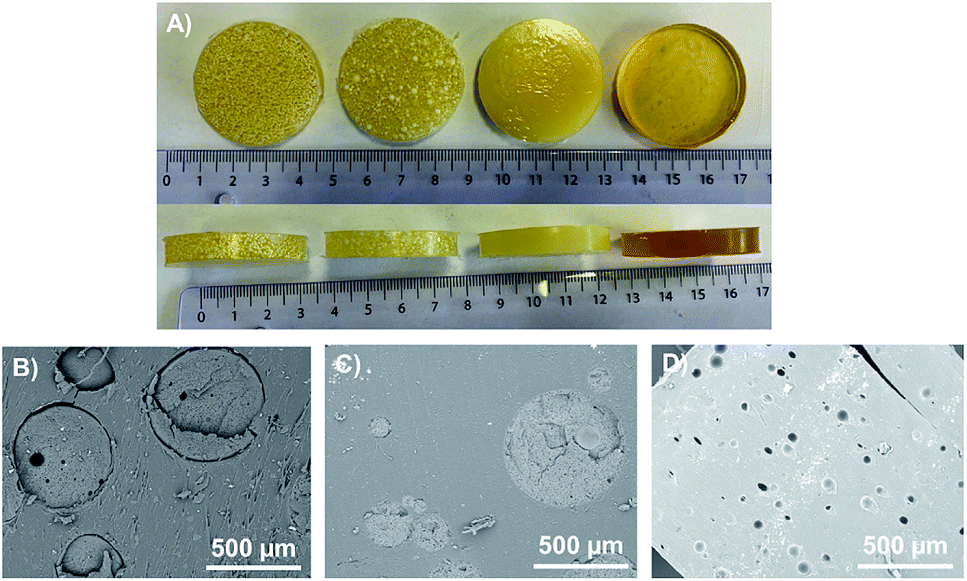 | ||
| Fig. 4 (A) Photography of the different PU samples from left to right: MF3, DE, μB1 and pure PU sample. SEM pictures of (B) sample MF3 (C) sample DE and (D) sample μB1. | ||
(1) Same overall porosity – we may want to measure the impact of the air repartition in the sample, at a constant global air volume fraction. This will be achieved by comparing the acoustic properties of samples μB1, MF3 and DE. Indeed, the porosity of the MF beads being equal to 33.3%, the global amount of air in a sample containing 5 vol% of inclusions is equal to 0.333 × 0.05 = 1.6 vol%.
(2) Same volume fraction of inclusions – we may also compare the data obtained with a similar volume fraction of inclusions (samples μB2 and MF3).
(3) Investigations on the beads size effect – we designed and fabricated samples MF2 and MF1 in order to test the impact of the bead size on the acoustic signal. To do so, we had to lower the concentration for better measurements since first trials showed that the scattering inside the sample was extremely strong as the number of inclusions increases, i.e. as the radius of the inclusions decreases, which made the measurement impossible (not enough signal was recorded through the samples). For this reason, we decreased the inclusion volume fraction to 3% with MF2 and 2% for MF1.
In all cases, one could obtain samples exhibiting a very homogeneous spatial distribution of beads. No bead-concentration gradients were observed in all our samples, as could be checked afterward by a simple macroscopic observation (not shown here).
We then examined the internal structure of the different samples using a SEM (Fig. 4B–D). Concerning the MF beads, the combination of a smooth surface and the absence of chemical reactions between the silicones (from the beads) and the PU (matrix) resulted in a sharp interface between the beads and the surrounding matrix. Thus, when cutting the sample for cross-sectional observation (Fig. 4B), the beads appear slightly unsealed. In the DE sample, the beads exhibit surface pores and the PU can penetrate a little bit inside the beads, thus embedding them fully into the matrix (Fig. 4C). No sharp interfaces were then observed in cross-sectional pictures.
After inclusion into the PU matrix, micro-balloons were homogeneously distributed into the material as can be seen from the SEM pictures (Fig. 4D).
3.2. Mechanical and acoustical characterizations
The longitudinal–wave properties are easily measurable by standard ultrasonic techniques, which have been fully described by Zimny et al. previously.23 For each material, we prepared two large disk-shaped samples (as shown in Fig. 4A) with two different thicknesses d (4 and 7 mm). Each sample was then placed between two identical broadband ultrasonic (US) transducers (emitter and receiver, Olympus V302) with a diameter of 30 mm and a central frequency f of 1 MHz. The US transducers were placed face to face and mounted on a linear manual stage, allowing the precise measurement of the sample thickness, i.e., the propagation distance d with an uncertainty of about 10 μm. The emitting transducer was excited with short (broadband) pulses generated by a pulser/receiver (Olympus 5077PR-40-E) that was also used to amplify the electric signal recorded by the receiving transducer before its acquisition on a computer.
By contrast, the shear properties of these soft materials cannot be easily measured using direct ultrasonic measurements and were deduced from mechanical measurements of the shear modulus G using a Dynamic Mechanical Analysis apparatus (DMA/SDTA861e, Mettler Toledo). Two equivalent disc samples with a diameter D = 5 mm and a thickness h = 2 mm were cut from the original samples and submitted to shear harmonic oscillations with a frequency varying from 0.1 to 100 Hz and a force F equivalent to 1 N, which is in the linear domain of the mechanical behaviour of the materials. The shear stress στ(ω) was registered as a function of the applied shear strain γ(ω) allowing the measurement of the real and imaginary parts of the complex-valued shear modulus G = G′ + iG′′ relating στ and γ, such that:
| στ = (G′ + iG′′)γ | (2) |
To obtain the curves at different frequencies, the measurements were conducted at ten different temperatures between TG − 75 °C and TG + 30 °C. The samples were first cooled down in the DMA apparatus to a temperature below the glass transition, tightened in the clamps and then tested at a constant temperature. The equilibration time at each temperature step was at least 20 min. The reproducibility was checked by repeating the measurements on 3 equivalent samples.
The mechanical properties of the PU matrix depend strongly on temperature and measurement frequency f. We used the temperature–frequency equivalence principle to build the master curves from the mechanical measurements of the complex-valued shear modulus G at different temperatures via a commonly accepted procedure.24 Briefly, the values of G′ and G′′ were measured at frequencies in the 0.1–100 Hz range and were plotted in the double logarithmic scale log(G) − log(f). The segment at T = 30 °C was chosen as a reference. For other temperature segments, a shift factor a(T) was applied for the frequencies in order to obtain a continuous line for G. Using this procedure, we obtain the following curve (Fig. 5) for the variation in G′ and G′′ as a function of frequency f. We then smoothen the curve (see the continuous (G′) and the dashed (G′′) lines on Fig. 5a) and use the obtained values to determine the values of cT(f) and αT(f) as a function of frequency (Fig. 5b and c) using the following expressions:25
 | (3a) |
 | (3b) |
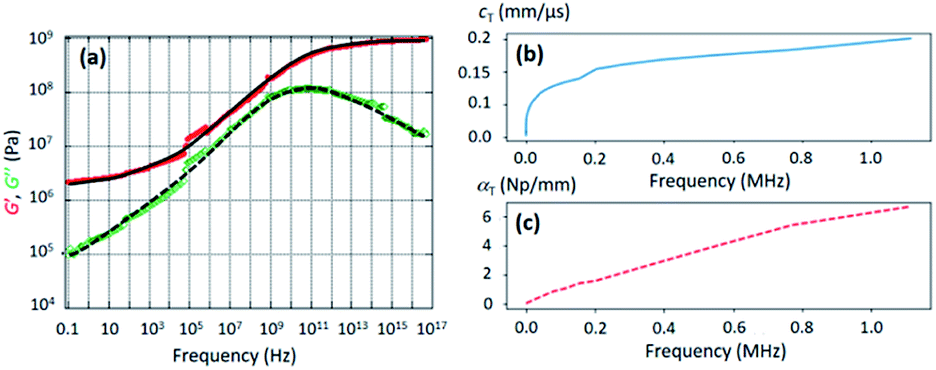 | ||
| Fig. 5 (a) Evolution of the real (G′, red circles) and imaginary (G′′, green diamonds) parts of the PU shear modulus G as a function of frequency, as deduced from DMA. The continuous and the dashed lines were obtained by smoothening the experimental points. (b) Evolution of the transverse-wave phase velocity cT versus frequency as deduced from the data of (a) and formula (3a). (c) Evolution of the transverse-wave attenuation αT versus frequency as deduced from the data of (a) and formula (3b). | ||
Concerning the transverse properties of porous PDMS (used to make the resonant beads), we know by experience that they have very few effects on the overall acoustical properties of the final composites and we therefore used the data extracted from a previous work, as it can be seen in ref. 26. These two methods were applied to extract the acoustical properties of pure PU and porous PDMS, which are listed in Table 2. Note that the longitudinal-wave phase velocity in PU (1520 m s−1) is nearly the one in water (1500 m s−1), while the transversal-wave attenuation is about one hundred times greater than that of the longitudinal wave.
| Sample | cL (mm μs−1) | αL (Np mm−1) | cT (mm μs−1) | αT (Np mm−1) |
|---|---|---|---|---|
| PU | 1.52 | 0.05 f | 0.193f 0.17 | 6.3 f 0.8 |
| Bulk porous PDMS | 0.21f 0.24 | 9 f 0.9 | ≈ 0.016 | ≈ 170 f 1.5 |
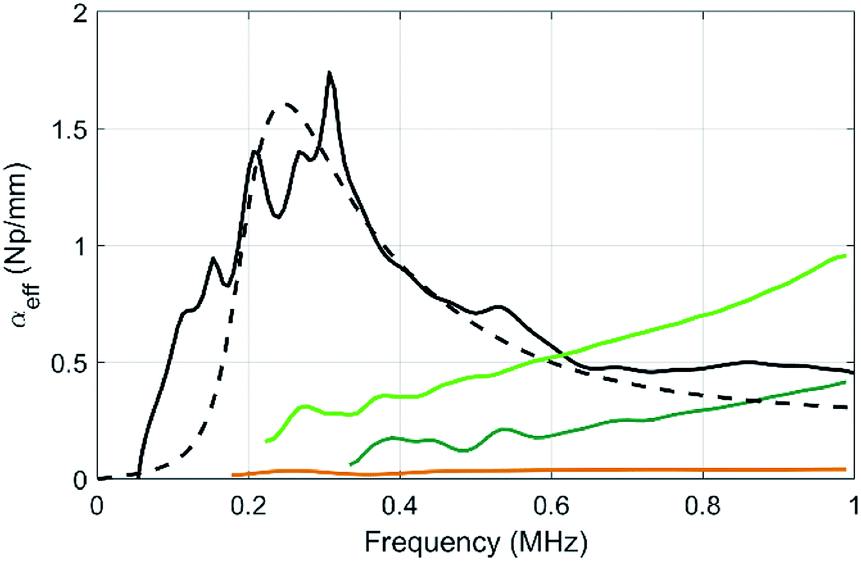 | ||
| Fig. 6 Compared evolutions of the longitudinal-wave attenuations as a function of frequency for the pure PU matrix (brown), for sample MF3 (black) and for the two samples containing micro balloons at various volume fractions of balloons (sample μB1, dark green, and μB2 in light green). The dashed line is a numerical prediction of αeff in MF3 using the MST model within the frame of the independent scattering approximation and the data given in Table 2. | ||
The attenuation of the pure PU matrix is clearly negligible in the whole frequency range considered here. First, one can compare the attenuation between samples containing the same gas volume fraction, i.e. 1.6% (samples μB1 and MF3). With 5 vol% of porous PDMS beads (sample MF3), the attenuation coefficient exhibits a clear acoustic resonance around 300 kHz and, for frequencies lower than ∼500 kHz, the resulting acoustic absorption is by far higher than the one obtained with the same relative amount of gas dispersed in the microballoons (sample μB1). Clearly, the strategy involving the aggregation of the gas bubbles in fewer elements with a larger diameter (i.e. the porous polymer beads) is the right one to increase the acoustic absorption in the low-frequency regime that is of interest for stealth applications. Concerning sample μB1, the attenuation increases slowly with frequency but definitely overcome the one obtained with beads only above ∼700 kHz. Actually, the resonance still remains with the balloons, but it is shifted to higher frequencies because it is inversely proportional to the size of the object (the microballoons, size 20–40 μm being much smaller than the one of beads). As the volume fraction of microballoons is increased to become equal to the one of beads in sample μB2 (with now an overall porosity more than 3 times higher than that of the MF3 sample), the acoustic absorption is still much smaller than the one of sample MF3 in the low-frequency regime (i.e. for f lower than 500 kHz).
Using the characterization data obtained for each element contained in the composites (Table 2), the results can be compared to what is expected from a multiple scattering theory (MST) model within the frame of the independent scattering approximation.27 This model remains valid as long as the concentration of beads and balloons in the PU matrix is not too high (less than 10%), which is the case here. We obtain the dashed line, and the MST prediction shows a reasonable agreement with the experimental data obtained in sample MF3. However, this model fails to recover the attenuation for the balloons (not shown here). The oversimplified assumption of an air cavity for the modelling of the balloons misses the mechanical contribution of its shell and may therefore explain the discrepancy between the experiment and the model, as also reported by other authors.28
We then measured the evolution of the attenuation as the diameter of the beads varies from 505 μm (MF3) to 323 μm (MF2) and 192 μm (MF1). The results are plotted in Fig. 7. Clearly, and as expected,29 as the size of the particles decreases, the attenuation peak related to the monopolar resonance is shifted to higher frequencies. Our approach thus allows for the choice of the frequency range by simply tuning the size of the polymer beads.
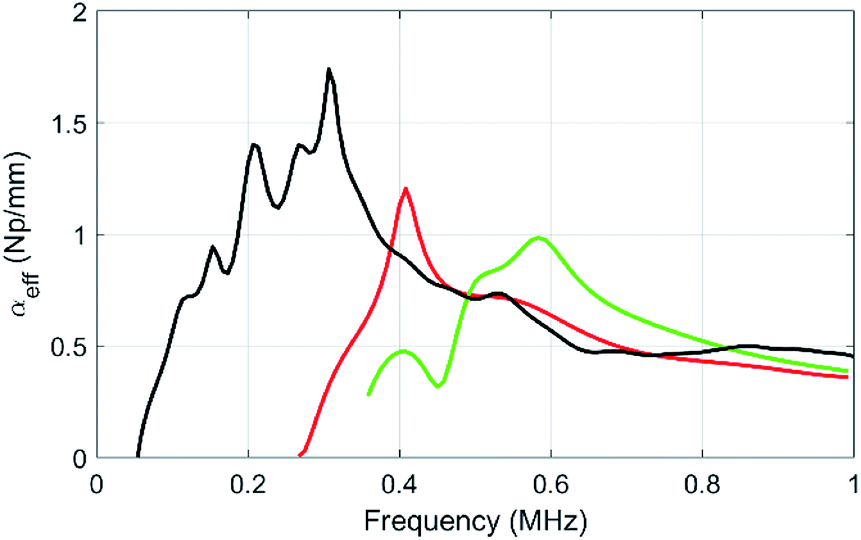 | ||
| Fig. 7 Evolution of the effective attenuation–frequency profile, as the average diameter of the beads varies from 505 μm (sample MF3, black curve, bead vol. fraction 5%) to 338 μm (sample MF2, red curve, bead vol. fraction 3%) and 192 μm (sample MF1, green curve, bead vol. fraction 2%). | ||
Of course, as discussed above, the fabrication of polymer beads using our microfluidic device is time-consuming, which might be a problem to upscaling the fabrication of our materials. Thus, we also measured the acoustic properties of sample DE and compared it to the one obtained with the samples μB1 and MF3 (Fig. 8).
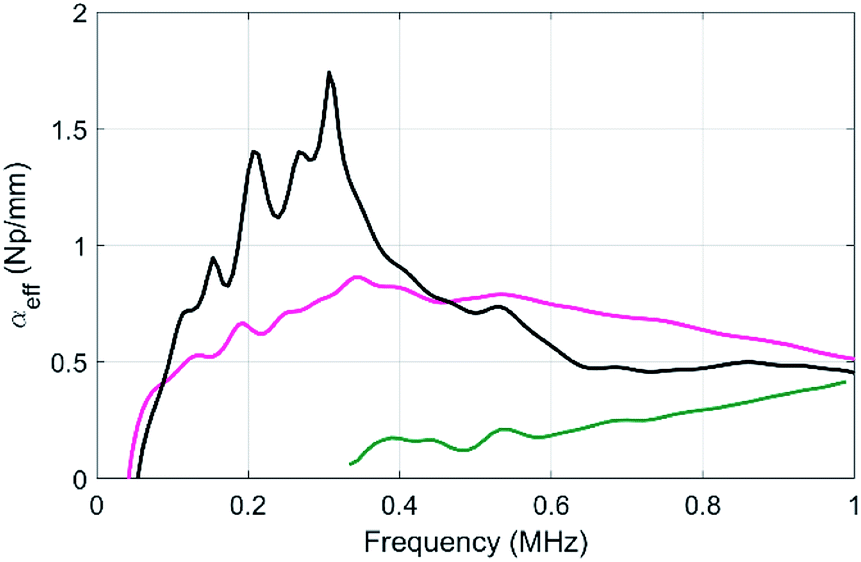 | ||
| Fig. 8 Compared evolutions of the longitudinal-wave attenuations as a function of frequency for the sample MF3 (black), sample μB1 (green) and the DE sample (pink). | ||
In comparison to the resonant attenuation observed with MF3, the DE samples exhibit a quasi-flat attenuation spectrum, which is due to the large polydispersity of the resonant beads.30 However, the attenuation is still always larger than the one exhibited by sample μB1, even at a high frequency (up to 1 MHz). This double emulsion method is very promising for the fabrication of larger scale samples that are currently under way in our laboratory. Such larger samples including beads with larger diameters would in particular be compatible with lower frequency measurements.
4. Conclusions
Through an emulsion-templating approach, we have fabricated composite materials composed of a dispersion of porous polymer beads (with characteristic sizes above 100 μm in diameter) in a PU matrix. The obtained composites were then compared to the one obtained using small micrometric micro-balloons of sizes 20–40 μm. At an identical gas volume fraction, we showed that our materials exhibit much higher acoustic absorption in the low frequency domain of interest for stealth applications. Furthermore, by playing with the characteristic diameter of the porous polymer beads, we demonstrated that it is possible to tune the attenuation peak in a targeted frequency domain. Finally, we showed that in the context of very broadband attenuation, our locally resonant materials concept should be easily up-scalable using a relatively simple double emulsification process.Conflicts of interest
There are no conflicts to declare.Acknowledgements
RP, TL and all the coworkers are indebted with the ANR and DGA for granting them a postdoctoral position through the PANAMA Project (ANR-17-ASTR-0002). Fruitful conversations with J. Leng, from LOF; F. Le Lay, P. Rublon, J. Delcroix and Y. Renou from Naval Group are gratefully acknowledged. The authors thank M. Kropfgans from Shin-Etsu Silicone as well as F. Marchal and T. Ireland from Elkem Silicones for providing them with KF surfactant and silicone rubber, respectively. They also thank A. Turani-i-Belloto for providing the MATLAB program used for the size distribution and E. Laurichesse for his help with the DMA experiments.References
- P. Méresse, C. Audoly, C. Croënne and A.-C. Hladky-Hennion, Acoust. Metamaterials Phononic Cryst., 2015, 343, 645–655 Search PubMed
.
- L. A. A. Warnes, Ultrasonics, 1989, 27, 97–100 CrossRef CAS
- H. Zhao, Y. Liu, J. Wen, D. Yu and X. Wen, J. Appl. Phys., 2007, 101, 123518 CrossRef
- H. Dai Shin and B. H. Ahn, Elastomers Compos, 2017, 52, 326–331 Search PubMed
- B. Yuan, W. Jiang, H. Jiang, M. Chen and Y. Liu, J. Reinf. Plast. Compos., 2018, 37, 609–616 CrossRef CAS
- B.-E. Gu, C.-Y. Huang, T.-H. Shen and Y.-L. Lee, Prog. Org. Coat., 2018, 121, 226–235 CrossRef CAS
- A. M. Baird, F. H. Kerr and D. J. Townend, J. Acoust. Soc. Am., 1999, 105, 1527–1538 CrossRef
- S. Beretti, 10ème Congrès Français d'Acoustique, 2010 Search PubMed
- H. Zhou, B. Li and G. Huang, J. Appl. Polym. Sci., 2006, 101, 2675–2679 CrossRef CAS
- Y. Ng and L. Hong, J. Appl. Polym. Sci., 2006, 102, 1202–1212 CrossRef CAS
- W. Sun, X. Yan and X. Zhu, J. Appl. Polym. Sci., 2011, 122, 2359–2367 CrossRef CAS
- P. Yu. Apel, I. V. Blonskaya, S. N. Dmitriev, O. L. Orelovitch and B. Sartowska, J. Membr. Sci., 2006, 282, 393–400 CrossRef CAS
- B. Le Droumaguet, R. Lacombe, H.-B. Ly, M. Guerrouache, B. Carbonnier and D. Grande, Polymer, 2014, 55, 373–379 CrossRef CAS
- H. B. Ly, B. Le Droumaguet, V. Monchiet and D. Grande, Polymer, 2015, 78, 13–21 CrossRef CAS
- A. Turani-i-Belloto, N. Meunier, P. Lopez and J. Leng, Soft Matter, 2019, 15, 2942–2949 RSC
- M. S. Silverstein, Prog. Polym. Sci., 2014, 39, 199–234 CrossRef CAS
- A. Kovalenko, M. Fauquignon, T. Brunet and O. Mondain-Monval, Soft Matter, 2017, 13, 4526–4532 RSC
- A. Kovalenko, K. Zimny, B. Mascaro, T. Brunet and O. Mondain-Monval, Soft Matter, 2016, 12, 5154–5163 RSC
- N. Vilanova, C. Solans and C. Rodríguez-Abreu, Langmuir, 2013, 29, 15414–15422 CrossRef CAS
- N. Vilanova, Y. V. Kolen’ko, C. Solans and C. Rodríguez-Abreu, J. Colloid Interface Sci., 2015, 437, 235–243 CrossRef CAS
- R. Kumar, Y. Jin, S. Marre, O. Poncelet, T. Brunet, J. Leng and O. Mondain-Monval, J. Porous Mater., 2020 DOI:10.1007/s10934-020-00987-w
- https://expancel.nouryon.com/lightweight-fillers/expancel-de/.
- K. Zimny, A. Merlin, A. Ba, C. Aristégui, T. Brunet and O. Mondain-Monval, Langmuir, 2015, 31, 3215–3221 CrossRef CAS
- J. D. Ferry, Viscoelastic properties of polymers, John Wiley & Sons, 1980 Search PubMed
- D. Royer and E. Dieulesaint, Elastic waves in solids I: Free and guided propagation, Springer Science & Business Media, 1999 Search PubMed
- A. Ba, A. Kovalenko, C. Aristégui, O. Mondain-Monval and T. Brunet, Sci. Rep., 2017, 7, 40106 CrossRef
- P. Sheng, Introduction to wave scattering, localization and mesoscopic phenomena, Springer Science & Business Media, 2006, vol. 88 Search PubMed
- B. R. Matis, S. W. Liskey, N. T. Gangemi, Z. J. Waters, A. D. Edmunds, W. B. Wilson, D. M. Photiadis, B. H. Houston and J. W. Baldwin, Langmuir, 2020, 36, 5787–5792 CrossRef CAS
- T. Brunet, S. Raffy, B. Mascaro, J. Leng, R. Wunenburger, O. Mondain-Monval, O. Poncelet and C. Aristégui, Appl. Phys. Lett., 2012, 101, 011913 CrossRef
- B. Mascaro, T. Brunet, O. Poncelet, C. Aristégui, S. Raffy, O. Mondain-Monval and J. Leng, J. Acoust. Soc. Am., 2013, 133, 1996–2003 CrossRef
| This journal is © The Royal Society of Chemistry 2020 |