DOI:
10.1039/D0RA07265F
(Paper)
RSC Adv., 2020,
10, 39531-39541
Pervaporative separation of water–ethanol mixtures using an Algerian Na+ montmorillonite nanoclay-incorporated poly(vinyl alcohol) nanocomposite membrane
Received
24th August 2020
, Accepted 1st October 2020
First published on 28th October 2020
Abstract
This work aims to study the role of bentonite, Na+ montmorillonite (Na+MMT), as a filler to design a new poly(vinyl alcohol) (PVA)-based membrane for the pervaporation of an azeotropic water/ethanol mixture to enhance its separation efficiency. PVA/Na+MMT nanocomposite membranes, containing different ratios of Na+MMT (i.e., 1, 5, 10, 15, and 20 wt%), were prepared using the solvent casting method and crosslinked with maleic acid. The interactions between the PVA polymer and MMT were determined using Fourier transform infrared spectroscopy. Structural characterization by X-ray diffraction and scanning electron microscopy (SEM) analysis showed that the nanoclay structure was well-exfoliated and distributed in the crosslinked PVA matrix. To determine the thermal stability of different membranes, thermogravimetric analysis and differential scanning calorimetry were used. The mechanical properties of pure PVA and the intercalated polymer material were studied. Of note, in this study, the membranes showed a simultaneous increase in the permeation flow and selectivity depending on the montmorillonite filling charge.
Introduction
Ethanol is a solvent that is widely used in pharmaceutical and chemical industries; it forms an azeotrope with water at 96 wt%,1 and most of its applications require high purity. The separation of liquid organics with close boiling points, or azeotropic mixtures, isomers, or heat-sensitive mixtures, is best achieved by the pervaporation technique owing to its simplicity and cost effectiveness.2
Dehydration of alcohol is one of the important developed areas of the pervaporation process. The key to success of the pervaporation process is the suitable choice of the polymeric material and the design of membranes with high permeability, good selectivity, and mechanical strength.3
According to its organophilicity or hydrophilicity, the membrane is selected for a particular application. Thus, the choice of a membrane has always been essential when using separation.
Poly(vinyl alcohol) is one of the most widely used hydrophilic polymers for pervaporation.4 Its good film-forming character, strong affinity to water, and compatibility with many other polymers justify the choice of this polymer as a base material in this study.
However, owing to its high hydrophilicity, it is difficult to manufacture PVA membranes that exhibit both significant fluxes and selectivity during pervaporation. The stability of PVA membranes can be improved by mixing with other polymers, crosslinking, surface modification, and grafting. The most effective and commonly used crosslinking agents for PVA are dialdehydes such as glyoxal, glutaraldehyde,5,6 and maleic acid.7
Recently, nanocomposite polymers have attracted considerable scientific and industrial interest owing to their superior properties stemming from nanofillers. Various inorganic fillers, fibers, and anisotropic particles [e.g., layered silicates8 and carbon nanotubes9 have been determined to be particularly useful for strengthening the polymer matrix].
Polymer (nylon 6)–clay nanocomposites were first synthesized by the Toyota group.10 According to them, very small quantities of silicate layers have resulted in considerable improvements in thermal and mechanical properties owing to the possibility of mixing polymers with phyllosilicates in the molten state without the use of organic solvents.
Polymer nanocomposites are two-phase materials in which the polymers are reinforced by nanoscale fillers. One of the most extensively used filler materials is the smectite class of aluminum silicate clays; montmorillonite (MMT) is the most common representative of such clays. MMT has been employed in many polymer/layered silicate nanocomposite systems because it has a potentially high aspect ratio and high surface area, which may lead to materials that may exhibit considerable property enhancements. In addition, it is environmentally friendly, naturally occurring, and readily available in large quantities.11
Thus, taking into account the environmental and economic aspects, in our current study, we chose PVA as a polymer matrix and Algerian MMT as a reinforcement material. The effect of MMT concentration on nanocomposite crosslinked PVA has been studied. Nanocomposite membranes were characterized; we studied their mechanical and thermal properties and estimated their pervaporation performance for the separation of the azeotropic water/ethanol mixture.
Experimental
Materials
Poly(vinyl alcohol) (PVA) with a molecular weight of 72![[thin space (1/6-em)]](https://www.rsc.org/images/entities/char_2009.gif) 000 g mol−1 and 97.5–99.5% degree of hydrolysis was purchased from FLUKA (Switzerland). A sodium montmorillonite (Na+MMT) mineral, which was purified from a natural bentonite powder (98% montmorillonite) from Maghnia (Western Algeria), was provided by ENOF (Entreprise Nationale des Substances Utiles et des Produits Non-ferreux) and has the chemical formula (Si8)IV(Al4−xMgx)VIO20(OH)4. The chemical composition of the Algerian montmorillonite used is showed in Table 1. It had a cation exchange capacity of 89 meq g−1 and was synthesized based on the previous report.12 Crosslinking agent, maleic acid (99%) (MA), was purchased from Acros Organics (New Jersey, USA). The catalyst agent, hydrochloric acid (HCl) (37 vol%), was received from AnalaR NORMAPUR (France). Ethanol (analytical reagent grade) was provided by Fisher Scientific.
000 g mol−1 and 97.5–99.5% degree of hydrolysis was purchased from FLUKA (Switzerland). A sodium montmorillonite (Na+MMT) mineral, which was purified from a natural bentonite powder (98% montmorillonite) from Maghnia (Western Algeria), was provided by ENOF (Entreprise Nationale des Substances Utiles et des Produits Non-ferreux) and has the chemical formula (Si8)IV(Al4−xMgx)VIO20(OH)4. The chemical composition of the Algerian montmorillonite used is showed in Table 1. It had a cation exchange capacity of 89 meq g−1 and was synthesized based on the previous report.12 Crosslinking agent, maleic acid (99%) (MA), was purchased from Acros Organics (New Jersey, USA). The catalyst agent, hydrochloric acid (HCl) (37 vol%), was received from AnalaR NORMAPUR (France). Ethanol (analytical reagent grade) was provided by Fisher Scientific.
Table 1 Chemical compositions of the Algerian montmorillonite used13
| Species |
SiO2 |
Al2O3 |
Fe2O3 |
MgO |
CaO |
Na2O |
K2O |
TiO2 |
As |
PAF |
| Percentage (wt%) |
69.4 |
14.7 |
1.2 |
1.1 |
0.3 |
0.5 |
0.8 |
0.2 |
0.05 |
11 |
Preparation of PVA nanocomposite membranes
1.0 g of PVA was dissolved in 10 mL of distillated water at 90 °C under continue vigorous stirring, then a known amount of Na+MMT suspension was added to the prepared polymeric solution. The suspension resulted was taken under reflux at the same temperature. The homogeneous suspension was cooled to room temperature for 2 h; then, 0.2 g of MA and 0.5 mL (2 M) of HCl were added with slight stirring for 30 min. The mixture was poured on a Petri dish and dried in open air for 48 h. A series of five membranes were prepared by this procedure and the preparation conditions are summarized in Table 2.
Table 2 Preparation conditions of crosslinked PVA/Na+MMT nanocomposite membranes
| Membrane |
Na+MMT/PVA (wt![[thin space (1/6-em)]](https://www.rsc.org/images/entities/char_2009.gif) : :![[thin space (1/6-em)]](https://www.rsc.org/images/entities/char_2009.gif) wt%) wt%) |
PVA (g) |
Na+MMT (g) |
MA (g) |
HCl 2 M (mL) |
Water (mL) |
| Crosslinked PVA (CPVA) |
0![[thin space (1/6-em)]](https://www.rsc.org/images/entities/char_2009.gif) : :![[thin space (1/6-em)]](https://www.rsc.org/images/entities/char_2009.gif) 100 100 |
1.0 |
0 |
0.2 |
0.5 |
10 |
| CPVA/Na+MMT1 |
01![[thin space (1/6-em)]](https://www.rsc.org/images/entities/char_2009.gif) : :![[thin space (1/6-em)]](https://www.rsc.org/images/entities/char_2009.gif) 99 99 |
1.0 |
0.01 |
0.2 |
0.5 |
10 |
| CPVA/Na+MMT5 |
05![[thin space (1/6-em)]](https://www.rsc.org/images/entities/char_2009.gif) : :![[thin space (1/6-em)]](https://www.rsc.org/images/entities/char_2009.gif) 95 95 |
1.0 |
0.05 |
0.2 |
0.5 |
10 |
| CPVA/Na+MMT10 |
10![[thin space (1/6-em)]](https://www.rsc.org/images/entities/char_2009.gif) : :![[thin space (1/6-em)]](https://www.rsc.org/images/entities/char_2009.gif) 90 90 |
1.0 |
0.1 |
0.2 |
0.5 |
10 |
| CPVA/Na+MMT15 |
15![[thin space (1/6-em)]](https://www.rsc.org/images/entities/char_2009.gif) : :![[thin space (1/6-em)]](https://www.rsc.org/images/entities/char_2009.gif) 85 85 |
1.0 |
0.15 |
0.2 |
0.5 |
10 |
| CPVA/Na+MMT20 |
20![[thin space (1/6-em)]](https://www.rsc.org/images/entities/char_2009.gif) : :![[thin space (1/6-em)]](https://www.rsc.org/images/entities/char_2009.gif) 80 80 |
1.0 |
0.20 |
0.2 |
0.5 |
10 |
Characterization of the membranes
Fourier transform infrared spectroscopy (FTIR). FTIR spectroscopy was performed on a PerkinElmer FTIR spectrum BX system in the scanning range of 400–4000 cm−1 at room temperature under transmittance mode at 4 cm−1 increment. All the membranes prepared were examined in film form.
X-ray diffraction (XRD). XRD experiments were performed on the obtained films at room temperature using a Siemens D-5000 X-ray diffractometer (30 kV, 10 mA) with Co (λ = 1.788965 Å) irradiation at the scanning rate of 0.02° min−1 in the range of 2–50°. All prepared membranes were examined in film form, while, Na+MMT nanofiller was analyzed as powder.
Scanning electron microscopy (SEM). Scanning electron microscopic (SEM) analyses of different samples were performed on the obtained films coated with gold grid using JSM-6060LV (JEOL).
Differential scanning calorimetry (DSC). DSC measurements were performed under nitrogen atmosphere on a DSC Q1000 (TA Instruments, Canada) instrument, previously calibrated with indium. Samples were heated from 25 to 400 °C with a heating rate of 20 °C min−1. Samples weighing between 8 and 10 mg were packed into aluminum DSC pans before being placed in the DSC cell. The obtained thermograms revealed that samples prepared did not undergo degradation. Glass transition temperatures Tg were derived accurately from the thermal curves as the midpoint in the heat capacity variation with temperature. The melting point of PVA was taken from the top of endothermic peak. To eliminate all eventual volatile compounds incrusted in the samples, such as the water and impurities, the Tg values were taken from the second run of the DSC process.
Thermogravimetric analysis (TGA). TGA measurements were performed on a SDT 600 (TA Instruments, Canada) instrument under nitrogen atmosphere with the pure gas flow rate of 50 mL min−1. Afterward, 4–10 mg of sample was carefully loaded into the TGA porcelain pan then heated from 25 to 700 °C at a heating rate of 20 °C min−1.
Mechanical properties of nanocomposite membranes. The mechanical properties of polymeric samples were investigated using an Instron Zwick/Roell Z010 instrument (France) at the speed of 0.3 mm s−1. The tensile properties (e.g., tensile strength, modulus at 100%, and elongation at break) were evaluated according to the norm DIN EN ISO 527-1.
Swelling experiments. Sorption experiments S (%) of the synthesized membranes were performed in water, ethanol, and water/ethanol azeotropic mixture (4/96 wt%). First, dried membranes were weighed and soaked in the abovementioned solutions at ambient temperature. Then, they were removed, dried with a tissue paper, and weighed with METTLER TOLEDO AB265-S/FACT DualRange Analytical Balance. The percentage degree of swelling was calculated by eqn (1)| |
 | (1) |
where Wswollen and Wdry are the weight of the swollen and dry membrane, respectively.
Pervaporation experiments. Separation of the ethanol/water mixture was performed by using the pervaporation apparatus described by Ping et al.14 The pervaporation cell, with a capacity of 125 cm3, is made of stainless steel and is divided into two compartments that are separated by an organic membrane; the effective surface area of the membrane in contact with the feed liquid is 29.28 cm2. The upstream compartment is under agitation. The downstream compartment is under partial vacuum (less than 1.6 mbar) produced by the pump Vacuubrand PC 3001 VARIO Pro. The pervaporate is recovered in the traps cooled with liquid nitrogen. The temperature of the charge is controlled by a thermostatic bath (30 °C). The initial charge consisted of water–ethanol azeotropic mixtures.The liquid permeate was analyzed by gas chromatography with a Shimadzu GC-1701-1 equipped with a thermal conductivity detector heated at 200 °C, nitrogen as a carrier gas, and a capillary column Porapak-Q (60 m × 0.25 mm) heated at 160 °C. The injection-port temperature was 200 °C.
The separation performance of the studied membranes was assessed in terms of pervaporation rate (J), separation selectivity (α), component flux,15 and by the pervaporation separation index (PSI)16 defined as follows:
Permeation flux (J) in g m−2 h−1 was calculated by dividing the amount of total permeate (W) in grams by the time (t) in hours of the experiment and area (A) in m2 of the membrane from eqn (2)
| |
 | (2) |
Pervaporation separation selectivity αPV is obtained from eqn (3)
| |
 | (3) |
where
X and
Y are the weight fractions of the components in the feed and permeate, respectively.
Component flux of ethanol and water mixture is obtained from eqn (4)
| | |
Jwater = JXwater and Jethanol = JXethanol
| (4) |
Jwater and
Jethanol are the component fluxes,
J is the flux,
Xwater and
Xethanol are the permeate composition of the mixtures.
The permeation separation index (PSI) as obtained from eqn (5)
Results and discussion
FTIR analysis
Fig. 1 shows the FTIR spectra of CPVA and CPVA/Na+MMT nanocomposites. The pure polymer spectrum shows a broad band centered at 3322 cm−1 attributed to the hydroxyl stretching vibrations of vinyl alcohol units. This absorption band in the composites shifts slightly towards the low wavelengths from 3322 to 3318 cm−1 due to the presence of hydrogen bonding between the hydroxides and the Na+MMT particles. This seems to indicate the presence of a strong adhesion forces between the components of the membrane. A similar behavior was also reported in the literature17 and attributes this to a strong interaction developed between –OH of PVA and silanol groups of MMT. In addition, the bands observed at 2924 cm−1 and 2840 cm−1 are attributed to the symmetric and asymmetric stretching of C–H groups. An absorption band at 1063 cm−1 corresponding to the Si–O stretch is also observed. Similarly, the band at 509 cm−1 is due to the stretching of the Al–O bond of clay. Other characteristic bands are observed at 1426 cm−1 owing to the bending vibrations of O–H, at 1328 cm−1 and 1084 cm−1 owing to the stretching vibrations of C–H and stretching vibrations of C–O, respectively. Transmission peaks at 1651 and 1725 cm−1 are a clear indication of the existence of –CO–CH![[double bond, length as m-dash]](https://www.rsc.org/images/entities/char_e001.gif) CH– stretching owing to reaction of PVA with MA, which results in the formation of an unsaturated ester owing to the intermolecular or intramolecular crosslinking of the chains. Such a structure has also been revealed by Huang et al. and Y. Abou El-Reash et al. in separate studies using similar reactions.18,19
CH– stretching owing to reaction of PVA with MA, which results in the formation of an unsaturated ester owing to the intermolecular or intramolecular crosslinking of the chains. Such a structure has also been revealed by Huang et al. and Y. Abou El-Reash et al. in separate studies using similar reactions.18,19
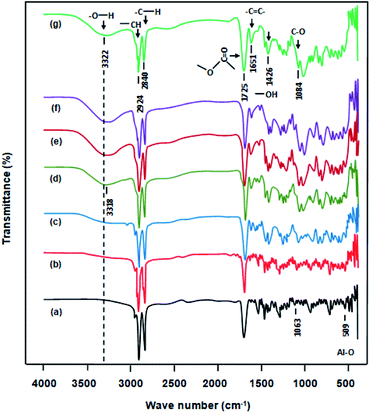 |
| | Fig. 1 FTIR spectra of: (a) pure PVA, (b) CPVA, (c) CPVA/Na+MMT1, (d) CPVA/Na+MMT5, (e) CPVA/Na+MMT10, (f) CPVA/Na+MMT15, (g) CPVA/Na+MMT20 nanocomposites. | |
XRD analysis
The structural characteristics of nanocomposites were determined by XRD techniques. In addition, XRD can identify exfoliation and intercalation in polymer–clay nanocomposites. The XRD spectra of Na+MMT nanoparticles, PVA and CPVA/Na+MMT nanocomposite membranes containing 1, 5, 10, 15, and 20 wt% of Na+MMT are shown in Fig. 2. Na+MMT exhibited a characteristic peak at 2θ = 7.9° with the d001-spacing of 12.9 Å, which was calculated using the Bragg equation; while the other peak at 23° can be attributed to clay impurities.11 As reported by Gaume et al.20 PVA displays two principal broad diffraction peaks centered at 19.85° and 22.9° characterizing the semi-crystalline structure of this polymer, representing reflections from (101) and (200) from a monoclinic unit cell, respectively,21 which is confirmed in our work. In the case of CPVA/Na+MMT nanocomposites with 1, 5, 10 and 20% by weight of Na+MMT, a shift of the peaks of PVA towards the high diffraction angles is observed with broadening and a decrease in the intensity greater than 10% by weight of nanofillers is due to a modification of the crystal structure of PVA by the addition of Na+MMT to the polymer matrix. Thus, with the addition of the nanoclay, the rigidity of the resulting polymer nanocomposite increases, which was confirmed by Jose et al.15 This also confirms the strong adhesion of Na+MMT to the polymeric chains of PVA due to the presence of the hydrogen bonding previously demonstrated by the FTIR analysis. The large peak at 2θ ≈ 2–6° (d = 51.2–17 Å), observed with increase of Na+MMT may be attributed to extended monolayers of PVA within Na+MMT gallery.20 For all the nanocomposites, the peak corresponding to the basal spacing of Na+MMT is not apparent. This suggests a better dispersion of the nonclay in nanocomposites membranes, and also confirms that the nanoclay could be fully exfoliated in the PVA matrix.16
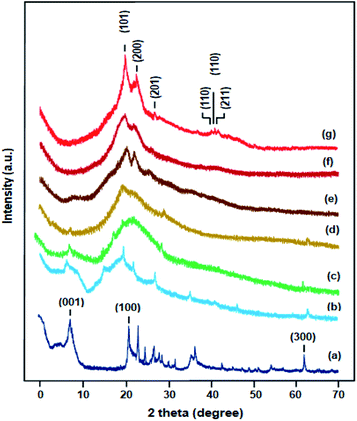 |
| | Fig. 2 XRD spectra of: (a) MMT, (b) pure PVA, (c) CPVA, (d) CPVA/Na+MMT1, (e) CPVA/Na+MMT5, (f) CPVA/Na+MMT10, (g) CPVA/Na+MMT15. | |
SEM analysis
The SEM analysis of the membranes revealed practically good dispersion and distribution of the nanofillers on PVA membrane surfaces. SEM micrographs of pure PVA and CPVA/Na+MMT nanocomposite membranes with different Na+MMT contents are as shown in Fig. 3. The SEM micrograph of pure PVA (Fig. 3a) shows a uniform and smooth surface.22 On the other hand, Fig. 3b shows the image of the CPVA membrane revealing a modification of the surface morphology which is probably due to the addition of maleic acid, thus causing an increase in the density of its porosity. According to Amera et al.,23 this fact contributes to a considerable improvement in the performance of the PVA membrane in terms of the pervaporative parameters. Concerning the nanocomposite images (Fig. 3c–f), as can be observed, that the dispersion of the nanoclay fillers increased with the Na+MMT content. Indeed, it was found that the membrane containing 10 wt% Na+MMT presents the most uniform and the best dispersed structure as showed in Fig. 3d meaning that the clay intercalation is obtained at a lower Na+MMT load but when the higher concentration of the clay exfoliates.15
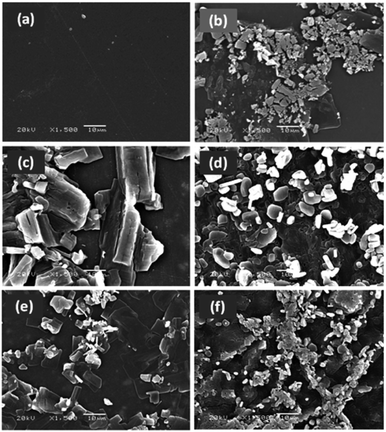 |
| | Fig. 3 SEM micrographs of: (a) pure PVA; (b) CPVA; (c) CPVA/Na+MMT5; (d) CPVA/Na+MMT10; (e) CPVA/Na+MMT15; (f) CPVA/Na+MMT20 nanocomposite membranes. | |
DSC analysis
The thermal properties of CPVA/Na+MMT nanocomposite films were determined by DSC to analyze the effect of Na+MMT content on the glass transition temperature (Tg). DSC thermograms of pure PVA, CPVA, and CPVA/Na+MMT nanocomposites are shown in Fig. 4, and the Tg values are summarized in Table 3. The Tg of pure PVA (Fig. 4a) is localized at 78 °C which agrees with that of the literature.24,25 With an increase in the Na+MMT content in the composite, which ranges between 1 wt% and 20 wt%, the Tg of the composites increased from 110 to 149 °C. It is known that the addition of solid fillers to reinforce a polymer causes an increase in the glass transition temperature when strong forces of attraction act between the polymer and the surface of the fillers. Similar effects have also been reported, such as the incorporation of MWNT,26 zeolite,27 or silica28 in a polymer, which led to an increase in Tg. This observation suggested that substantial interactions developed between the functional groups on the surface of Na+MMT and the hydroxyl of PVA groups via the formation of hydrogen bonds, which affected the mobility of PVA molecular chains. These results confirm those obtained by FTIR and DSC analysis. The incorporation of Na+MMT had an effect on the amorphous region of polymer matrix.15
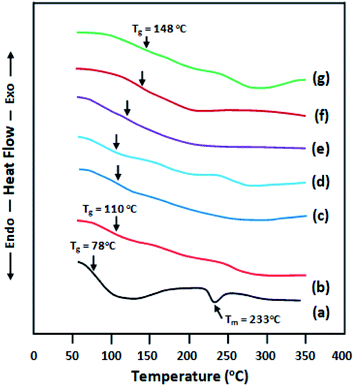 |
| | Fig. 4 DSC thermograms of: (a) pure PVA; (b) CPVA; (c) CPVA/Na+MMT1; (d) CPVA/Na+MMT5; (e) CPVA/Na+MMT10; (f) CPVA/Na+MMT15; (g) CPVA/Na+MMT20 nanocomposite membranes. | |
Table 3 Glass transition temperature results for PVA, CPVA and CPVA/Na+MMT nanocomposites
| Membrane |
Tg (°C) |
| Pure PVA |
78 |
| CPVA |
110 |
| CPVA/Na+MMT1 |
112 |
| CPVA/Na+MMT5 |
110 |
| CPVA/Na+MMT10 |
122 |
| CPVA/Na+MMT15 |
142 |
| CPVA/Na+MMT20 |
149 |
TGA
The thermal stability of pure PVA, CPVA, and CPVA/Na+MMT nanocomposite membranes were characterized by TGA/ATD and the thermal curves obtained are gathered in Fig. 5 for TGA and Fig. 6 for ATD, and the results of the decomposition of these materials are grouped in Table 4. The thermogram of PVA shows two distinct steps of decomposition. The first one begins at around 240 °C in which the polymer loses about 65% of its total mass as products resulting from free radical elimination reactions, the main ones being water and carbon dioxide. The second stage begins at around 400 °C in which the polymer loses a further 10% of its weight as products resulting from chain scissoring reactions which require more energy and occur at high temperatures. The mass loss observed at 80 °C and which continues up to 155 °C is probably due to an evaporation of water molecules stuck to the surface and incrusted in the polymer matrix. The mechanism of PVA degradation has been well studied by different researchers and the results obtained are comparable with those which have been published in the literature.20–23 On the other hand, the decomposition of the CPVA follows the same path as that of the pure polymer; only the second step is a little more ambiguous. Indeed, the second step which is much faster than that of pure PVA begins much earlier which begins directly after the first zone seems to be due to the presence of free water residue which always remains incrusted between the polymer chains. Indeed, due to the CPVA, these molecules can escape from the polymer matrix when the chains start to move and this happens when the chains begin to break down. In this case, at the same time the residual free water and that resulting from the elimination reactions evaporate during this step as the degradation process progresses. The incorporation of the Na+MMT nanoparticles into the matrix of the CPVA practically did not result in the stability of its thermal stability, because practically the same profiles of the curves were observed. On the contrary, perhaps a small loss of stability is observed which increases slightly with the increase in Na+MMT content. From these thermograms we also observe at 600 °C an amount of metal oxide and charred residue resulting from the degradation of PVA in the absence of oxygen.
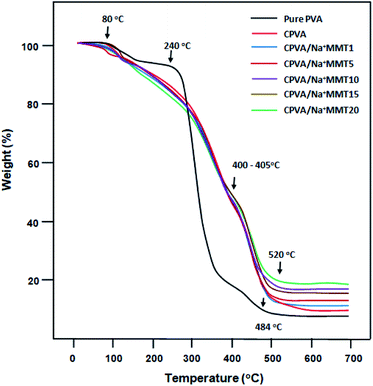 |
| | Fig. 5 TGA thermograms of pure PVA, CPVA and CPVA/Na+MMT nanocomposites containing different Na+MMT contents. | |
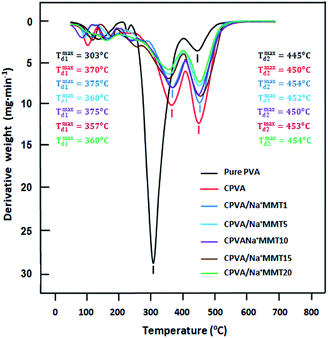 |
| | Fig. 6 DTG thermograms of pure PVA, CPVA and CPVA/Na+MMT nanocomposites containing different Na+MMT contents. | |
Table 4 TGA results for pure PVA, CPVA and PVA/Na+MMT nanocomposite membranes
| Membrane |
First step |
Second step |
Residue at 600 °C (wt%) |
| Tstartd (°C) |
Tendd (°C) |
Tstartd (°C) |
Tendd (°C) |
| Pure PVA |
240 |
400 |
400 |
520 |
7.8 |
| CPVA |
260 |
405 |
405 |
520 |
9.5 |
| CPVA/Na+MMT1 |
270 |
405 |
405 |
520 |
10.6 |
| CPVA/Na+MMT5 |
235 |
400 |
400 |
530 |
13.3 |
| CPVA/Na+MMT10 |
230 |
405 |
405 |
575 |
16.9 |
| CPVA/Na+MMT15 |
220 |
400 |
402 |
550 |
17.3 |
| CPVA/Na+MMT20 |
200 |
400 |
400 |
550 |
19.4 |
The maximum decomposition temperature, Tmax, of pure PVA, CPVA and CPVA/MMT nanocomposites with different compositions were deduced from the first order derivatives of the thermograms (DTG) obtained of Fig. 6. The profiles of these curves confirm the presence of two main zones of decomposition for each sample in addition to the zone of evaporation of free water molecules. As can be also seen from these traces that the passage from pure PVA to CPVA, the Tonset and Tmax for the two decomposition zones shows for the first zone significant shift toward the high temperatures accompanied by a dramatic depression in the maximum of the mass lose, while in the second zone a contrary effect but less striking is observed. Similar phenomena were also observed by Sonker et al.29 using suberic acid as crosslinker. This appears to be due to an absorbing effect of energy supplied by heating due to the presence of residual AM encrusted in the polymer matrix. Indeed, the presence of MA particles between the PVA chains promotes spacing, and therefore allows the PVA chains to move in order to absorb a part of the energy provided by the heater. On the other hand, the incorporation of MMT into the CPVA matrix does not show any significant change in the maximum degradation temperature of the prepared hybrid material, while a depression is observed in the maximums of the two peaks representing the derivative of the mass loss per unit of temperature. The intensity of these thermal peaks gradually decreased as the MMT content in the polymer increased. This reveals that the incorporation of this filler into the CPVA slowed the formation of the products resulting from the decomposition of this polymer. Similar phenomenon was also observed by Sapalidis et al. using a PVA/MTT nanocomposite.30
Mechanical strength
The mechanical properties of polymers are affected by many factors such as exposure to solvents, temperature, and crosslinking.11 The tensile properties of pure PVA, CPVA, and CPVA/Na+MMT nanocomposite membranes were estimated, and the results are shown in Table 5. Pure PVA showed the tensile strength of 15 MPa which agree with that of the literature (15.86 ± 0.86 MPa)31 and increased to 34 MPa after crosslinking with MA. Crosslinking reduced the chain mobility of PVA; therefore, the tensile strength increased. The interaction between the load and matrix can limit the macromolecular movements of the matrix, which increases resistance and decreases elongation at break.16 With the Na+MMT content greater than 1.0 wt%, a phase separation phenomenon may occur and lead to a decrease in mechanical strength and flexibility. It is important to note that despite the important decrease in these properties in certain cases, these membranes still remained malleable and flexible able to give membranes which withstand the stresses of different pressures exerted during its installation and during the separation process. The 100% module increases to 42.41 MPa with 10 wt% in Na+MMT. As a rigid filler, Na+MMT disperses in the matrix and considerably improves the resulting modulus.16
Table 5 Mechanical properties of pure PVA, CPVA and CPVA/Na+MMT nanocomposite membranes
| Membrane |
Tensile strength (MPa) |
Elongation at break (%) |
Modulus at 100% (MPa) |
| Pure PVA |
15 ± 0.6 |
134 ± 7 |
12 ± 2.3 |
| CPVA |
34 ± 11 |
162 ± 33 |
23 ± 1.1 |
| CPVA/Na+MMT1 |
60 ± 5 |
199 ± 21 |
32 ± 2 |
| CPVA/Na+MMT5 |
32 ± 3 |
172 ± 41 |
30 ± 6.4 |
| CPVA/Na+MMT10 |
46 ± 8 |
119 ± 6 |
42 ± 6.5 |
| CPVA/Na+MMT15 |
47 ± 7 |
133 ± 10 |
39 ± 4.6 |
| CPVA/Na+MMT20 |
37 ± 3 |
138 ± 13 |
30 ± 3 |
Swelling experiments
The solution-diffusion model is used to describe the transport phenomenon of pervaporation based on the difference in molecular size instead of volatility, which is the case for distillation. This multistage process is clearly more complex than a single evaporation step, which may lead to the permeate composition to differ from that of the liquid–vapor equilibrium. The study of the sorption phenomenon of the liquid mixture by membrane is a very important step in the pervaporation mechanism. In fact, the greater the sorption of the solvent, the higher its flux. To demonstrate the pervaporation efficiency of the prepared membranes, we performed sorption tests, which allow us to estimate the total swelling. The sorption capacities of different PVA membranes were estimated in water, ethanol, and azeotropic water/ethanol mixture (4/96 wt%) as a function of time (Fig. 7–9) at room temperature.
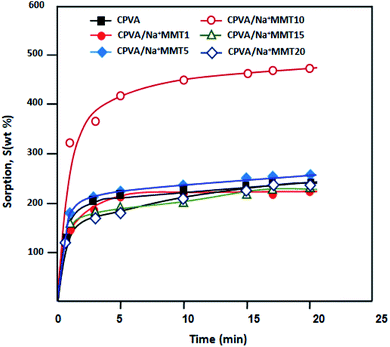 |
| | Fig. 7 Plots of the variation of swelling of nanocomposite membranes in water at room temperature as a function of time. | |
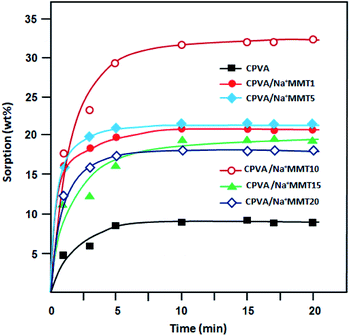 |
| | Fig. 8 Plots of the variation of swelling of nanocomposites membranes in ethanol at room temperature as a function of time. | |
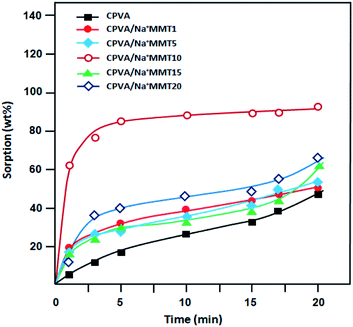 |
| | Fig. 9 Plots of the variation of swelling of the nanocomposite membranes in an azeotropic composition 4![[thin space (1/6-em)]](https://www.rsc.org/images/entities/char_2009.gif) : :![[thin space (1/6-em)]](https://www.rsc.org/images/entities/char_2009.gif) 96 water/ethanol mixture at room temperature as a function of time. 96 water/ethanol mixture at room temperature as a function of time. | |
It was determined that the sorption level of water (Fig. 7) was much higher than that of ethanol (Fig. 8). This can be explained by the hydrophilic interactions between clay particles and PVA matrix as revealed previously by FTIR and DSC analysis. Clay particles may be distributed throughout the PVA matrix, thus, forming strong intercalation. However, the majority of water molecules are adsorbed in the hydrophilic clay region, which in turn will get absorbed by the hydrophilic regions of the PVA matrix for an easy diffusion through the barrier membrane.32 The maximum sorption was achieved in a relatively short time. In all cases, the degree of swelling decreased with an increase in the Na+MMT load above 10 wt% (Fig. 7–9). According to a study carried out by Choudhari et al.33 an increase in the clay content in the membrane matrix reduces the free volume between the polymeric chains.
Pervaporation performance of PVA/MA/MMT nanocomposite membranes
We estimated the pervaporation performance of CPVA/Na+MMT nanocomposite membranes on the separation of ethanol/water azeotropic mixture. It is known that during pervaporation, the best membrane performance is obtained with a simultaneous increase in the flow and selectivity. Thus, the development of such a membrane is a considerable challenge. Fig. 10 shows the effect of the concentration of Na+MMT in synthesized membranes on the variation in flux and separation factor. We observe that the best flux was obtained for a CPVA membrane containing 10 wt% in Na+MMT compared to the results in other studies, as shown in Table 6. When the content of clay was increased up to 10% in the CPVA membranes, the permeation flux decreased with an increase in the amount of clay. This phenomenon is attributed to a decreased free volume. According to Choudhari et al.,33 the incorporated clay in a polymer usually exits in the forms of exfoliated, intercalated, and flocculated states. When the exfoliated state is predominant, as it is observed in our study for the 10% clay content, free volume increases. However, for high ratios of clay, it acts as a barrier and causes resistance to diffusion.
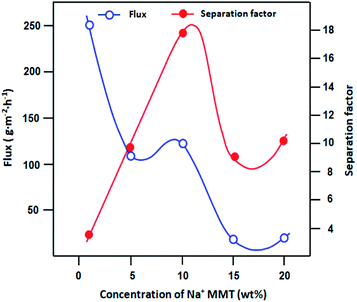 |
| | Fig. 10 Variation in the pervaporation flux and separation factor versus the concentration of Na+MMT for the separation of azeotropic composition of the ethanol–water mixture at 30 °C. | |
Table 6 Molar volume and collision diameter values for ethanol and water34
| |
Molar volume (cm3 mol−1) |
Collision diameter (nm) |
| Ethanol |
167.1 |
0.45 |
| Water |
55.1 |
0.26 |
On the basis of geometrical considerations (Table 6), because the kinetic diameter of ethanol molecule is larger than that of water molecule, water is expected to permeate more preferentially. As shown in Fig. 11, it is clear that the value of Jwater is similar to that of the total flux compared to the value of Jethanol for all membranes. However, for the higher content of clay, these fluxes are similar, which may lead to the better separation performance of the membrane. However, membrane selectivity considerably decreases with an increase in the clay content. The addition of hydrophilic bentonite clay induces good water swelling of the membranes, which results in the transport of both components with similar rates. Thus, the minimum amount of clay provided the best PV performance.
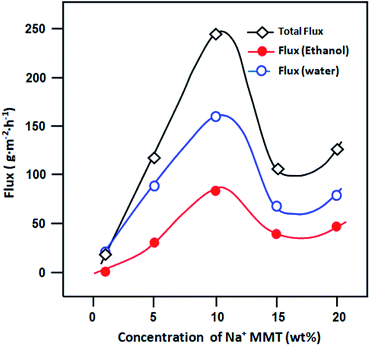 |
| | Fig. 11 Variation in component fluxes versus the concentration of Na+MMT for the separation of azeotropic composition of the ethanol–water mixture at 30 °C. | |
Diffusion coefficient is an important parameter, which is used to estimate the diffusion of penetrants through the membranes. The apparent diffusion coefficient can be calculated by modified Fick's eqn (6)33
| |
 | (6) |
where
δ is the membrane thickness, and
Ci is the concentration of component i in the feed. The calculated values of
Di for different CPVA/Na
+MMT clays are shown in
Table 7. It is determined that the
D values of water through PVA/clay membranes were generally higher than those for ethanol. These results further confirm the observation of larger sorption of water compared with that of ethanol as well as the values of kinetic diameter and molar volume given above.
Table 7 Apparent diffusion coefficient of CPVA/Na+MMT nanocomposite membranes
| Membrane |
Apparent diffusion coefficient Di × 10−8 m2 s−1 |
| Water |
Ethanol |
| CPVA/Na+MMT1 |
1.82 |
0.13 |
| CPVA/Na+MMT5 |
8.82 |
0.67 |
| CPVA/Na+MMT10 |
21.6 |
1.38 |
| CPVA/Na+MMT15 |
9.03 |
0.61 |
| CPVA/Na+MMT20 |
10.8 |
0.72 |
The pervaporation separation index (PSI) indicates membrane performance during pervaporative separation; the greater PSI is, the better performing the membrane is. Fig. 12 shows the variation of PSI as a function of mass% of clay loading. It is observed that there is a considerable increase in PSI values with an increase in the clay content from 0% to 10%. According to the magnitudes of PSI shown in Table 8, CPVA/Na+MMT nanocomposite membrane with a 10% clay content exhibits good separation of the ethanol/water azeotropic mixture with the highest value of PSI of 2710.66. As shown in Table 9 and in other studies,35–43 the magnitudes of J were good.
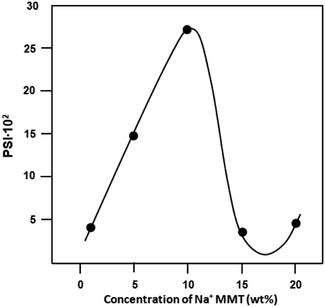 |
| | Fig. 12 Variation in PSI versus the concentration of Na+MMT for the separation of azeotropic composition of ethanol–water mixture at 30 °C. | |
Table 8 PV performance of CPVA/Na+MMT nanocomposite membranes
| Membrane |
Flux (g m−2 h−1) |
Separation factor |
PSI |
| CPVA/Na+MMT1 |
23.21 |
18.42 |
404.384 |
| CPVA/Na+MMT5 |
118.24 |
13.37 |
1463.17 |
| CPVA/Na+MMT10 |
242.4 |
12.18 |
2710.66 |
| CPVA/Na+MMT15 |
107.48 |
4.19 |
343.46 |
| CPVA/Na+MMT20 |
126.4 |
4.53 |
447.38 |
Table 9 Comparison of PV performance between produced membranes and those in previous studies for the separation of water and ethanol mixtures (see the references)
| Membrane |
Water in the feed (wt%) |
Temperature (°C) |
Flux (g m−2 h−1) |
Separation factor |
Ref. |
| CPVA/10 wt% Na+MMT |
4 (azeotr. compos.) |
30 |
242.4 |
12.18 |
This study |
| Pure PVA |
5 |
24 |
190 |
10.01 |
40 |
| PVA crosslinked with malic acid |
5 |
50 |
60 |
93 |
39 |
| PVA/γ-aminopropyl-triethoxysilane |
5 |
50 |
36 |
537 |
36 |
| PVA/25% TEOS, annealed at 130 °C |
15 |
40 |
4 |
893 |
41 |
| PVA/inorganic hybrid membrane crosslinked with TEOS (130 °C) |
15 |
40 |
40 |
893 |
41 |
| Crosslinked PVA with maleic acid |
20 |
30 |
201 |
22 |
35 |
| Crosslinked PVA with fumaric acid |
20 |
60 |
217 |
779 |
38 |
| PVA/PAN |
20 |
60 |
≈900 |
≈148 |
37 |
| CS–PVA/PAN |
20 |
60 |
≈1500 |
≈40 |
37 |
| PVA/fumaric acid |
20 |
100 |
1511 |
211 |
38 |
| PVA crosslinked with GA |
10–50 |
40 |
— |
>2000 |
43 |
| PVA/PAA |
50 |
75 |
2800 |
60 |
42 |
Conclusion
Compared to conventional methods, the pervaporation process is an interesting alternative for the separation of azeotropic mixtures of water and ethanol. A series of crosslinked PVA nanocomposite membranes were prepared by varying the nanoload concentration of Na+MMT and were effectively used for the pervaporation process. The crosslinked PVA/Na+MMT nanocomposite membranes were characterized by FTIR, XRD and SEM analyzes, which confirmed the intercalation or exfoliation of polymer–clay nanocomposites. Thermal stability was improved by the addition of Na+MMT; Na+MMT nanoloads can act as heat and mass transport barriers and delay the thermal decomposition of composites. The incorporation of Na+MMT has considerably improved the mechanical properties of crosslinked PVA/Na+MMT nanocomposite membranes. Tensile strength, elongation at break, and 100% modulus considerably increased compared to those of unfilled systems.
The incorporation of clay particles improves the separation characteristics of crosslinked PVA/Na+MMT for the pervaporation of water/ethanol azeotropic mixture. The addition of 10% by weight of Na+MMT to the membrane matrix results in PSI of 2710.66. With the incorporation of a minimum quantity of membrane loaded with clay, it was possible to effectively separate the azeotropic mixture of ethanol and water. The evaluation of the pervaporation of nanocomposite membranes revealed promising prospects for dehydration applications. Thus, these membranes could be used commercially as selective membranes for the separation of different azeotropic compositions from hydro-alcoholic mixtures. For example, in the future we plan to develop a study involving this type of membrane in the shift of the polycondensation equilibrium to the right by the extraction of water resulting during esterification reactions in order to improve yield and obtain polymers with higher molecular weight.
Conflicts of interest
There are no conflicts to declare.
Acknowledgements
The authors extend their appreciation to the Deanship of Scientific Research at King Saud University for funding this work through Research Group No. RGP-VPP-025.
References
- S. Kalyani, B. Smitha, S. Sridhar and A. J. I. Krishnaiah, Ind. Eng. Chem. Res., 2006, 45, 9088–9095, DOI:10.1021/ie060085y.
- H. Benguergoura and S. Moulay, J. Appl. Polym. Sci., 2012, 123, 1455–1467, DOI:10.1002/app.34105.
- J. M. Yeh, M. Y. Yu and S. Liou, J. Appl. Polym. Sci., 2003, 89, 3632–3638, DOI:10.1002/app.12615.
- U. S. j. Rao, K. Sreenivasulu, Y. Maruthi, P. K. Babu, G. N. M. C. S. Subha and K. C. Rao, International Journal of Scientific and Research Publications, 2016, 6, 101–111 Search PubMed , http://www.ijsrp.org/research-paper-0616/ijsrp-p5416.pdf.
- A. Allel, M. W. Naceur, H. Benguergoura and T. Aouak, Adv. Sci., Eng. Med., 2019, 11, 444–447, DOI:10.1166/asem.2019.2374.
- T. Jose, S. C. George and S. Thomas, Polym. Eng. Sci., 2018, 58, 849–858, DOI:10.1002/pen.24637.
- P. Meng, C. Chen, L. Yu, J. Li and W. Jiang, Tsinghua Sci. Technol., 2000, 5, 172–175 CAS , https://ieeexplore.ieee.org/abstract/document/6083276.
- A. R. Bahramian and M. Kokabi, J. Hazard. Mater., 2009, 166, 445–454, DOI:10.1016/j.jhazmat.2008.11.061.
- G. Yang, Z. Xie, M. Cran, D. Ng and S. Gray, J. Membr. Sci., 2019, 579, 40–51, DOI:10.1016/j.memsci.2019.02.034.
- M. Pramanik, S. K. Srivastava, B. K. Samantaray and A. K. Bhowmick, J. Appl. Polym. Sci., 2003, 87, 2216–2220, DOI:10.1002/app.11475.
- A. A. Sapalidis, F. K. Katsaros and N. K. Kanellopoulos, PVA/montmorillonite nanocomposites: development and properties, Nanocompos. Polym. Anal. Methods, 2011, 29–50 CAS.
- O. Bouras, Proprietes Adsorbantes D'Argiles Pontees Organophiles: Synthese et Caractérisation, PhD thesis, Université de Limoges, France, 31 Janvier 2003.
- H. Khalaf, O. Bouras and V. Perrichon, Microporous Mater., 1997, 8, 141–150, DOI:10.1016/S0927-6513(96)00079-X.
- Z. Ping, Q. Nguyen, R. Clement and J. Neel, J. Membr. Sci., 1990, 48, 297–308, DOI:10.1016/0376-7388(90)85011-9.
- T. Jose, S. C. George, H. J. Maria, R. Wilson and S. Thomas, Ind. Eng. Chem. Res., 2014, 53, 16820–16831, DOI:10.1021/ie502632p.
- T. Jose and S. C. George, Polym.-Plast. Technol. Eng., 2016, 55, 1266–1281, DOI:10.1080/03602559.2015.1132454.
- A. Karimi and W. M. A. Wan Daud, Polym. Compos., 2017, 38, 1086–1102 CrossRef CAS.
- Y. Abou El-Reash, A. Abdelghany and A. Abd Elrazak, Int. J. Biol. Macromol., 2016, 86, 789–798, DOI:10.1016/j.ijbiomac.2016.01.101.
- R. Huang and J. Rhim, Polym. Int., 1993, 30, 129–135, DOI:10.1002/pi.4990300119.
- J. Gaume, C. Taviot-Gueho, S. Cros, A. Rivaton, S. Therias and J.-L. Gardette, Sol. Energy Mater. Sol. Cells, 2012, 99, 240–249, DOI:10.1016/j.solmat.2011.12.005.
- R. Ricciardi, F. Auriemma, C. De Rosa and F. Lauprêtre, Macromolecules, 2004, 37, 1921–1927, DOI:10.1021/ma035663q.
- H. S. Mansur and A. A. Mansur, Mater. Res. Soc. Symp. Proc., 2005, 873, K1.9.1–K1.9.6, DOI:10.1557/PROC-873-K1.9.
- A. Muhammed, M. El-Hashash, M. Mekewi, D. Guirguis, R. Ramadan and M. Hassanien, Hydrol.: Curr. Res., 2012, 3, 131 CAS.
- E. Fathi, N. Atyabi, M. Imani and Z. Alinejad, Carbohydr. Polym., 2011, 84, 145–152, DOI:10.1016/j.carbpol.2010.11.018.
- L. Li and Y.-L. Hsieh, Nanotechnology, 2005, 16, 2852 CrossRef CAS.
- J. H. Choi, J. Jegal, W. N. Kim and H. S. Choi, Polym. Sci., 2009, 111, 2186–2193, DOI:10.1002/app.29222.
- A. Kittur, M. Kariduraganavar, U. Toti, K. Ramesh and T. Aminabhavi, J. Appl. Polym. Sci., 2003, 90, 2441–2448, DOI:10.1002/app.12930.
- D. A. Savin, J. Pyun, G. D. Patterson, T. Kowalewski and K. J. Matyjaszewski, J. Polym. Sci., Part B: Polym. Phys., 2002, 40, 2667–2676, DOI:10.1002/polb.10329.
- A. K. Sonker, K. Rathore, R. K. Nagarale and V. Verma, J. Polym. Environ., 2018, 26, 1782–1794, DOI:10.1007/s10924-017-1077-3.
- A. A. Sapalidis, F. K. Katsaros and N. K. Kanellopoulos, Nanocomposites and polymers with analytical methods, 2011, pp. 29-50 Search PubMed.
- M. Asrofi, D. Dwilaksana, H. Abral and R. Fajrul, Mater. Sci. Res. India, 2019, 16, 70–75, DOI:10.13005/msri/160110.
- S. Ravindra, V. Rajinikanth, A. F. Mulaba-Bafubiandi and V. S. Vallabhapurapu, Desalin. Water Treat., 2016, 57, 4920–4934, DOI:10.1080/19443994.2014.999131.
- S. K. Choudhari and M. Y. Kariduraganavar, Interface Sci., 2009, 338, 111–120, DOI:10.1016/j.jcis.2009.05.071.
- G. D. Saravacos and Z. B. Maroulis, Transport properties of foods, CRC Press, 2001 Search PubMed.
- B. V. Di Carlo and A. C. Habert, J. Mater. Sci., 2013, 48, 1457–1464, DOI:10.1007/s10853-012-6899-8.
- Q. G. Zhang, Q. L. Liu, Z. Y. Jiang and Y. Chen, J. Membr. Sci., 2007, 287, 237–245, DOI:10.1016/j.memsci.2006.10.041.
- B.-B. Li, Z.-L. Xu, F. A. Qusay and R. Li, Desalination, 2006, 193, 171–181, DOI:10.1016/j.desal.2005.08.021.
- Z. Huang, H.-m. Guan, W. lee Tan, X.-Y. Qiao and S. J. Kulprathipanja, J. Membr. Sci., 2006, 276, 260–271, DOI:10.1016/j.memsci.2005.09.056.
- Y. M. Wei, Z. L. Xu, F. A. Qusay and K. J. Wu, J. Appl. Polym. Sci., 2005, 98, 247–254, DOI:10.1002/app.22131.
- V. Dubey, L. K. Pandey and C. J. Saxena, J. Membr. Sci., 2005, 251, 131–136, DOI:10.1016/j.memsci.2004.11.009.
- T. Uragami, K. Okazaki, H. Matsugi and T. Miyata, Macromolecules, 2002, 35, 9156–9163, DOI:10.1021/ma020850u.
- K. H. Lee, H. K. Kim and J. W. Rhim, J. Appl. Polym. Sci., 1995, 58, 1707–1712, DOI:10.1002/app.1995.070581007.
- R. Binning, R. Lee, J. Jennings and E. Martin, Ind. Eng. Chem., 1961, 53, 45–50, DOI:10.1021/ie50613a030.
|
| This journal is © The Royal Society of Chemistry 2020 |
Click here to see how this site uses Cookies. View our privacy policy here.  Open Access Article
 a,
Hassiba Benguergoura
 b,
Alain Ledouxc,
Waseem Sharaf Saeed
 d,
Abdel-Basit Al-Odayni
 d and
Taïeb Aouak*d
![[thin space (1/6-em)]](https://www.rsc.org/images/entities/char_2009.gif) 000 g mol−1 and 97.5–99.5% degree of hydrolysis was purchased from FLUKA (Switzerland). A sodium montmorillonite (Na+MMT) mineral, which was purified from a natural bentonite powder (98% montmorillonite) from Maghnia (Western Algeria), was provided by ENOF (Entreprise Nationale des Substances Utiles et des Produits Non-ferreux) and has the chemical formula (Si8)IV(Al4−xMgx)VIO20(OH)4. The chemical composition of the Algerian montmorillonite used is showed in Table 1. It had a cation exchange capacity of 89 meq g−1 and was synthesized based on the previous report.12 Crosslinking agent, maleic acid (99%) (MA), was purchased from Acros Organics (New Jersey, USA). The catalyst agent, hydrochloric acid (HCl) (37 vol%), was received from AnalaR NORMAPUR (France). Ethanol (analytical reagent grade) was provided by Fisher Scientific.
000 g mol−1 and 97.5–99.5% degree of hydrolysis was purchased from FLUKA (Switzerland). A sodium montmorillonite (Na+MMT) mineral, which was purified from a natural bentonite powder (98% montmorillonite) from Maghnia (Western Algeria), was provided by ENOF (Entreprise Nationale des Substances Utiles et des Produits Non-ferreux) and has the chemical formula (Si8)IV(Al4−xMgx)VIO20(OH)4. The chemical composition of the Algerian montmorillonite used is showed in Table 1. It had a cation exchange capacity of 89 meq g−1 and was synthesized based on the previous report.12 Crosslinking agent, maleic acid (99%) (MA), was purchased from Acros Organics (New Jersey, USA). The catalyst agent, hydrochloric acid (HCl) (37 vol%), was received from AnalaR NORMAPUR (France). Ethanol (analytical reagent grade) was provided by Fisher Scientific.
![[thin space (1/6-em)]](https://www.rsc.org/images/entities/char_2009.gif) :
:![[thin space (1/6-em)]](https://www.rsc.org/images/entities/char_2009.gif) wt%)
wt%)![[thin space (1/6-em)]](https://www.rsc.org/images/entities/char_2009.gif) :
:![[thin space (1/6-em)]](https://www.rsc.org/images/entities/char_2009.gif) 100
100![[thin space (1/6-em)]](https://www.rsc.org/images/entities/char_2009.gif) :
:![[thin space (1/6-em)]](https://www.rsc.org/images/entities/char_2009.gif) 99
99![[thin space (1/6-em)]](https://www.rsc.org/images/entities/char_2009.gif) :
:![[thin space (1/6-em)]](https://www.rsc.org/images/entities/char_2009.gif) 95
95![[thin space (1/6-em)]](https://www.rsc.org/images/entities/char_2009.gif) :
:![[thin space (1/6-em)]](https://www.rsc.org/images/entities/char_2009.gif) 90
90![[thin space (1/6-em)]](https://www.rsc.org/images/entities/char_2009.gif) :
:![[thin space (1/6-em)]](https://www.rsc.org/images/entities/char_2009.gif) 85
85![[thin space (1/6-em)]](https://www.rsc.org/images/entities/char_2009.gif) :
:![[thin space (1/6-em)]](https://www.rsc.org/images/entities/char_2009.gif) 80
80


![[double bond, length as m-dash]](https://www.rsc.org/images/entities/char_e001.gif) CH– stretching owing to reaction of PVA with MA, which results in the formation of an unsaturated ester owing to the intermolecular or intramolecular crosslinking of the chains. Such a structure has also been revealed by Huang et al. and Y. Abou El-Reash et al. in separate studies using similar reactions.18,19
CH– stretching owing to reaction of PVA with MA, which results in the formation of an unsaturated ester owing to the intermolecular or intramolecular crosslinking of the chains. Such a structure has also been revealed by Huang et al. and Y. Abou El-Reash et al. in separate studies using similar reactions.18,19


![[thin space (1/6-em)]](https://www.rsc.org/images/entities/char_2009.gif) :
:![[thin space (1/6-em)]](https://www.rsc.org/images/entities/char_2009.gif) 96 water/ethanol mixture at room temperature as a function of time.
96 water/ethanol mixture at room temperature as a function of time.


