DOI:
10.1039/D0RA07042D
(Paper)
RSC Adv., 2020,
10, 40005-40018
An organic–inorganic hybrid nanomaterial composed of a Dowson-type (NH4)6P2Mo18O62 heteropolyanion and a metal–organic framework: synthesis, characterization, and application as an effective adsorbent for the removal of organic dyes†
Received
15th August 2020
, Accepted 18th October 2020
First published on 2nd November 2020
Abstract
In this work, an inorganic–organic hybrid nanomaterial, P2Mo18/MIL-101(Cr), based on Wells–Dawson-type (NH4)6P2Mo18O62 polyoxometalate (abbreviated as P2Mo18) and the MIL-101(Cr) metal–organic framework was fabricated by the reaction of (NH4)6P2Mo18O62, Cr(NO3)3·9H2O and terephthalic acid under hydrothermal conditions. The as-prepared recyclable nanohybrid was fully characterized using X-ray diffraction (XRD), Fourier-transform infrared spectroscopy (FT-IR) equipped with energy dispersive X-ray microanalysis (EDX), field emission scanning electron microscopy (FE-SEM), Raman spectroscopy and Brunauer–Emmett–Teller (BET) specific surface area studies. All the analyses confirmed the successful insertion of P2Mo18O626− heteropolyanion within the cavities of MIL-101(Cr). The encapsulated MIL-101(Cr) showed a considerable decrease in both pore volume and surface area compared with MIL-101(Cr) due to incorporation of the very large Dowson-type polyoxometalate into the three-dimensional porous MIL-101(Cr). The nanohybrid had a specific surface area of 800.42 m2 g−1. The adsorption efficiency of this nanohybrid for removal of methylene blue (MB), rhodamine B (RhB), and methyl orange (MO) from aqueous solutions was evaluated. Surprisingly, the composite not only presented a high adsorption capacity of 312.5 mg g−1 for MB, but also has the ability to rapidly remove 100% MB from a dye solution of 50 mg L−1 within 3 min. These results confirmed that this adsorbent is applicable in a wide pH range of 2–10. The nanohybrid showed rapid and selective adsorption for cationic MB and RhB dyes from MB/MO, MB/RhB, MO/RhB and MB/MO/RhB mixed dye solutions. The equilibrium adsorption data were better fitted by the Langmuir isotherm. Kinetics data indicate that the adsorption of the dye follows a pseudo-second order kinetics model. Also, this material could be effortlessly separated and recycled without any structural modification. Accordingly, it is an efficient adsorbent for removing cationic dyes.
1. Introduction
Pollution of water with organic compounds is a challenging environmental issue in many countries.1,2 Predominantly, organic dyes are comprehensively used in the industries of silk, cosmetics, cotton, linen, wool, plastics, textiles and leather, printing paper, etc.3–6 The removal of these pollutants from contaminated aqueous solutions is of great importance in environmental processes.7 At present, different treatment technologies, including biological methods, chemical oxidation, ion exchange, organic treatment, adsorption, membrane technologies and photocatalytic or sonocatalytic degradation, are being created and utilized in the expulsion of dyes.8–13 Among the existing elimination procedures, adsorption methods are the most practical for deletion of pigments and organic dyes from aquatic media on a large scale with a suitable choice of adsorbent, as these approaches can yield high-quality water using economically viable processes.14 Many forms of materials are employed as adsorbents for water decontamination, such as zeolites, clays, activated carbons, graphene oxide and polymeric materials. On the other hand, some of these materials are only effective for wastewater with low concentrations of dye, and they normally show very poor performance in selectively removing targeted organic dyes. The goal is to discover an appropriate adsorption material which not only has the ability to reduce pollutant organic dyes with low loss and high efficiency, but also enables selective separation and recovery of raw materials.15,16
Polyoxometalates (POMs) are an exceptional family of metal oxide clusters with manageable shapes and sizes, rich redox reactions, high electronegativity, oxo-enriched surfaces, rich topologies and photoactivity; they have been used in many exploration fields, including biochemistry, chemical analysis, sensors, catalysis, ion-selective membranes, magnetism and proton exchange membranes.17 However, the submission of pure POMs as adsorbents or catalysts is imperfect because of their comparatively low surface areas (5–8 m2 g−1), the according seriously obstructed accessibility to their active sites, and their high dissolvability in water, which creates difficulty in detaching them from the reaction mixture.18 To overcome these problems, the immobilization of POMs on solid supports to build hybrid materials has been attempted. In this circumstance, materials such as titania, zirconia, activated carbon, silica, Fe2O3, graphene, Al2O3, UiO-66 and MOFs have been employed for synthesis of hybrid materials with POMs.8,19–22 In this work, to address these limitations, metal–organic frameworks (MOFs) have been considered for anchoring of POMs to form hybrid heterogeneous materials.
Metal–organic frameworks (MOFs) are coordination polymers which are self-assembled from polydentate organic ligands and transition metal cations; they are attracting growing attention in the fields of gas separation and storage, catalysis, luminescence, elimination and adsorption of organic pollutants due to their crystalline natures, ultrahigh porosities, ultrahigh surface areas and tunable pore sizes.23–32 Among the MOFs that are known to date, MIL-101 is a well-recognized robust MOF that possesses two hydrophilic zeotypic cavities with pore sizes of 29 Å and 34 Å and an exceedingly high specific surface area (SBET ≈ 4000 m2 g−1). Principally, due to the fundamentally greater porosities and extraordinarily large BET surface areas of MOFs, they have become attractive host matrices for the encapsulation of POMs.33,34 Therefore, MIL-101(Cr) can be used as a reference MOF for investigating various guest–host interactions for aqueous organic pollutant removal. In the last two decades, a chain of hybrid materials constructed with the MIL-101 MOF and various POMs have been described and studied in various application fields, such as organic reactions, electrocatalytic reactions, photocatalytic reactions and dye adsorption.35,36
In this work, the P2Mo18/MIL-101(Cr) nanohybrid was fabricated for the first time by a hydrothermal technique. This POM/MOF inorganic–organic nanohybrid material was fully characterized. The adsorption of RhB, MO, and MB organic dyes by P2Mo18/MIL-101(Cr) and the effects of contact time, adsorbent dosage, pH, initial dye concentration and solution on the adsorption trend were investigated. As additional features, the isotherms and kinetics of the adsorption of MB onto the compound were studied. Also, the recyclability and stability of the nanohybrid were carefully explored. The fabricated hybrid nanomaterial revealed selective adsorption abilities with superior adsorption rates for MB and RhB cationic dyes compared to the MIL-101 framework alone.
2. Experimental
2.1. Materials
Terephthalic acid (H2BDC, 98%), chromium(III) nitrate (Cr(NO3)3·9H2O, 99%), sodium tungstate (Na2MoO4·2H2O, 99%), phosphoric acid (H3PO4, 85%), hydrochloric acid (HCl, 35%), ammonium chloride (NH4Cl, 99%), methanol and ethanol were obtained from Merck, as were the organic dyes methylene blue (MB), rhodamine B (RhB) and methyl orange (MO), which were of the highest available purity.
2.2. Fabrication of (NH4)6P2Mo18O62 (P2Mo18)
(NH4)6P2Mo18O62 was prepared according to a literature method with some modifications.37 Briefly, a mixture of Na2MoO4·2H2O (85.12 g), concentrated H3PO4 (15 mL) and HCl (80 mL) in distilled water (450 mL) was refluxed for 8 h. After cooling, 100 g NH4Cl was added. A green precipitate was perceived instantly after the addition of ammonium chloride. The resulting suspension was maintained overnight at 5 °C in order to enhance the precipitation. The product was filtered through a Buchner funnel and re-dissolved in an equal weight of distilled water. This solution was filtered to separate dissolved impurities. To obtain a perfectly clear solution, solid NH4Cl was added to make a 20 wt% solution. After 8 h, the crystals were filtered and re-dissolved in the minimum amount of distilled water. The resulting solution was vaporized in a rotary evaporator (40 °C) under low pressure. Finally, the precipitate was filtered off and washed with anhydrous diethyl ether and ethanol.
2.3. Fabrication of the P2Mo18/MIL-101(Cr) adsorbent
In a distinctive one-pot fabrication, deionized water (30 mL) with a mixture of Cr (NO3)3·9H2O (2.0 g, 5 m mol), H2BDC (0.83 g, 5 m mol), and (NH4)6P2Mo18O62 (2.0 g, 0.7 m mol) was dispersed under 10 min of sonicating. The mixture was moved to a 50 mL Teflon-lined autoclave and heated at 200 °C for 24 h under hydrothermal conditions. Then, the mixture was gently cooled to room temperature. The resulting precipitate was filtered, washed with deionized water and ethanol, and dried at room temperature. The ICP-AES results indicated that the loading amount of P2Mo18 in the as-prepared P2Mo18/MIL-101(Cr) nanocomposite was estimated to be 36.85 wt%. For comparison, pure MIL-101(Cr) sample was also prepared under the same conditions without adding P2Mo18.
2.4. Characterization methods
FTIR spectra were obtained with a Shimadzu-8400S (Japan) spectrometer in the wavenumber range of 400–4000 cm−1; an X-ray diffractometer (Philips X-Pert 8440) with Cr Kα radiation (λ = 2.289 Å) was employed for X-ray diffraction (XRD) analysis of the powder samples. The shapes and morphologies of the samples were perceived by a MIRA3 TESCAN field emission scanning electron microscope (FESEM) armed with a link energy-dispersive X-ray (EDX) analyzer. BET measurements were performed to determine the specific surface areas and porosities of the samples with N2 adsorption measurements at 77 K using a BELSORP Mini instrument. The samples were degassed at 180 °C prior to the nitrogen adsorption measurements. An adsorption isotherm was considered to determine the pore size distribution by the Barrett–Joyner–Halenda (BJH) method. A Raman microscope (Senterra 2009, Germany) equipped with a laser wavelength of 758 nm was employed to obtain the Raman spectra. The adsorption mechanisms of the dyes were investigated at room temperature on a Varian Cary 100 spectrophotometer. The content of P2Mo18 in the nanocomposite was determined by inductively coupled plasma atomic emission spectroscopy (ICP-AES, model OEC-730).
2.5. Dye adsorption tests
To investigate the properties of the nanohybrid, adsorption experiments were executed in 100 mL glass pyramic bottles, and the adsorption reaction temperature was maintained at 25 °C. Freshly fabricated nanohybrid (30 mg) was placed in 50 mL of aqueous solutions of different colorants, including rhodamine B (RhB), methylene blue (MB) and methyl orange (MO), with initial concentration sof 50 mg L−1. At scheduled time intervals, a small portion (2 mL) of the solution was pipetted out and centrifuged at 5000 rpm for 5 min to separate the solid adsorbent portion. The residual amounts of dyes were determined at 664, 553 and 467 nm for MB, RhB and MO, respectively, with a spectrophotometer.
The effects of solution pH (2–10), adsorbent dosage (10, 20 and 30 mg), and initial MB concentration (50–200 mg L−1) on the adsorption performance of the as-prepared adsorbent were studied under similar conditions. Also, the nanohybrid was poured into mixtures of MO/RhB, RhB/MB, MO/MB (v/v 1/1, 50 mL, 50 mg L−1) and MB/RhB/MO (v/v 1/1/1, 50 mL, 50 mg L−1) to study the adsorption selectivity activity of the adsorbent.
The adsorption capacity (qe) (mg g−1) and elimination rate (R%) were calculated based on the following eqn (1) and (2):
| | |
qe = [(C0 − Ceq)/m] × V
| (1) |
| | |
R = [(C0 − Ct)/C0] × 100
| (2) |
where
C0 and
Ct (mg L
−1) are the initial dye concentration and the dye concentration at time (
t), respectively,
V is the volume of the dye solution (mL), and
m is the amount of adsorbent (mg).
3. Results and discussion
In this work, a nanohybrid material, P2Mo18/MIL-101(Cr), was prepared by the reaction of the ammonium salt of the Dowson-type polyoxomolybdate (NH4)6P2Mo18O62 (abbreviated as P2Mo18) with the MIL-101(Cr) MOF in aqueous solution under hydrothermal conditions at 200 °C for 24 h. During the formation of the MIL-101(Cr) framework, P2Mo18 polyanions could be trapped in the holes of the MOF, resulting in the P2Mo18/MIL-101(Cr) nanohybrid. From the ICP-AES results, the loading amount of P2Mo18 in the as-prepared P2Mo18/MIL-101(Cr) hybrid was estimated to be 36.85 wt%. The preparation process of this inorganic–organic hybrid nanomaterial is illustrated in Scheme 1. The structure and composition of the hybrid nanomaterial were further characterized by FT-IR, Raman spectroscopy, XRD, SEM, EDX, and BET surface area analyses.
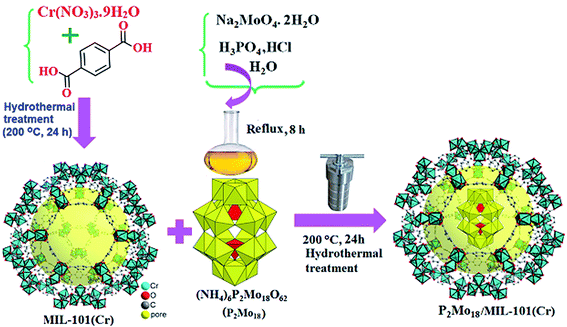 |
| | Scheme 1 The preparation process of the P2Mo18/MIL-101(Cr) inorganic–organic hybrid nanomaterial. | |
3.1. FT-IR analysis
To confirm the presence of P2Mo18 within the pores and the structure of MIL-101(Cr), the composite P2Mo18/MIL-101(Cr) was characterized by FT-IR spectroscopy. The FT-IR spectra of the P2Mo18, MIL-101(Cr) and P2Mo18/MIL-101(Cr) samples are shown in Fig. 1. As shown in Fig. 1(a), the characteristic bands of Dawson heteropolyanion are observed at 1076 (the stretching frequency of the P–O bonds of the PO4 units), 935 (Mo![[double bond, length as m-dash]](https://www.rsc.org/images/entities/char_e001.gif) O terminal bands), and 906 and 763 cm−1 (Mo–O–Mo “inter” and “intra” Mo–O–Mo bridges), respectively.38 Our salt also exhibited the infrared signal of the NH4+ species at 1400 cm−1.39 The FT-IR spectrum of MIL-101(Cr) in Fig. 1(b) shows two sharp peaks at 1600 and 1402 cm−1, which are allotted to asymmetric and symmetric vibrations of the carboxyl groups (O–C–O) in H2BDC, respectively, endorsing the presence of the dicarboxylate linker in the fabricated sample.40 The additional bands between 600 and 1600 cm−1 were attributed to benzene, including the stretching vibration (C
O terminal bands), and 906 and 763 cm−1 (Mo–O–Mo “inter” and “intra” Mo–O–Mo bridges), respectively.38 Our salt also exhibited the infrared signal of the NH4+ species at 1400 cm−1.39 The FT-IR spectrum of MIL-101(Cr) in Fig. 1(b) shows two sharp peaks at 1600 and 1402 cm−1, which are allotted to asymmetric and symmetric vibrations of the carboxyl groups (O–C–O) in H2BDC, respectively, endorsing the presence of the dicarboxylate linker in the fabricated sample.40 The additional bands between 600 and 1600 cm−1 were attributed to benzene, including the stretching vibration (C![[double bond, length as m-dash]](https://www.rsc.org/images/entities/char_e001.gif) C) at 1508 cm−1 and the deformation vibration (C–H) at 750 cm−1, whereas the peak detected at 578 cm−1 is associated with the symmetric stretching of Cr–O.41,42 After forming the P2Mo18O62/MIL-101(Cr) nanocomposite, as publicized in Fig. 1(c), the characteristic peaks related to MIL-101(Cr) and P2Mo18 slightly shifted. These shifts suggest an interaction between the P2Mo18 anion and MIL-101(Cr) MOF.
C) at 1508 cm−1 and the deformation vibration (C–H) at 750 cm−1, whereas the peak detected at 578 cm−1 is associated with the symmetric stretching of Cr–O.41,42 After forming the P2Mo18O62/MIL-101(Cr) nanocomposite, as publicized in Fig. 1(c), the characteristic peaks related to MIL-101(Cr) and P2Mo18 slightly shifted. These shifts suggest an interaction between the P2Mo18 anion and MIL-101(Cr) MOF.
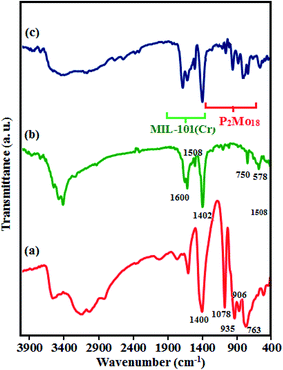 |
| | Fig. 1 The FT-IR spectra of (a) MIL-101(Cr), (b) P2Mo18, and (c) P2Mo18/MIL-101(Cr). | |
3.2. Raman spectroscopy
The presence of the Dawson-type polyoxomolybdate (P2Mo18) in the MIL-101(Cr) framework was further confirmed by the Raman spectrum of the fabricated nanohybrid in comparison with those of the compounds alone, as shown in Fig. 2(a–c). As can be perceived in Fig. 2, the Raman spectrum of the P2Mo18/MIL-101(Cr) nanocomposite shows the typical bands of the porous support material MIL-101 as well as, more or less, the vibrational modes of P2Mo18. In particular, the signals at 979 and 715 cm−1, accredited to the stretching mode of the terminal Mo–Od and to the Mo–O–Mo stretching mode, respectively, ae apparent in the spectrum of P2Mo18/MIL-101(Cr).42,43 The characteristic bands validate the existence of both P2Mo18 and MIL-101 in the P2Mo18/MIL-101(Cr) nanohybrid.
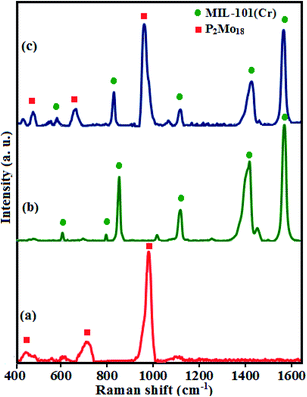 |
| | Fig. 2 FT-Raman spectra of (a) P2Mo18, (b) MIL-101(Cr) and (c) P2Mo18/MIL-101(Cr). | |
3.3. X-ray powder diffraction (XRD)
The crystal structures and phase compositions of the samples MIL-101(Cr), P2Mo18, and P2Mo18/MIL-101(Cr) were characterized by XRD, and the results are shown in Fig. 3(a–c). With respect to collected works, Fig. 3(a) evidently shows the normal characterization peaks of MIL-101(Cr) at 2θ 2.9°, 3.4°, 5.2°, 8.5°, 9°, and 12.3° at high intensity, which indicates the high crystallinity of the obtained MIL-101(Cr).44,45 As indicated in Fig. 3(c), all of the diffraction peaks corresponding to both P2Mo18 and MIL-101(Cr) and no other impurity peaks can be witnessed. Only the widths and diffraction peak intensities demonstrate some changes, confirming that the framework of the MOF did not change in the course of the encapsulation process of P2Mo18 into the cages of MIL-101(Cr).
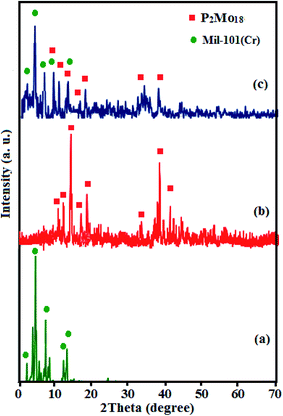 |
| | Fig. 3 XRD patterns of (a) MIL-101(Cr), (b) P2Mo18, and (c) P2Mo18/MIL-101(Cr). | |
3.4. SEM analysis
The morphology and size of the P2Mo18/MIL-101(Cr) nanohybrid were analyzed using FE-SEM observations, as shown in Fig. 4. In Fig. 4(a), the pure MIL-101(Cr) particles can be seen to possess a regular octahedral morphology with a rather narrow size distribution. The magnitudes of these octahedral crystals are in the sub-micrometer range (0.4–1.0 mm). The SEM photographs of the P2Mo18/MIL-101(Cr) composite in Fig. 4(b and c) validate that the shape and morphology of this sample are not the same as those of the pristine MIL-101(Cr). The SEM pictures of P2Mo18/MIL-101(Cr) do not demonstrate perfect polyhedral morphologies. Additionally, the Raman, XRD and FT-IR results testify that the framework of MIL-101(Cr) was not destroyed or broken down after incorporation of P2Mo18 phase, although its morphology changed.
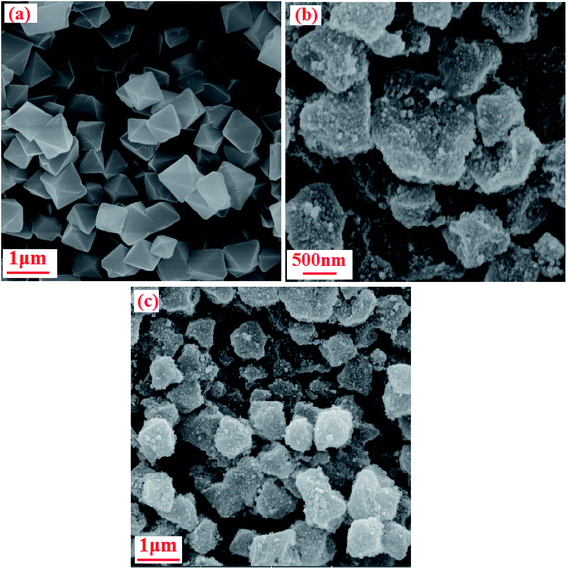 |
| | Fig. 4 FE-SEM images of (a) MIL-101(Cr) and (b and c) the P2Mo18/MIL-101(Cr) nanocomposite. | |
3.5. Energy dispersive spectroscopy (EDX)
Energy dispersive X-ray (EDX) analysis confirmed the composition of the as-fabricated nanohybrid. The presence of C, O, Cr, N, P and Mo elements in the P2Mo18/MIL-101(Cr) nanohybrid was confirmed by the EDX spectrum (Fig. 5). Fig. 5(a) displays a SEM image of the nanocomposite with the corresponding EDX elemental mappings. The elemental peaks attributed to C, O, Cr, N, P, and Mo in the existing EDX spectrum in Fig. 5(b) confirmed their presence in the P2Mo18/MIL-101(Cr) nanocomposite. It can be perceived in the maps that the C, O, Cr, N, P, and Mo elements are consistently distributed over the image, ratifying the homogeneity of the sample. The results of the EDX mappings confirm that the shape of the product was similar to that perceived using FE-SEM.
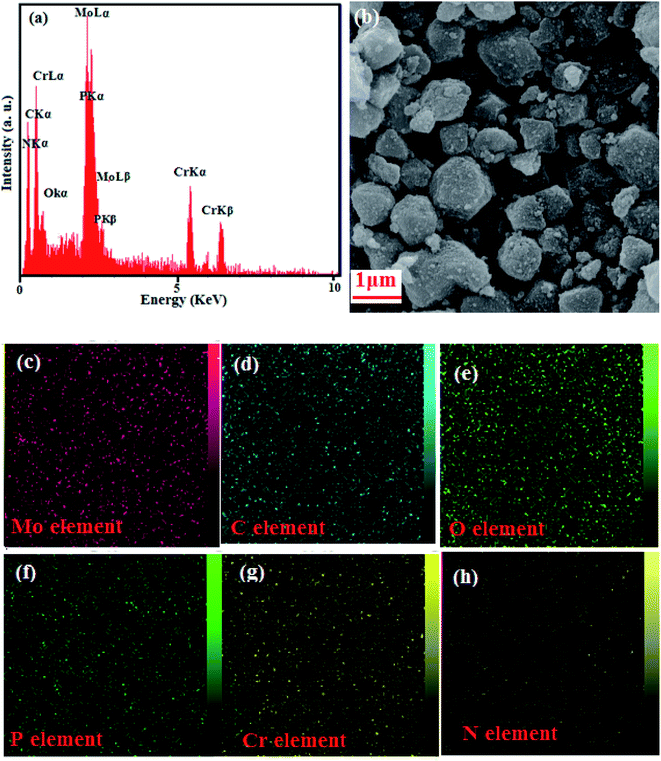 |
| | Fig. 5 (a) SEM spectrum and (b–h) representative EDX photographs of the P2Mo18/MIL-101(Cr) with corresponding EDX elemental mappings. | |
3.6. BET specific surface area analysis
N2 adsorption/desorption measurements were performed to determine the BET surface areas and the pore size distributions of the samples. The nitrogen adsorption–desorption isotherms of MIL-101(Cr) and the P2Mo18/MIL-101(Cr) samples are displayed in Fig. 6(a). They show type I isotherms with H4-type hysteresis loops, according to the IUPAC classification, which are characteristic of solids with microporous windows and mesoporous cages.46 Compared with the pristine MIL-101, significant decreases in the surface area, pore volume, and pore diameter of the encapsulated samples were observed owing to the insertion of POMs into the cavities of MIL-101, which occupied some of the pore space (Table 1). The Barrett–Joyner–Halenda (BJH) pore-size distributions in Fig. 6(b) also confirm that the average pore size of the composite is smaller than of MIL-101(Cr). Based on these results, the P2Mo18 polyanion was encapsulated inside the channels of MIL-101(Cr) more than on the outer surfaces.
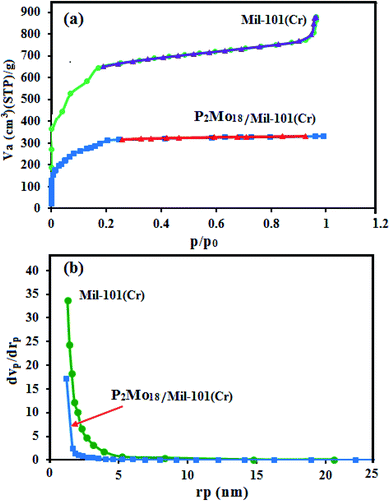 |
| | Fig. 6 (a) N2 adsorption–desorption isotherms and (b) BJH pore-size distribution plots for the MIL-101(Cr) and P2Mo18/MIL-101(Cr) samples. | |
Table 1 The texture parameters of MIL-101(Cr) and the P2Mo18/MIL-101(Cr) nanocomposite
| Entry |
Sample |
BET surface area (m2 g−1) |
Langmuir surface area (m2 g−1) |
Total pore volume (cm3 g−1) |
Average pore diameter (nm) |
| 1 |
MIL-101(Cr) |
2452.50 |
3279.50 |
0.532 |
1.30 |
| 2 |
P2Mo18/MIL-101(Cr) |
800.42 |
719.87 |
0.513 |
2.56 |
3.7. Adsorption properties
After successful innovative fabrication of the nanocomposite, its adsorptivity for removing colorants from polluted water was weighed through a typical procedure. Three organic dyes (MB, RhB and MO) with dissimilar sizes and charges were chosen for experimentation. The concentrations of MB, RhB and MO were considered from UV-Vis absorption studies by means of the Beer-Lambert law relation at maximum wavelengths (λmax) of 664, 553 and 463 nm, respectively. As shown in Fig. 7, the bands decreased deliberately with adsorption time according to the reduction of the colorant concentration. For MB, the adsorption efficiency was 100% in 3 min, and that of RhB was about 99% in 15 min; however, that of MO was almost negligible. Therefore, the exceptional adsorption properties of the P2Mo18/MIL-101(Cr) nanocomposite towards the cationic MB and RhB molecules were clearly demonstrated. The diverse effects on the removal of colorants can be linked to the structures of the dye molecules and of the nanocomposite as well. This is due to the presence of highly electronegative POM, which mostly enhanced the adsorption ability of the porous material MIL-101(Cr); together with the enormous numbers of negative charges, this may exert a stronger force on colorants with positive charges. The fabricated material in this study is not an efficient adsorbent for removal of MO because of the negative charges of both the adsorbent and dye molecules. As a consequence, neither electrostatic attraction nor adsorption occurs between the POM encapsulated into the nanocomposite and MO molecules.
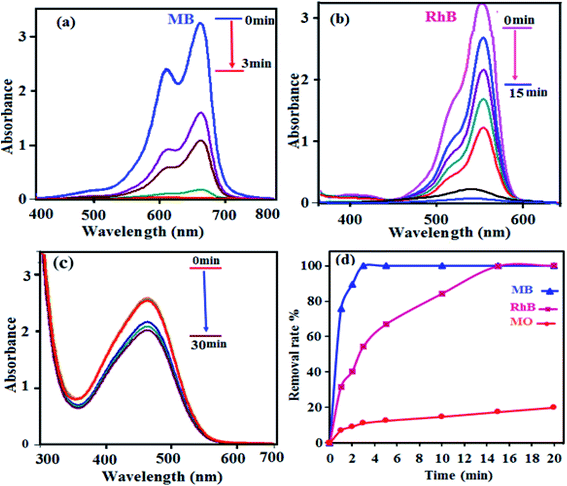 |
| | Fig. 7 The UV-Vis spectra during adsorption of dyes over P2Mo18/MIL-101(Cr): (a) MB, (b) RhB and (c) MO. (d) Comparison of the adsorption efficiencies of the dyes. Experimental conditions: C0(MB) = C0(RhB) = C0(MO) = 50 mg L−1, solution volume = 50 mL, adsorbent dosage = 30 mg, temperature = 25 °C and natural pH ≈ 6.5. | |
3.7.1. Selective dye adsorption. One of the most attractive and challenging complications in the process of dye–wastewater treatment is selective adsorption and separation of specific dyes. To achieve this target, different mixtures of dye solutions with various sizes and charges were chosen for investigation, bearing in mind that the size and charge of an organic dye are the two major factors controlling the adsorption process. This property was tested by preparing mixtures of MB + MO, MB + RhB and MO + RhB (50 mL, C0(MB) = C0(RhB) = C0(MO) = 50 mg L−1) with 30 mg of P2Mo18/MIL-101(Cr) as the absorbent, followed by monitoring the processes by UV-visible spectroscopy. Based on Fig. 8(a) and (b), the superior removal of the cationic MB and RhB from the MB + MO and RhB + MO mixtures can be attributed to the anionic nature of P2Mo18/MIL-101(Cr). A binary mixture of cationic dyes (MB + RhB) was selected; the results in Fig. 8(c) reveal that both dyes adsorbed completely but that the complete adsorption of RhB needs a longer time due to its larger volume. For better judgment, the results of a ternary mixture of MB, RhB and MO in Fig. 8(d) show that MB was also adsorbed entirely in the initial 1 min and that complete adsorption of RhB requires a longer time of 10 min because of its greater molecular volume; meanwhile, the characteristic absorption peaks of MO were retained. These results confirm that the P2Mo18/MIL-101(Cr) nanohybrid is a worthy nominee for selective adsorption and separation of cationic dyes.
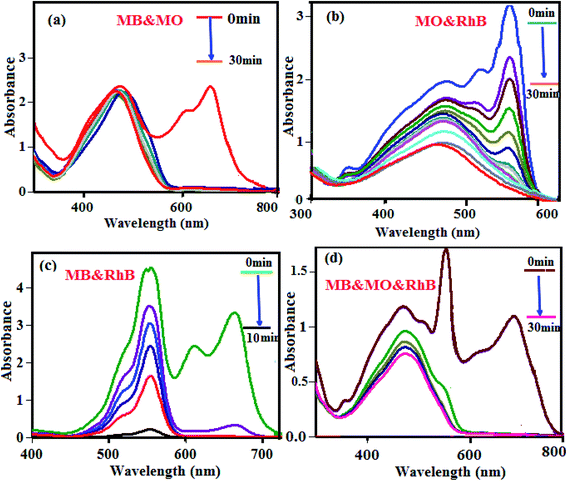 |
| | Fig. 8 The selective adsorption capacity of the P2Mo18/MIL-101(Cr) toward the mixed dyes of (a) MB + MO, (b) RhB + MO, (c) MB + RhB, and (d) MB + MO + RhB. Experimental conditions: C0(MB) = C0(RhB) = C0(MO) = 50 mg L−1, solution volume = 50 mL, adsorbent dosage = 30 mg, temperature = 25 °C and natural pH ≈ 6.5. | |
In Table 2, we also compare the above results for the removal of MB by the nanohybrid with some similar adsorbents in the literature. Accordingly, with respect to the adsorption time (which is shorter than that of most reported adsorbents), initial dye concentration and adsorption capacities, the current presented method is more advantageous, suitable and/or superior.
Table 2 Comparison of the adsorption capacities of various adsorbents for MB
| Adsorbent |
Adsorption capacity (mg g−1) |
CMB (mg L−1) |
Time |
Ref. |
| {Zn3(PCAP)2[CrMo6(OH)5O19](H2O)6}·6H2O |
18.83 |
10 |
30 min |
39 |
| H6P2W18O62/MOF-5 |
51.81 |
10 |
10 min |
47 |
| MIL-68(Al)@SBA-15 |
62.93 |
25 |
0.5 min |
48 |
| PV2Mo10/M (membrane) |
82 |
20 |
48 h |
49 |
| MOF-Cu-BTC |
15.28 |
3.19 |
6 h |
50 |
| LnCu–POMs |
391 |
20 |
1 min |
51 |
| H3PW12O40/MIL-101(Fe) |
473.7 |
100 |
5 min |
52 |
| P5W30/MIL-101(Cr) |
212 |
200 |
8 min |
53 |
| CuS@PANI/PW12 |
83.3 |
25 |
20 min |
54 |
| Fe3O4@AMCA-MIL53(Al) |
325 |
25 |
240 min |
55 |
| Activated lignin–chitosan |
34.70 |
82 |
200 min |
56 |
| P2Mo18/MIL-101(Cr) |
312 |
200 |
30 min |
This work |
3.7.2. Influence of adsorbent dose. For the purpose of wastewater purification, determining a suitable adsorbent dosage is very important. The effects of the P2Mo18/MIL-101(Cr) dosage on the exclusion of MB were investigated with different adsorbent amounts of P2Mo18/MIL-101(Cr) (10.0, 20.0, and 30.0 mg) in 50 mL of dye solutions (50 mg L−1 at pH 6) (Fig. 9(a)). Accordingly, due to the more available vacant surface sites during the early stage of the process, the MB adsorption rises but is followed by a drop until a state of equilibrium is reached after 3 min for all samples. The removal percentages of MB for 10, 20 and 30 mg of adsorbent were calculated to be 45%, 91% and 100%, respectively, in 3 min. Finally, the optimized adsorbent dosage was found to be 30 mg.
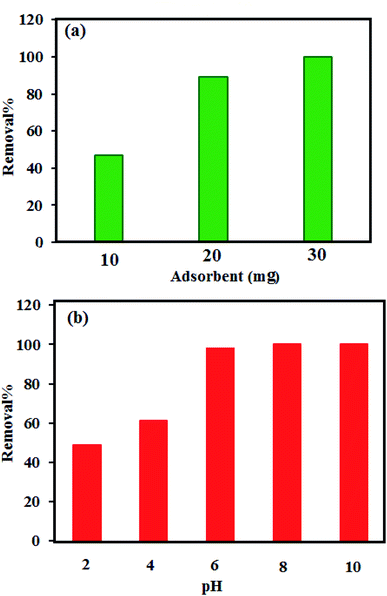 |
| | Fig. 9 (a) Effects of P2Mo18/MIL-101(Cr) dosage and (b) effects of initial pH on the removal efficiency of MB. Experimental conditions: C0(MB) = 50 mg L−1, solution volume = 50 mL and temperature = 25 °C at a fixed adsorption time of 3 min. | |
3.7.3. Influence of initial pH. The adsorption removal capacity depends on the surface properties of the adsorbent and the structure of the adsorbate, which are greatly affected by pH. The measurements of the zeta potential and influence of the pH solution value on the adsorption of MB were investigated, and the results are illustrated in Fig. 9(b). At natural pH, the zeta potential measured for the P2Mo18/MIL-101(Cr) adsorbent is about −24.02 mV (see Fig. S1†). This value indicates that the P2Mo18/MIL-101(Cr) surface is negatively charged. The MB removal efficiency increases with increasing pH value from 2 to 10. At low pH, while the less negative surface of P2Mo18/MIL-101(Cr) does not favor the adsorption process as a result of the electrostatic repulsion, a substantial amount of dye adsorption onto P2Mo18/MIL-101(Cr) still takes place at low pH values, suggesting that π–π stacking interactions and/or hydrophobic interactions occur between MB and P2Mo18/MIL-101(Cr).47 At high pH values, the presence of high concentrations of OH− ions increases the negative charge on the P2Mo18/MIL-101(Cr) surface by deprotonating the positively charged sites. The negative charge value was sharply enhanced when the initial solution pH was increased from 2 to 10. At pH values ≥ 6, the surface of the adsorbent is negatively charged, which favors electrostatic interaction of cationic species of dye with the negatively charged surface. The electrostatic attraction force of MB with P2Mo18/MIL-101(Cr) is likely to be greater at greater pH values.57,58
3.7.4. Adsorption kinetics and adsorption isotherm. To adsorb dyes onto P2Mo18/MIL-101(Cr) at different dye concentration amounts (50, 80, 100, 120, 150, 170 and 200 mg L−1), linear plots of t/qt versus t are indicated in Fig. 10. As shown in Fig. 10(a), the quantity of MB adsorbed onto P2Mo18/MIL-101(Cr) increased swiftly with increasing adsorption time for the first 3 min, then slowed and finally reached an equilibrium point after about 20 min. It can be seen that the MB adsorption capacity of the P2Mo18/MIL-101(Cr) at equilibrium was enhanced from 100 to 312.5 mg g−1 by increasing the initial dye concentration from 50 to 200 mg L−1.
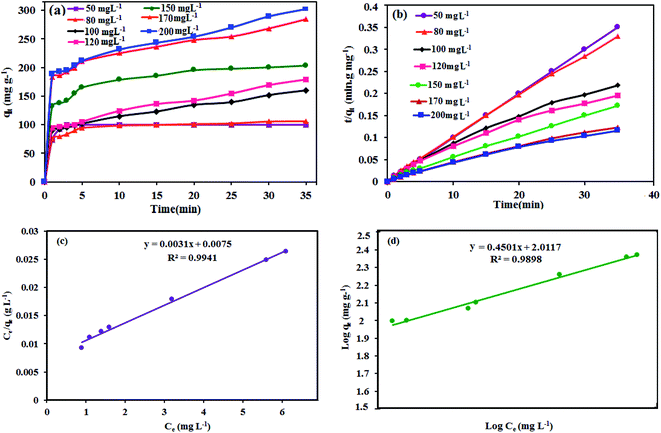 |
| | Fig. 10 (a) The effect of the initial dye concentration, (b) pseudo-second-order kinetics, (c) Langmuir and (d) Freundlich isotherms for the adsorption of MB onto the P2Mo18/MIL-101(Cr) nanocomposite. Experimental conditions: solution volume = 50 mL, adsorbent dosage = 30 mg and temperature = 25 °C. | |
In order to investigate the detailed characteristics of the adsorption behavior of P2Mo18/MIL-101(Cr), a pseudo-second-order kinetics model was applied. The pseudo-second-order kinetic equation is expressed as follows:59
where
k2 is the rate constant of the pseudo-second-order model (g mg
−1 min
−1), and
qe and
qt (mg g
−1) are the amounts of the dye adsorbed at equilibrium and at various times
t (min), respectively. The values of
qe (cal) and
k2 were estimated from the slope and intercept of the linear isotherm of
t/
qt vs. t, as shown in
Fig. 10(b). The results are summarized in
Table 3. Evidently, the correlation coefficients (
R2) are above 0.999, showing that the adsorption process can be fitted to the pseudo-second-order model. Furthermore, the values of
qe (exp) (mg g
−1) are lower than the calculated
qe (cal) (mg g
−1) according to the pseudo-second-order equation. All of these results prove that the adsorption capacity can be correlated with the variation of the surface area and porosity of the adsorbent. As evidenced, a greater surface area and pore volume will afford a higher adsorption capacity.
Table 3 Adsorption kinetic parameters for the adsorption of MB onto P2Mo18/MIL-101(Cr)
| Initial concentration of MB (mg L−1) |
Pseudo-second-order kinetics |
| qe,exp (mg g−1) |
k2 (g mg−1 min−1) |
qe,cal (mg g−1) |
R2 |
| 50 |
100 |
11.1 |
100 |
0.999 |
| 80 |
102 |
1.52 |
106.38 |
0.999 |
| 100 |
140 |
0.47 |
158.73 |
0.984 |
| 120 |
154 |
0.39 |
178.5 |
0.972 |
| 150 |
200 |
0.96 |
208 |
0.998 |
| 170 |
269 |
0.72 |
277.1 |
0.992 |
| 200 |
272 |
0.6 |
294 |
0.989 |
Isotherm models of adsorption available in the literature, such as the Langmuir60,61 and Freundlich62,63 models, were engaged to explore the relationship between the amount of adsorbed dye (qe) and the concentration of dye in the solution (Ce) when both are at equilibrium. The Langmuir equation can be expressed as eqn (4):
| | |
Ce/qe = 1/kLqm + Ce/qm
| (4) |
where
Ce (mg L
−1) is the MB concentration at equilibrium,
kL is the Langmuir adsorption constant,
qe is the amount of dye adsorbed per gram of adsorbent (mg g
−1) at equilibrium concentration and
qm (mg g
−1) is the high adsorption capacity. The Langmuir isotherm displays that the amount of dye adsorbed grows as the concentration increases to a saturation point. As long as adsorption sites exist, the adsorption will increase with growing dye concentration; however, after the sites are occupied, any further increase in the concentration of dye will not lead to an increased amount of dye on the adsorbent (
Fig. 10(c)). The dimensionless separation factor,
RL, is a critical characteristic of the Langmuir isotherm to describe the favorability of adsorption on an adsorbent, which is defined by the following
eqn (5):
64where
C0 (mg L
−1) is the initial concentration of the adsorbate MB. The value of
RL indicates that the isotherm is irreversible (
RL = 0), favorable (0 <
RL < 1), linear (
RL = 1) or unfavorable (
RL > 1 or
RL < 0). In the present study, the calculated value of
RL for the initial concentrations of MB was 0.014, which illustrates that the process of MB adsorption onto the P
2Mo
18/MIL-101(Cr) nanohybrid was favorable. The Freundlich isotherm exhibits multilayer adsorption onto the heterogeneous surface of the adsorbent based on the linear equation displayed below:
| |
log![[thin space (1/6-em)]](https://www.rsc.org/images/entities/char_2009.gif) qe = 1/n qe = 1/n![[thin space (1/6-em)]](https://www.rsc.org/images/entities/char_2009.gif) log log![[thin space (1/6-em)]](https://www.rsc.org/images/entities/char_2009.gif) Ce + log Ce + log![[thin space (1/6-em)]](https://www.rsc.org/images/entities/char_2009.gif) KF KF
| (6) |
where
KF (L g
−1) and 1/
n are the Freundlich characteristic constants, which show the adsorption capacity and intensity, respectively. The intercept and slope of a linear plot of ln
![[thin space (1/6-em)]](https://www.rsc.org/images/entities/char_2009.gif) qe versus
qe versus ln
![[thin space (1/6-em)]](https://www.rsc.org/images/entities/char_2009.gif) Ce
Ce give the values of
KF and 1/
n. The slope and intercept of the linear plot of log
![[thin space (1/6-em)]](https://www.rsc.org/images/entities/char_2009.gif) qe versus
qe versus log
![[thin space (1/6-em)]](https://www.rsc.org/images/entities/char_2009.gif) Ce
Ce can be used to estimate the values of 1/
n and
KF (
Fig. 10(d)). The values of
R2 in
Table 3 are better fitted to the Langmuir model than to the Freundlich model.
3.7.5. Adsorption mechanism. The mechanism of adsorption of dye molecules by an adsorbent in aqueous solution can be affected by various influences, such as the surface properties of the composite, its textural properties, and the types of interactions occurring between the adsorbent and the dye molecules, such as hydrogen bonding, electrostatic attractions, π–π stacking and ion exchange. The adsorption sites play an important role in enhancing the adsorption capacity. Even though extra comprehensive effort is indispensable to clearly realize the mechanism of dye adsorption on P2Mo18/MIL-101(Cr), it can be simply clarified in terms of electrostatic interactions between MB and the adsorbent. The adsorption efficiency of the MIL-101(Cr) sample, despite its higher surface area, was lower than that of the P2Mo18/MIL-101(Cr) nanohybrid (see Table 1). This confirms that other factors influence the adsorption efficiency in addition to the specific surface area of the adsorbent. After introducing the P2Mo18 polyanions into the cavities of MIL-101(Cr), it was confirmed that the adsorption capacity of the nanocomposite changed greatly compared with that of MIL-101(Cr). This is because of the rapid and effective adsorption of cationic MB and RhB dyes by P2Mo18 polyanions, whereas it is unfavorable for P2Mo18/MIL-101(Cr) to adsorb the anionic dye MO, as shown in Fig. 7 and 8. The attained outcomes for the selective adsorption of cationic dyes in the presence of anionic MO dye undoubtedly suggest that the adsorption of MB dye on the P2Mo18/MIL-101(Cr) nanocomposite is linked to the electrostatic interaction between the cationic dye molecules and the P2Mo18 polyanions with high negative charge (6−). These findings indicate that the P2Mo18 polyoxoanion clusters encapsulated in the mesoporous cages of MIL-101(Cr) act as the active sites for the adsorption of cationic dye molecules.The zeta potential of a material is another key factor influencing its adsorption capacity; therefore, this was tested to understand further why the P2Mo18/MIL-101(Cr) sample can remove the cationic dyes MB and RhB more effectively than the anionic MO dye. As shown in Fig. S1,† the zeta potentials of the MIL-101(Cr) and P2Mo18/MIL-101(Cr) samples were measured as +16.75 and −24.02 mV, respectively, in water at natural pH. This finding illustrates that the higher efficiency of the removal of cationic dyes can be mainly attributed to the electrostatic attraction interactions between the adsorbent and the cationic dye. After modification with P2Mo18, the obtained P2Mo18/MIL-101(Cr) showed a more negative zeta potential than pristine MIL-101(Cr); thus, it is capable of adsorbing more of the cationic dyes MB and RhB, whereas it is unfavorable for P2Mo18/MIL-101(Cr) to adsorb the anionic dye MO. The simplified mechanism of MB adsorption is illustrated in Fig. 11.
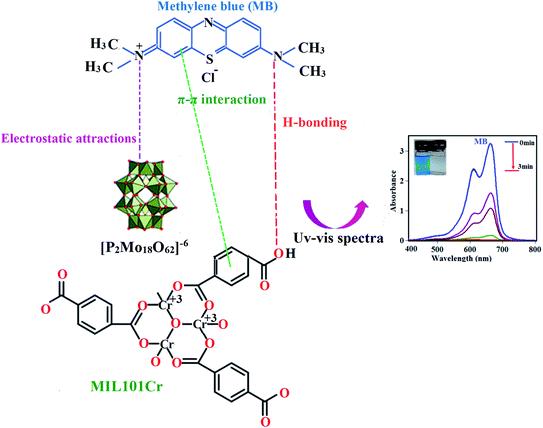 |
| | Fig. 11 Proposed mechanism for the adsorption of cationic MB dye using the P2Mo18/MIL-101(Cr) nanohybrid. | |
3.8. Stability and recyclability
The adsorption of MB onto the P2Mo18/MIL-101(Cr) nanohybrid was confirmed using various techniques. Fig. S2† shows the FT-IR spectra of MB dye and the P2Mo18/MIL-101(Cr) nanohybrid before and after the adsorption of MB dye (abbreviated as MB@P2Mo18/MIL-101(Cr)). The presence of the characteristic peaks of MB molecule at 1598 cm−1 (C![[double bond, length as m-dash]](https://www.rsc.org/images/entities/char_e001.gif) C aromatic), 1390 cm−1 (C
C aromatic), 1390 cm−1 (C![[double bond, length as m-dash]](https://www.rsc.org/images/entities/char_e001.gif) N aromatic) and 1334 cm−1 (C–N) confirmed the adsorption of MB dye into the P2Mo18/MIL-101(Cr) hybrid. Furthermore, these bands were not seen in the spectrum of the P2Mo18/MIL-101(Cr) nanohybrid. In addition, the EDX spectrum and elemental mappings of MB@P2Mo18/MIL-101(Cr) in Fig. S3 and S4† revealed the existence of N, Cl and S elements and their homogeneous distributions in the adsorbent. This finding further indicates that the MB molecules were successfully adsorbed on the surface of the P2Mo18/MIL-101(Cr) nanohybrid. Micrographs of MB@P2Mo18/MIL-101(Cr) are shown in Fig. S5.† It can be observed that the recovered adsorbent almost retained its initial size and morphology. As shown in Fig. S6,† the XRD pattern of MB@P2Mo18/MIL-101(Cr) showed no change in comparison with the pattern of the fresh nanohybrid in Fig. 3(c). The N2 gas adsorption–desorption isotherms and pore size distributions of MB@P2Mo18/MIL-101(Cr) are shown in Fig. S7a and b.† Compared with P2Mo18/MIL-101(Cr) (see Fig. 6 and Table 1), MB@P2Mo18/MIL-101(Cr) demonstrated a significant decrease in both pore volume (from 0.513 to 0.018 cm3 g−1) and surface area (800.42 to 182.18 m2 g−1), confirming the insertion of large MB molecules into the pores of P2Mo18/MIL-101(Cr) and occupation of the main part of the pore space.
N aromatic) and 1334 cm−1 (C–N) confirmed the adsorption of MB dye into the P2Mo18/MIL-101(Cr) hybrid. Furthermore, these bands were not seen in the spectrum of the P2Mo18/MIL-101(Cr) nanohybrid. In addition, the EDX spectrum and elemental mappings of MB@P2Mo18/MIL-101(Cr) in Fig. S3 and S4† revealed the existence of N, Cl and S elements and their homogeneous distributions in the adsorbent. This finding further indicates that the MB molecules were successfully adsorbed on the surface of the P2Mo18/MIL-101(Cr) nanohybrid. Micrographs of MB@P2Mo18/MIL-101(Cr) are shown in Fig. S5.† It can be observed that the recovered adsorbent almost retained its initial size and morphology. As shown in Fig. S6,† the XRD pattern of MB@P2Mo18/MIL-101(Cr) showed no change in comparison with the pattern of the fresh nanohybrid in Fig. 3(c). The N2 gas adsorption–desorption isotherms and pore size distributions of MB@P2Mo18/MIL-101(Cr) are shown in Fig. S7a and b.† Compared with P2Mo18/MIL-101(Cr) (see Fig. 6 and Table 1), MB@P2Mo18/MIL-101(Cr) demonstrated a significant decrease in both pore volume (from 0.513 to 0.018 cm3 g−1) and surface area (800.42 to 182.18 m2 g−1), confirming the insertion of large MB molecules into the pores of P2Mo18/MIL-101(Cr) and occupation of the main part of the pore space.
The reusability of an adsorbent is a vital aspect of its practical application based on economic considerations in wastewater treatment efficiency. This nanohybrid was effortlessly separated after the adsorption process by simple centrifugation due to its insolubility in water. The adsorbed MB was removed from P2Mo18/MIL-101 by washing several times with 1![[thin space (1/6-em)]](https://www.rsc.org/images/entities/char_2009.gif) :
:![[thin space (1/6-em)]](https://www.rsc.org/images/entities/char_2009.gif) 1 water and ethanol solution; then, the P2Mo18/MIL-101 was reused for a new adsorption experiment. The recycling adsorption efficiency was disclosed in Fig. 12(a). An adsorption efficiency of 94% was achieved after six cycles. The nature of the recovered nanohybrid after desorbing MB dye was also tested. As shown in Fig. 12(b–e), the FT-IR, XRD, FT-Raman and SEM analyses of the recovered P2Mo18/MIL-101(Cr) adsorbent did not show significant changes in comparison with the fresh adsorbent. The above results further confirmed that the adsorption process did not affect the structure and properties of the adsorbent. At the end, these findings confirm that the adsorbent can effectively remove cationic dyes from aqueous solution with reusability and high separation efficiency.
1 water and ethanol solution; then, the P2Mo18/MIL-101 was reused for a new adsorption experiment. The recycling adsorption efficiency was disclosed in Fig. 12(a). An adsorption efficiency of 94% was achieved after six cycles. The nature of the recovered nanohybrid after desorbing MB dye was also tested. As shown in Fig. 12(b–e), the FT-IR, XRD, FT-Raman and SEM analyses of the recovered P2Mo18/MIL-101(Cr) adsorbent did not show significant changes in comparison with the fresh adsorbent. The above results further confirmed that the adsorption process did not affect the structure and properties of the adsorbent. At the end, these findings confirm that the adsorbent can effectively remove cationic dyes from aqueous solution with reusability and high separation efficiency.
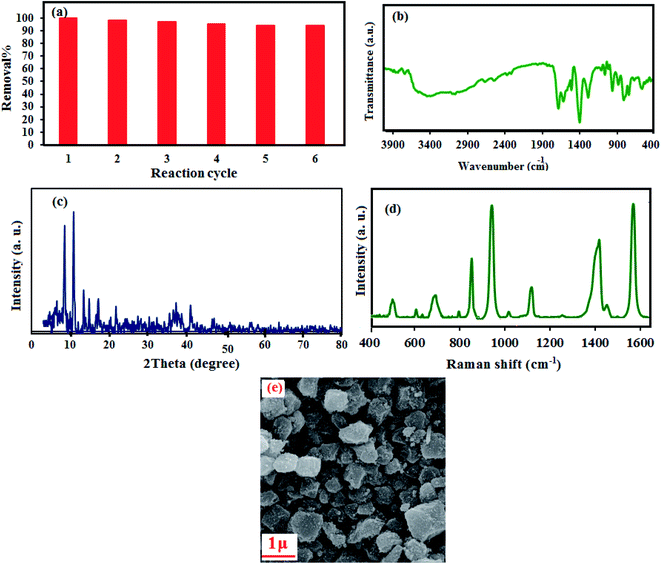 |
| | Fig. 12 (a) Recyclability of the P2Mo18/MIL-101(Cr) nanocomposite, (b) FT-IR, (c) XRD, (d) FT-Raman and (e) SEM images of the recovered P2Mo18/MIL-101(Cr) nanohybrid after the sixth run. | |
4. Conclusions
P2Mo18/MIL-101(Cr) nanocomposites with a high BET specific surface area of 800.42 m2 g−1 were successfully prepared by a simple one-pot hydrothermal procedure. The results obtained from XRD, FT-IR, FT-Raman, FE-SEM, and EDS techniques confirmed the successful incorporation of the P2Mo18 in the MIL-101(Cr) framework. The results revealed that the adsorption process followed a pseudo-second-order kinetic model as well as the Langmuir isotherm model. Also, the hybrid nanomaterial could easily be separated from aqueous solution after adsorption experiments and recycled several times without any loss in its adsorption ability. Therefore, P2Mo18/MIL-101(Cr) can be applied as a promising adsorbent for the treatment of dye effluents.
Conflicts of interest
There are no conflicts of interest to declare.
Acknowledgements
The authors gratefully acknowledge the Lorestan University Research Council for the financial support.
References
- F. Siadatnasab, S. Farhadi, M. Dusek, V. Eigner, A.-A. Hoseini and A. Khataee, Ultrason. Sonochem., 2019, 64, 104727 CrossRef.
- V. Katheresan, J. Kansedo and S. Y. Lau, J. Environ. Chem. Eng., 2018, 6, 4676–4697 CrossRef CAS.
- A.-A. Hoseini, S. Farhadi, A. Zabardasti and F. Siadatnasab, RSC Adv., 2019, 9, 24489–24504 RSC.
- S. Farhadi, F. Siadatnasab and A. Khataee, Ultrason. Sonochem., 2017, 37, 298–309 CrossRef CAS.
- A. Hamedi, M. B. Zarandi and M. R. Nateghi, J. Environ. Chem. Eng., 2019, 7, 102882 CrossRef CAS.
- S. Farhadi and F. Siadatnasab, J. Mol. Struct., 2016, 1123, 171–179 CrossRef CAS.
- Y. Wang, L. Zhu, X. Wang, W. Zheng, C. Hao, C. Jiang and J. Wu, J. Ind. Eng. Chem., 2018, 61, 321–330 CrossRef CAS.
- J. M. Lim, J. Park, J. T. Park and S. Bae, J. Ind. Eng. Chem., 2019, 71, 378–386 CrossRef CAS.
- C. H. Nguyen and R.-S. Juang, J. Ind. Eng. Chem., 2019, 76, 296–309 CrossRef CAS.
- S. Farhadi and F. Siadatnasab, Mater. Res. Bull., 2016, 83, 345–353 CrossRef CAS.
- M. Naushad, G. Sharma and Z. A. Alothman, J. Clean. Prod., 2019, 241, 118263 CrossRef CAS.
- M. Naushad, A. A. Alqadami, Z. A. Alothman, I. H. Alsohaimi, M. S. Algamdi and A. M. Aldawsari, J. Mol. Liq., 2019, 293, 111442 CrossRef CAS.
- N. S. Shah, J. A. Khan, M. Sayed, Z. U. H. Khan, J. Iqbal, S. Arshad, M. Junaid and H. M. Khan, Sep. Purif. Technol., 2020, 233, 115966 CrossRef CAS.
- S. Guo, K. Wu, Y. Gao, L. Liu, X. Zhu, X. Li and F. Zhang, J. Chem. Eng. Data, 2018, 63, 3902–3912 CrossRef CAS.
- J. Shu, R. Liu, H. Wu, Z. Liu, X. Sun and C. Tao, J. Taiwan Inst. Chem. Eng., 2018, 82, 351–359 CrossRef CAS.
- S. Farhadi and F. Siadatnasab, Desalin. Water Treat., 2017, 66, 299–308 CrossRef CAS.
- J. C. Ye, J. J. Chen, R. M. Yuan, D. R. Deng, M. S. Zheng, L. Cronin and Q. F. Dong, J. Am. Chem. Soc., 2018, 140, 3134–3138 CrossRef CAS.
- R.-Z. Zhang, S. Quan, M. Xia, Q. Wang, W. Zhang and J.-M. Yang, J. Colloid Interface Sci., 2018, 525, 54–61 CrossRef CAS.
- J.-M. Yang, R.-J. Ying, C.-X. Han, Q.-T. Hu, H.-M. Xu, J.-H. Li, Q. Wang and W. Zhang, Dalton Trans., 2018, 47, 3913–3920 RSC.
- A. Hayashi, M. N. K. Wihadi, H. Ota, X. López, K. Ichihashi, S. Nishihara, K. Inoue, N. Tsunoji, T. Sano and M. Sadakane, ACS omega, 2018, 3, 2363–2373 CrossRef CAS.
- J. Zhang, J. Luo, P. Wang, B. Ding, Y. Huang, Z. Zhao, J. Zhang and Y. Wei, Inorg. Chem., 2015, 54, 2551–2559 CrossRef CAS.
- S. Farhadi, M. Dusek, F. Siadatnasab and V. Eigner, Polyhedron, 2017, 126, 227–238 CrossRef CAS.
- Y.-R. Chen, K.-H. Liou, D.-Y. Kang, J.-J. Chen and L.-C. Lin, Langmuir, 2018, 34, 4180–4187 CrossRef CAS.
- Y.-Z. Chen, R. Zhang, L. Jiao and H.-L. Jiang, Coord. Chem. Rev., 2018, 362, 1–23 CrossRef CAS.
- P. D. Du, H. T. M. Thanh, T. C. To, H. S. Thang, M. X. Tinh, T. N. Tuyen, T. T. Hoa and D. Q. Khieu, J. Nanomater., 2019, 2019 Search PubMed.
- C. Chen, L. Wang, B. Zhu, Z. Zhou, S. I. El-Hout, J. Yang and J. Zhang, J. Energy Chem., 2020, 54, 528–554 CrossRef.
- Y.-T. Liao, B. M. Matsagar and K. C.-W. Wu, ACS Sustain. Chem. Eng., 2018, 6, 13628–13643 CrossRef CAS.
- H. Konnerth, B. M. Matsagar, S. S. Chen, M. H. Prechtl, F.-K. Shieh and K. C.-W. Wu, Coord. Chem. Rev., 2020, 416, 213319 CrossRef CAS.
- C.-C. Chueh, C.-I. Chen, Y.-A. Su, H. Konnerth, Y.-J. Gu, C.-W. Kung and K. C.-W. Wu, J. Mater. Chem., 2019, 7, 17079–17095 RSC.
- C. C. Lee, C. I. Chen, Y. T. Liao, K. C. W. Wu and C. C. Chueh, Adv. Sci., 2019, 6, 1970030 CrossRef.
- Y. V. Kaneti, S. Dutta, M. S. Hossain, M. J. Shiddiky, K. L. Tung, F. K. Shieh, C. K. Tsung, K. C. W. Wu and Y. Yamauchi, Adv. Mater., 2017, 29, 1700213 CrossRef.
- G. Gumilar, Y. V. Kaneti, J. Henzie, S. Chatterjee, J. Na, B. Yuliarto, N. Nugraha, A. Patah, A. Bhaumik and Y. Yamauchi, Chem. Sci., 2020, 11, 3644–3655 RSC.
- C. Gecgel, U. B. Simsek, B. Gozmen and M. Turabik, J. Iran. Chem. Soc., 2019, 16, 1735–1748 CrossRef CAS.
- Q. Wu, M. Niu, X. Chen, L. Tan, C. Fu, X. Ren, J. Ren, L. Li, K. Xu and H. Zhong, Biomaterials, 2018, 162, 132–143 CrossRef CAS.
- Y. Zhang, F. Wang, C. Liu, Z. Wang, L. Kang, Y. Huang, K. Dong, J. Ren and X. Qu, ACS Nano, 2018, 12, 651–661 CrossRef CAS.
- J. Kou and L.-B. Sun, ACS Appl. Mater. Interfaces, 2018, 10, 12051–12059 CrossRef CAS.
- E. Arendt, S. Zehri, P. Eloy and E. M. Gaigneaux, Eur. J. Inorg. Chem., 2012, 2012, 2792–2801 CrossRef CAS.
- B. Hong, L. Liu, S.-M. Wang and Z.-B. Han, J. Clust. Sci., 2016, 27, 563–571 CrossRef CAS.
- G. Marci, E. I. Garcia-Lopez, F. R. Pomilla, L. F. Liotta and L. Palmisano, Appl. Catal. A: Gen., 2016, 528, 113–122 CrossRef CAS.
- F. Jing, R. Liang, J. Xiong, R. Chen, S. Zhang, Y. Li and L. Wu, Appl. Catal. B: Environ., 2017, 206, 9–15 CrossRef CAS.
- J.-H. Li, X.-L. Wang, G. Song, H.-Y. Lin, X. Wang and G.-C. Liu, Dalton Trans., 2020, 49, 1265–1275 RSC.
- Z. M. Zhang, S. Yao, Y. G. Li, X. B. Han, Z. M. Su, Z. S. Wang and E. B. Wang, Chem.–Eur. J., 2012, 18, 9184–9188 CrossRef CAS.
- L. M. Martínez Tejada, A. Muñoz, M. Centeno and J. A. Odriozola, J. Raman Spectrosc., 2016, 47, 189–197 CrossRef.
- H. Chen, S. Chen, X. Yuan and Y. Zhang, Mater. Lett., 2013, 100, 230–232 CrossRef CAS.
- X.-J. Dui, W.-B. Yang, X.-Y. Wu, X. Kuang, J.-Z. Liao, R. Yu and C.-Z. Lu, Dalton Trans., 2015, 44, 9496–9505 RSC.
- E. Amdeha and R. S. Mohamed, Environ. Technol., 2019, 1–18 CrossRef.
- X. Liu, W. Gong, J. Luo, C. Zou, Y. Yang and S. Yang, Appl. Surf. Sci., 2016, 362, 517–524 CrossRef CAS.
- F. Mahmoudi and M. M. Amini, J. Water Process. Eng., 2020, 35, 101227 CrossRef.
- L. Yao, L. Zhang, R. Wang, S. Chou and Z. Dong, J. Hazard.Mater., 2016, 301, 462–470 CrossRef CAS.
- S. Lin, Z. Song, G. Che, A. Ren, P. Li, C. Liu and J. Zhang, Micropor. Mesopor. Mater., 2014, 193, 27–34 CrossRef CAS.
- F.-Y. Yi, W. Zhu, S. Dang, J.-P. Li, D. Wu, Y.-h. Li and Z.-M. Sun, Chem. Commun., 2015, 51, 3336–3339 RSC.
- T.-T. Zhu, Z.-M. Zhang, W.-L. Chen, Z.-J. Liu and E.-B. Wang, RSC Adv., 2016, 6, 81622–81630 RSC.
- A. A. Hoseini, S. Farhadi and A. Zabardasti, Appl. Organomet. Chem., 2019, 33, e4656 Search PubMed.
- F. Siadatnasab, K. Karami and A. Khataee, J. Ind. Eng. Chem., 2019, 80, 205–216 CrossRef CAS.
- A. A. Alqadami, M. Naushad, Z. Alothman and T. Ahamad, J. Environ. Manag., 2018, 223, 29–36 CrossRef CAS.
- A. B. Albadarin, M. N. Collins, M. Naushad, S. Shirazian, G. Walker and C. Mangwandi, Chem. Eng. J., 2017, 307, 264–272 CrossRef CAS.
- Y. Shao, L. Zhou, C. Bao, J. Ma, M. Liu and F. Wang, Chem. Eng., 2016, 283, 1127–1136 CrossRef CAS.
- T. Wang, P. Zhao, N. Lu, H. Chen, C. Zhang and X. Hou, Chem. Eng., 2016, 295, 403–413 CrossRef CAS.
- V. V. Kumar, S. Sivanesan and H. Cabana, Sci. Total Environ., 2014, 487, 830–839 CrossRef CAS.
- Z. Jiang and Y. Li, Taiwan Inst. Chem. Eng., 2016, 59, 373–379 CrossRef CAS.
- S. Aslam, J. Zeng, F. Subhan, M. Li, F. Lyu, Y. Li and Z. Yan, J. Colloid Interface Sci., 2017, 505, 186–195 CrossRef CAS.
- S. Ahmadi, L. Mohammadi, A. Rahdar, S. Rahdar, R. Dehghani, C. A. Igwegbe and G. Z. Kyzas, Nanomaterials, 2020, 10, 556 CrossRef CAS.
- D. P. Dutta and S. Nath, J. Mol. Liq., 2018, 269, 140–151 CrossRef CAS.
- C. Jiao, Y. Wang, M. Li, Q. Wu, C. Wang and Z. Wang, J. Magn. Magn. Mater., 2016, 407, 24–30 CrossRef CAS.
Footnote |
| † Electronic supplementary information (ESI) available. See DOI: 10.1039/d0ra07042d |
|
| This journal is © The Royal Society of Chemistry 2020 |
Click here to see how this site uses Cookies. View our privacy policy here.  Open Access Article
 *,
Abedin Zabardasti
 and
Firouzeh Siadatnasab
![[double bond, length as m-dash]](https://www.rsc.org/images/entities/char_e001.gif) O terminal bands), and 906 and 763 cm−1 (Mo–O–Mo “inter” and “intra” Mo–O–Mo bridges), respectively.38 Our salt also exhibited the infrared signal of the NH4+ species at 1400 cm−1.39 The FT-IR spectrum of MIL-101(Cr) in Fig. 1(b) shows two sharp peaks at 1600 and 1402 cm−1, which are allotted to asymmetric and symmetric vibrations of the carboxyl groups (O–C–O) in H2BDC, respectively, endorsing the presence of the dicarboxylate linker in the fabricated sample.40 The additional bands between 600 and 1600 cm−1 were attributed to benzene, including the stretching vibration (C
O terminal bands), and 906 and 763 cm−1 (Mo–O–Mo “inter” and “intra” Mo–O–Mo bridges), respectively.38 Our salt also exhibited the infrared signal of the NH4+ species at 1400 cm−1.39 The FT-IR spectrum of MIL-101(Cr) in Fig. 1(b) shows two sharp peaks at 1600 and 1402 cm−1, which are allotted to asymmetric and symmetric vibrations of the carboxyl groups (O–C–O) in H2BDC, respectively, endorsing the presence of the dicarboxylate linker in the fabricated sample.40 The additional bands between 600 and 1600 cm−1 were attributed to benzene, including the stretching vibration (C![[double bond, length as m-dash]](https://www.rsc.org/images/entities/char_e001.gif) C) at 1508 cm−1 and the deformation vibration (C–H) at 750 cm−1, whereas the peak detected at 578 cm−1 is associated with the symmetric stretching of Cr–O.41,42 After forming the P2Mo18O62/MIL-101(Cr) nanocomposite, as publicized in Fig. 1(c), the characteristic peaks related to MIL-101(Cr) and P2Mo18 slightly shifted. These shifts suggest an interaction between the P2Mo18 anion and MIL-101(Cr) MOF.
C) at 1508 cm−1 and the deformation vibration (C–H) at 750 cm−1, whereas the peak detected at 578 cm−1 is associated with the symmetric stretching of Cr–O.41,42 After forming the P2Mo18O62/MIL-101(Cr) nanocomposite, as publicized in Fig. 1(c), the characteristic peaks related to MIL-101(Cr) and P2Mo18 slightly shifted. These shifts suggest an interaction between the P2Mo18 anion and MIL-101(Cr) MOF.


![[thin space (1/6-em)]](https://www.rsc.org/images/entities/char_2009.gif) qe = 1/n
qe = 1/n![[thin space (1/6-em)]](https://www.rsc.org/images/entities/char_2009.gif) log
log![[thin space (1/6-em)]](https://www.rsc.org/images/entities/char_2009.gif) Ce + log
Ce + log![[thin space (1/6-em)]](https://www.rsc.org/images/entities/char_2009.gif) KF
KF
![[thin space (1/6-em)]](https://www.rsc.org/images/entities/char_2009.gif) qe versus ln
qe versus ln![[thin space (1/6-em)]](https://www.rsc.org/images/entities/char_2009.gif) Ce give the values of KF and 1/n. The slope and intercept of the linear plot of log
Ce give the values of KF and 1/n. The slope and intercept of the linear plot of log![[thin space (1/6-em)]](https://www.rsc.org/images/entities/char_2009.gif) qe versus log
qe versus log![[thin space (1/6-em)]](https://www.rsc.org/images/entities/char_2009.gif) Ce can be used to estimate the values of 1/n and KF (Fig. 10(d)). The values of R2 in Table 3 are better fitted to the Langmuir model than to the Freundlich model.
Ce can be used to estimate the values of 1/n and KF (Fig. 10(d)). The values of R2 in Table 3 are better fitted to the Langmuir model than to the Freundlich model.
![[double bond, length as m-dash]](https://www.rsc.org/images/entities/char_e001.gif) C aromatic), 1390 cm−1 (C
C aromatic), 1390 cm−1 (C![[double bond, length as m-dash]](https://www.rsc.org/images/entities/char_e001.gif) N aromatic) and 1334 cm−1 (C–N) confirmed the adsorption of MB dye into the P2Mo18/MIL-101(Cr) hybrid. Furthermore, these bands were not seen in the spectrum of the P2Mo18/MIL-101(Cr) nanohybrid. In addition, the EDX spectrum and elemental mappings of MB@P2Mo18/MIL-101(Cr) in Fig. S3 and S4† revealed the existence of N, Cl and S elements and their homogeneous distributions in the adsorbent. This finding further indicates that the MB molecules were successfully adsorbed on the surface of the P2Mo18/MIL-101(Cr) nanohybrid. Micrographs of MB@P2Mo18/MIL-101(Cr) are shown in Fig. S5.† It can be observed that the recovered adsorbent almost retained its initial size and morphology. As shown in Fig. S6,† the XRD pattern of MB@P2Mo18/MIL-101(Cr) showed no change in comparison with the pattern of the fresh nanohybrid in Fig. 3(c). The N2 gas adsorption–desorption isotherms and pore size distributions of MB@P2Mo18/MIL-101(Cr) are shown in Fig. S7a and b.† Compared with P2Mo18/MIL-101(Cr) (see Fig. 6 and Table 1), MB@P2Mo18/MIL-101(Cr) demonstrated a significant decrease in both pore volume (from 0.513 to 0.018 cm3 g−1) and surface area (800.42 to 182.18 m2 g−1), confirming the insertion of large MB molecules into the pores of P2Mo18/MIL-101(Cr) and occupation of the main part of the pore space.
N aromatic) and 1334 cm−1 (C–N) confirmed the adsorption of MB dye into the P2Mo18/MIL-101(Cr) hybrid. Furthermore, these bands were not seen in the spectrum of the P2Mo18/MIL-101(Cr) nanohybrid. In addition, the EDX spectrum and elemental mappings of MB@P2Mo18/MIL-101(Cr) in Fig. S3 and S4† revealed the existence of N, Cl and S elements and their homogeneous distributions in the adsorbent. This finding further indicates that the MB molecules were successfully adsorbed on the surface of the P2Mo18/MIL-101(Cr) nanohybrid. Micrographs of MB@P2Mo18/MIL-101(Cr) are shown in Fig. S5.† It can be observed that the recovered adsorbent almost retained its initial size and morphology. As shown in Fig. S6,† the XRD pattern of MB@P2Mo18/MIL-101(Cr) showed no change in comparison with the pattern of the fresh nanohybrid in Fig. 3(c). The N2 gas adsorption–desorption isotherms and pore size distributions of MB@P2Mo18/MIL-101(Cr) are shown in Fig. S7a and b.† Compared with P2Mo18/MIL-101(Cr) (see Fig. 6 and Table 1), MB@P2Mo18/MIL-101(Cr) demonstrated a significant decrease in both pore volume (from 0.513 to 0.018 cm3 g−1) and surface area (800.42 to 182.18 m2 g−1), confirming the insertion of large MB molecules into the pores of P2Mo18/MIL-101(Cr) and occupation of the main part of the pore space.
![[thin space (1/6-em)]](https://www.rsc.org/images/entities/char_2009.gif) :
:![[thin space (1/6-em)]](https://www.rsc.org/images/entities/char_2009.gif) 1 water and ethanol solution; then, the P2Mo18/MIL-101 was reused for a new adsorption experiment. The recycling adsorption efficiency was disclosed in Fig. 12(a). An adsorption efficiency of 94% was achieved after six cycles. The nature of the recovered nanohybrid after desorbing MB dye was also tested. As shown in Fig. 12(b–e), the FT-IR, XRD, FT-Raman and SEM analyses of the recovered P2Mo18/MIL-101(Cr) adsorbent did not show significant changes in comparison with the fresh adsorbent. The above results further confirmed that the adsorption process did not affect the structure and properties of the adsorbent. At the end, these findings confirm that the adsorbent can effectively remove cationic dyes from aqueous solution with reusability and high separation efficiency.
1 water and ethanol solution; then, the P2Mo18/MIL-101 was reused for a new adsorption experiment. The recycling adsorption efficiency was disclosed in Fig. 12(a). An adsorption efficiency of 94% was achieved after six cycles. The nature of the recovered nanohybrid after desorbing MB dye was also tested. As shown in Fig. 12(b–e), the FT-IR, XRD, FT-Raman and SEM analyses of the recovered P2Mo18/MIL-101(Cr) adsorbent did not show significant changes in comparison with the fresh adsorbent. The above results further confirmed that the adsorption process did not affect the structure and properties of the adsorbent. At the end, these findings confirm that the adsorbent can effectively remove cationic dyes from aqueous solution with reusability and high separation efficiency.


