
 Open Access Article
 This Open Access Article is licensed under a Creative Commons Attribution-Non Commercial 3.0 Unported Licence
Phase controlled one-pot synthesis of heterostructured FePt–Fe3O4 nanocubes with excellent biocompatibility†
Yunji Eom,
Yumin Kang,
Satish Kasturi,
Sri Ramulu Torati* and
CheolGi Kim *
*
Department of Emerging Materials Science, DGIST, Daegu, 42988, Republic of Korea. E-mail: srtorati@dgist.ac.kr; cgkim@dgist.ac.kr; Fax: +82-53-785-6509; Tel: +82-53-785-6516
First published on 9th December 2020
Abstract
We demonstrated a simple one-pot synthesis approach for the controlled composition of homogeneous FePt and phase-controlled heterostructured FePt/Fe3O4 nanocubes (NCs) utilizing 1,2-hexadecanediol and 1-octadecene as the reducing agents, respectively. When the Fe![[thin space (1/6-em)]](https://www.rsc.org/images/entities/char_2009.gif) :Pt precursor ratio was varied from 1:1 to 4:1 and 1,2-hexadecanediol was utilized as the reducing agent, homogeneous FePt NCs were formed, whereas the heterostructures of FePt/Fe3O4 NCs were obtained when utilizing 1-octadecene as the reducing agent at Fe:Pt ratio of 4:1. The initial domination of nucleation of Pt-rich species and the subsequent deposition of Fe atoms leads to the formation of homogeneous FePt NCs. Heterostructured FePt/Fe3O4 NCs were obtained by the initial FePt seed formation, which was then followed by the heterogeneous growth of Fe3O4. The heterostructured FePt/Fe3O4 NCs exhibited two phases, i.e., FePt phase with a (111) facet of the fcc and Fe3O4 phase with an inverse cubic spinel structure. Moreover, both the FePt and the FePt/Fe3O4 NCs demonstrated almost negligible coercivity, which confirmed a typical superparamagnetic behavior. Furthermore, the cell viability tests of the FePt and FePt/Fe3O4 NCs demonstrated excellent biocompatibilities. Hence, the NCs could be useful for various biomedical applications, including MRI contrast agents, hyperthermia, and as a label in magnetic biochips.
:Pt precursor ratio was varied from 1:1 to 4:1 and 1,2-hexadecanediol was utilized as the reducing agent, homogeneous FePt NCs were formed, whereas the heterostructures of FePt/Fe3O4 NCs were obtained when utilizing 1-octadecene as the reducing agent at Fe:Pt ratio of 4:1. The initial domination of nucleation of Pt-rich species and the subsequent deposition of Fe atoms leads to the formation of homogeneous FePt NCs. Heterostructured FePt/Fe3O4 NCs were obtained by the initial FePt seed formation, which was then followed by the heterogeneous growth of Fe3O4. The heterostructured FePt/Fe3O4 NCs exhibited two phases, i.e., FePt phase with a (111) facet of the fcc and Fe3O4 phase with an inverse cubic spinel structure. Moreover, both the FePt and the FePt/Fe3O4 NCs demonstrated almost negligible coercivity, which confirmed a typical superparamagnetic behavior. Furthermore, the cell viability tests of the FePt and FePt/Fe3O4 NCs demonstrated excellent biocompatibilities. Hence, the NCs could be useful for various biomedical applications, including MRI contrast agents, hyperthermia, and as a label in magnetic biochips.
Introduction
Over the last few decades, there has been a growing research attention towards the various essential applications of magnetic nanoparticles (NPs), including catalysis, biological imaging, and bio-separations, immunodetection, high-density magnetic storage media, lab-on-a-chip device, and drug delivery system.1–8 More recently, there has been a growing interest in the development of hybrid architectural magnetic NPs, a combination of two or more materials for advanced applications.9–14 The hybrid NPs exhibit simultaneous multifunctional characteristics of each of the material's properties due to the combination of both materials in which the overlapping of the electronic bands of the adjacent material can even sometimes exhibit modified or unexpected excellent properties, which cannot be obtained by the individual material.15,16 Hence, it is a prerequisite to design the hybrid NPs as per their requirements for each field of application based on the individual properties of the single component of NPs. For example, the synthesized polymer/iron oxide magnetic nanomicelles were used for multifunctional applications such as heat and drug delivery, PbSe/iron oxide for semiconductor property and tunneling magnetoresistance, noble metal/iron oxide for plasmonic applications, and the bimagnetic FePt/Fe3O4 NPs for enhanced exchange coupling and energy products.17–20Among all of the hybrid magnetic NPs, the bimagnetic FePt/Fe3O4 NPs have been of considerable interest due to their flexibility in both the magnetic and biological applications. Herein, the FePt NPs are suitable for their potential use in CT/MRI with X-ray absorption as a dual imaging agent and in hyperthermia due to large magnetocrystalline anisotropy.21,22 Furthermore, Pt in FePt NPs has an advantage for binding biomolecules as like Au materials through a thiol linker that can be used for biological applications.23 Moreover, the Fe3O4 NPs are representative materials for the magnetic-based bio-applications, which have high magnetization, susceptibility, and chemical stability.24–27
Therefore, these bimagnetic FePt/Fe3O4 NPs have considerable potential, which is complementary between the low magnetization of FePt with good surface property and high magnetization of Fe3O4. Here, the chemically synthesized FePt NPs have a disordered structure and their ordered L10 structure can be obtained by an annealing process, but in the process of annealing, there is an occurrence of aggregation of particles, and the particle size is not uniform.28 However, by the application of the ferrite phase to FePt, FePt/Fe3O4 NPs can have excellent magnetic properties without a heat treatment. Moreover, these bimagnetic NPs function dually with two different materials sites for labeling, targeting, and binding with biomolecules.23,29 Furthermore, the magnetic NPs with a cubic morphology can show a high surface-to-volume ratio when compared to NPs with spherical or octahedral morphology, which can be more effective for the surface loading of the biomolecules and chemical reactions. Thus, the synthesis technique is very crucial in obtaining the bimagnetic FePt/Fe3O4 NPs with a cubic morphology for desired multifunctional properties. Generally, these bimagnetic NPs can be obtained using a two-step synthesis approach, e.g., the seeds of FePt are initially prepared and then the ferrite layers can be coated on these seeds. However, this technique suffers from certain limitations, including time-consuming two distinct steps, high temperature, and pressure, more laborious and required expensive additive.30 Furthermore, a one-pot synthetic route for the FePt/Fe3O4 NPs is reported in a few research reports; however, certain limitations still exist in this approach in terms of a longer reaction time and a high temperature.31 Hence, there is a requirement for the one-pot synthesis of FePt/Fe3O4 NPs in a short duration with low temperature and with a controlled phase for multifunctional biological applications, which remains an extremely challenging task to date.
Herein, we reported a facile one-pot synthesis method for a controlled composition of homogeneous FePt and phase-controlled FePt/Fe3O4 heterostructure nanocubes (NCs) utilizing 1,2-hexadecanediol and 1-octadecene as the reducing agents, respectively, in a unique surfactant environment with a low temperature. The homogeneous FePt and the heterostructured FePt/Fe3O4 NCs were obtained by controlling precursor ratios and reducing agents. The effect of change in the precursor ratios of Fe to Pt from 1:1 to 4:1 was investigated towards the formation of NCs using both these reducing reagents. In particular, heterostructured FePt/Fe3O4 NCs were obtained when the Fe:Pt molar ratio was 4:1 and 1-octadecene was utilized as the reducing agent. The synthesized FePt and the FePt/Fe3O4 NCs were used to investigate their biocompatibilities for future biological applications.
Experimental
Chemicals and materials
Iron pentacarbonyl, oleylamine (70%), platinum(II) acetylacetonate (97%), octyl ether (99%), oleic acid (90%), 1-hexane (97%), N,N-dimethyl formamide (99.8%), 1,2-hexadecanediol (90%), and citric acid were purchased from Sigma-Aldrich, Ltd. 1-Octadecene (95%) was purchased from Fluka. WST-8 (99.22%) was purchased from Med Chem Express. The Live/Dead™ cell-mediated cytotoxicity kit for animal cells (L7010) was purchased from Thermo Fisher Scientific. All the analytical reagent graded chemicals that were used for synthesizing NCs were used without further purification.Synthesis of nanocubes
FePt and the FePt/Fe3O4 NCs were synthesized using a facile method utilizing different precursor molar ratios and reducing agents. First, for synthesizing FePt/Fe3O4 NPs, 0.1 mmol of platinum(II) acetylacetonate, 4 mL of octyl ether, 3 mL of each oleic acid and oleylamine, and 5 mL of 1-octadecene were dispersed into a three-necked round-bottom flask with a mechanical stirrer. The solution was then heated to 120 °C at a heating rate of 5 °C min−1 under Ar gas. Then, an appropriate amount of iron pentacarbonyl was added to the above solution to maintain the precursor molar ratio of 1:1–4:1 (ratio between iron pentacarbonyl and platinum(II) acetylacetonate). Subsequently, the temperature of the reaction was increased to 240 °C at a heating rate of 5 °C min−1 and maintained for 60 min in the refluxing condition. After naturally cooling down the mixture, the precipitate was washed several times with ethanol and hexane. Similarly, for synthesizing the homogeneous FePt NCs, identical reaction conditions and chemicals were used as those used for FePt/Fe3O4 NCs synthesis mentioned above except for the replacement of the reducing agent 1-octadecene with 1 g of 1,2-hexadecanediol.
Ligand exchange of nanocubes
About 100 mg of FePt and FePt/Fe3O4 NCs were dispersed into 12 mL of hexane. Then, 4 mL of N,N-dimethyl formamide and 240 mg of citric acid were mixed with the above solution. Then, the solution was stirred overnight at 40–50 °C. After that, the NCs were washed with ethanol to remove the surplus ligands around NCs. Finally, the surface-modified NCs were collected and dispersed in distilled water.Cell culture and growth
THP-1 (ATCC TIB-202D) cells, a human monocytic cell line, were cultured in RPMI 1640 medium containing fetal bovine serum (10%) and 1% of penicillin/streptomycin and 2-mercaptoethanol solution. The cells were cultured and maintained in a 100 mm cell culture dish in an incubator at 37 °C with 5% CO2. Either the replacement with fresh medium or addition of fresh medium with pre-used medium was performed at an interval of every 2–3 days.Cell viability and imaging
CCK-8 assay was used to evaluate the cell viability of FePt and FePt/Fe3O4 NCs. The cells with a density of around 2 × 10⁴/mL cells per well were dropped in 96-well culture plates and allowed to grow further for 8 h before the treatment of the NCs. Subsequently, the cells were loaded with various concentrations (10, 40 μg mL−1) of NCs for a specific time (24 and 48 h). The cells in wells without NCs were cultured to be treated as a control. After the exposure of the cells with NCs, each well was added with 10 μL of WST-8 (CCK-8 kit) solution and incubated for another 3–4 h at 37 °C. Finally, the microplate spectrophotometer (Thermo Fisher) was used to measure the absorbance at 450 nm for each well. The cell viability of treated NCs was expressed as a percentage of the non-treated NCs (control), which was supposedly 100%. The cell death was confirmed by the confocal microscopy images further. Briefly, 24-well tissue culture plates were used to seed the THP-1 cells, and the cells were allowed to grow overnight in the wells. It was then followed by the treatment of the cells with NCs for a specific time period. The cultured cells in wells were treated with the live/dead cell-mediated cytotoxicity kit (L7010) to distinguish live and dead cells. Subsequently, the cells were monitored under a fluorescence microscope. THP-1 cells incubated with the FePt NCs (40 μg mL−1) for 48 h were washed with PBS and fixed with glutaraldehyde (3%) as well as processed for field-emission transmission electron microscopy (FE-TEM) measurement further.Characterization of nanocubes
The morphological structure and size of NCs were measured using FE-TEM (Hitachi HF-3300 at 300 kV, Japan), and the composition of the NCs was investigated using an energy-dispersive spectroscopy (EDS) coupled with TEM and X-ray photoelectron spectroscopy (XPS, ESCALAB 250Xi, Thermoacoustic, USA). The crystal structures of NCs were studied using an X-ray diffraction (XRD, Rigaku D/max-250, Japan) with CuKα radiation (λ = 1.540562 Å) in the 2θ range from 25° to 65°. The vibrating sample magnetometer (VSM, Lakeshore 7407, USA) was used to analyze the magnetic properties of NCs with a field range of −10 kOe to +10 kOe at room temperature.Results and discussion
An effective synthesis route was designed for synthesizing both the homogeneous FePt and the heterostructured FePt/Fe3O4 NCs by optimizing the suitable reaction condition, the molar ratio of the precursor, and the reducing agents (Fig. 1 and S1†). When 1,2-hexadecanediol was used as a reagent, homogeneous FePt NCs were formed. The effective reducing ability of 1,2-hexadecanediol and the ability of Pt ions to affect the accelerating the metal cation reduction could uniformly lead to the successful synthesis of the homogeneous FePt NCs with controllable composition.32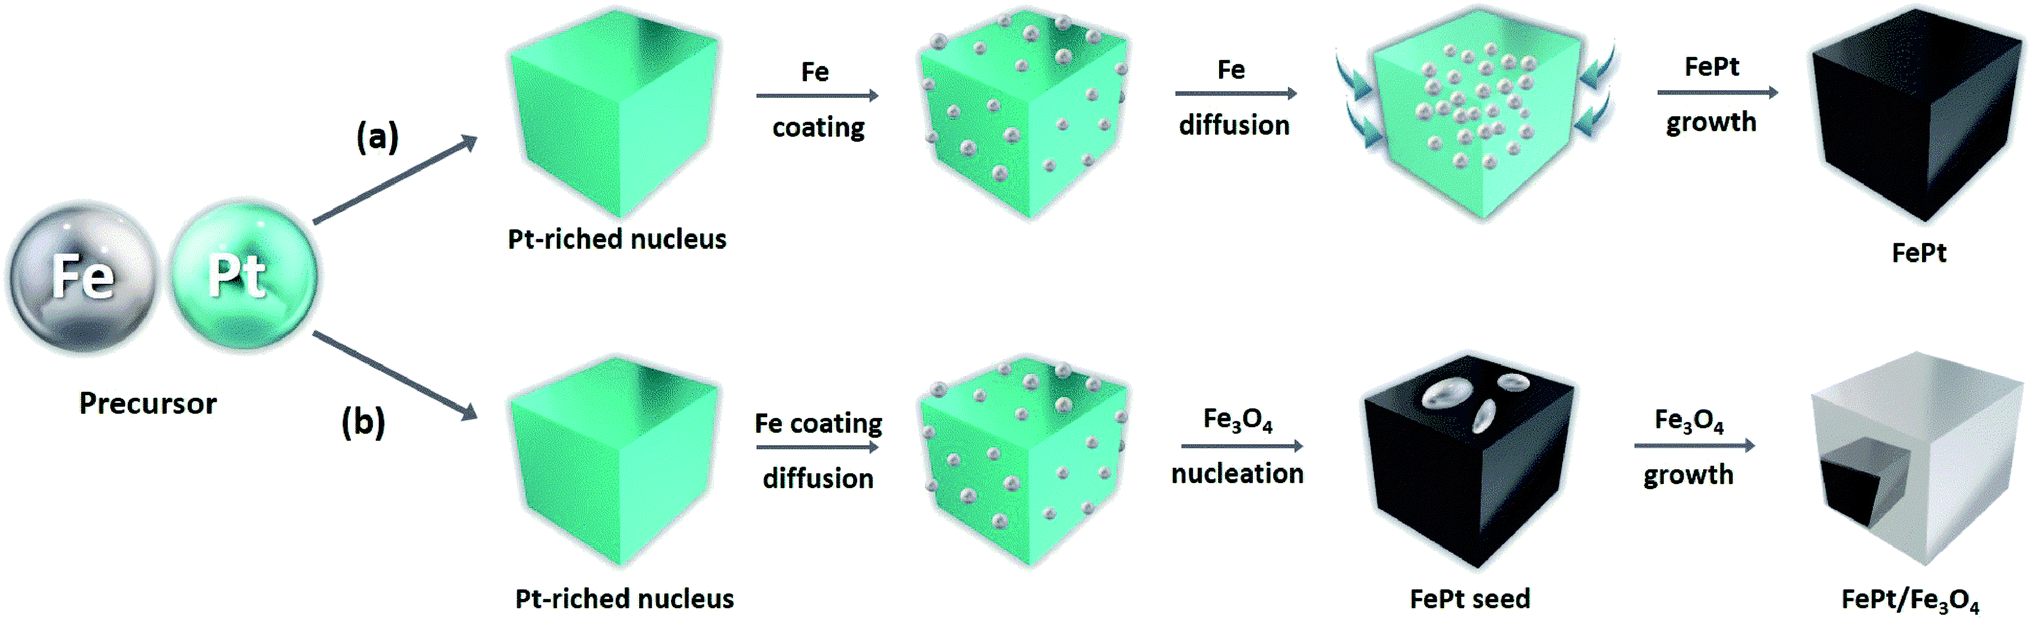 | ||
| Fig. 1 Schematic of FePt and FePt/Fe3O4 NC formation from the decomposition of Fe(CO)5 and the reduction of Pt(acac)2 using (a) 1,2-hexadecanediol and (b) 1-octadecene. | ||
To explore the effect of the ratio of precursor on the morphology and the structure of FePt NCs, the molar ratios of the precursors Fe to Pt were varied from 1:1 to 4:1 at the same reaction condition. As observed in Fig. 2a–d, almost all of the FePt NCs are monodispersed with cubic shapes. As previously suggested, the use of Fe(acac)2 or FeCl2 as a source of Fe to prepare uniform FePt NCs was not successful.32 Hence, in our approach, the use of Fe(CO)5 as the Fe source might be the reason for the cubic morphology of FePt. The average size of NCs was in the range of 10–13 nm as confirmed from the size distribution graph (Fig. S2†). The HR-TEM image of the homogeneous FePt NCs is shown as an inset in Fig. 2d. It clearly indicated the inter-fringe distance of 0.2256 nm, which was close to the interplanar distance of the (111) facet of the face-centered cubic (fcc) FePt.33
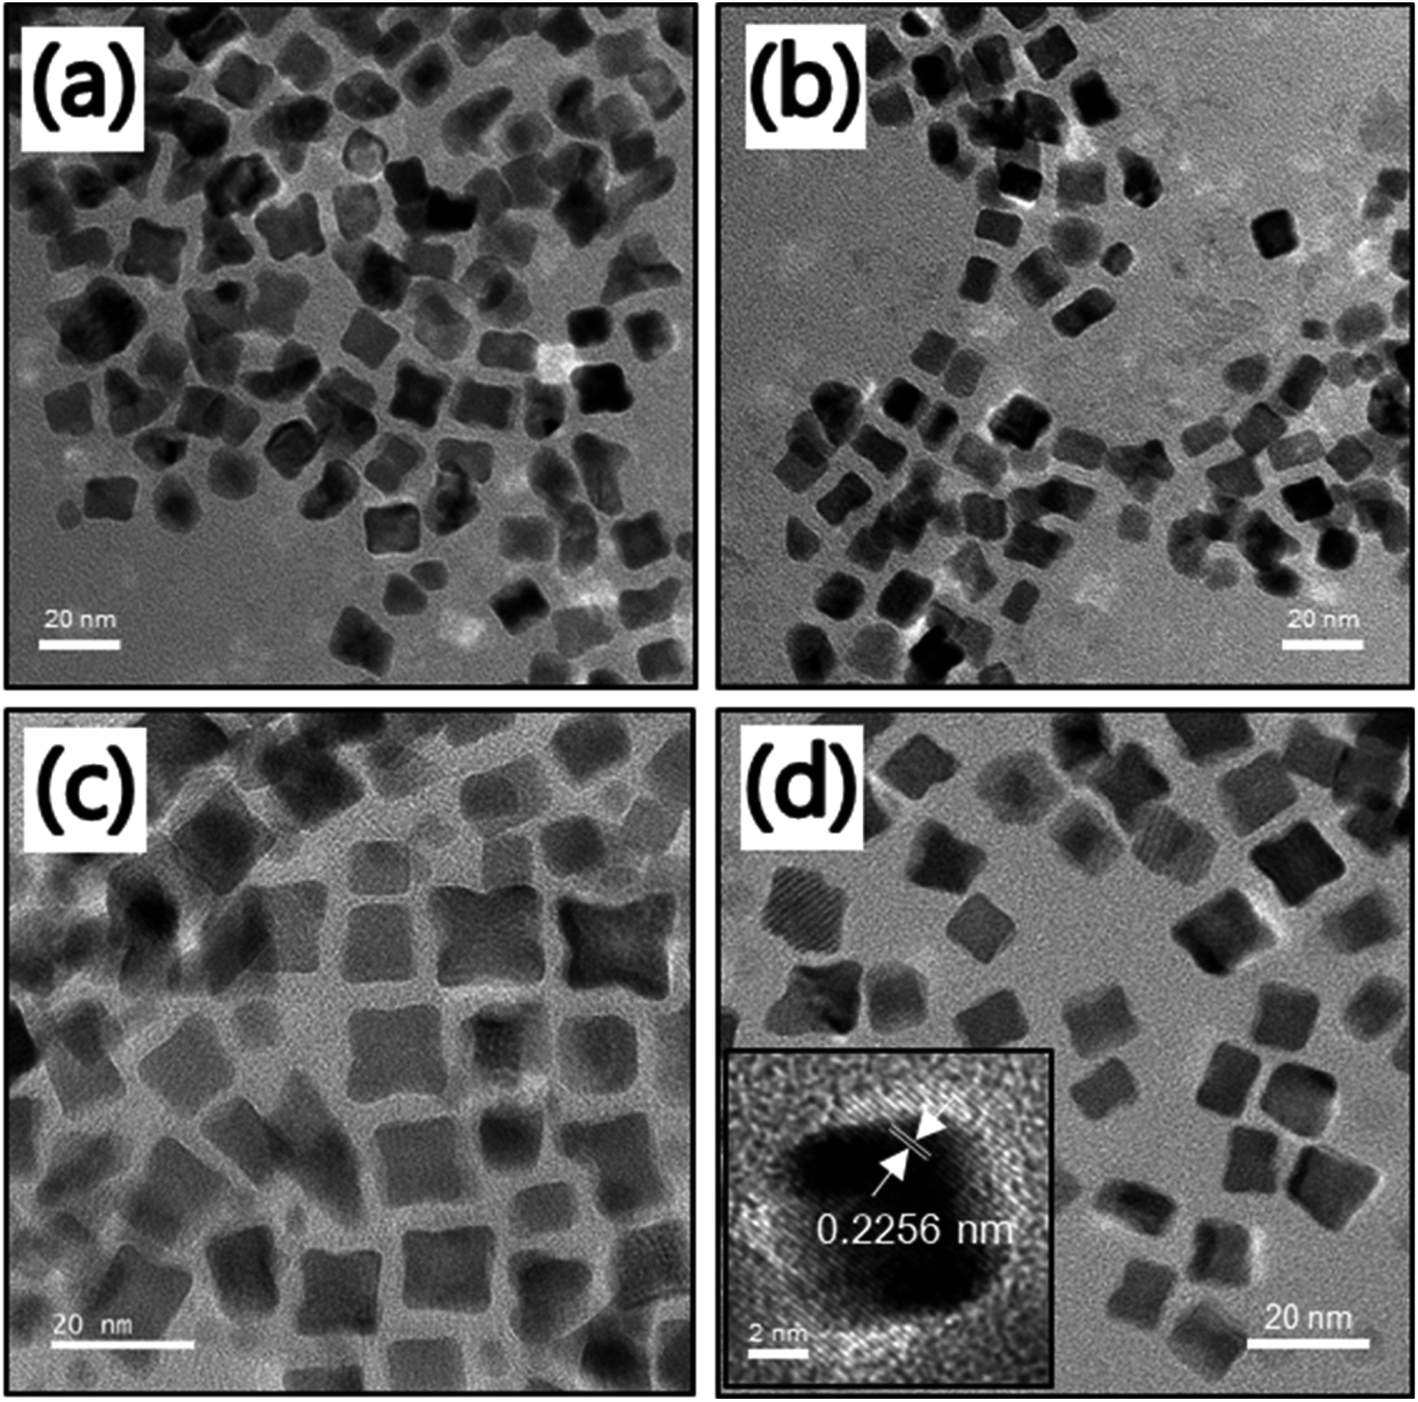 | ||
| Fig. 2 TEM images of the FePt NCs with different precursor ratios of Fe to Pt (a) 1:1, (b) 2:1, (c) 3:1, and (d) 4:1 at the same reaction conditions. The inset in Fig. 2d shows the HR-TEM image of the FePt nanocube at a precursor ratio of Fe to Pt of 4:1. | ||
The compositional variation in FePt NCs achieved by changing the precursor ratios of Fe to Pt from 1:1 to 4:1 for four different samples (samples 1–4) was analyzed by EDS and XPS (Fig. S3 and S4†). Fig. 3 shows the calculated composition of the four different samples of NCs. When the precursor ratio was 1:1, the composition of the NCs was Fe26Pt74, which indicated that there was a quick reduction in the Pt salt compared to the Fe(CO)5 decomposition in solutions, thereby resulting in the entry of more Pt atoms into the seeds during the process of nucleation.34 When the precursor ratio was changed from 2:1 to 4:1, the FePt composition was reported to be Fe30Pt70, Fe38Pt62, and Fe46Pt54, which indicated the accelerated decomposition of the Fe salt.34 The crystal structure of FePt NCs with varying composition was analyzed using XRD patterns (Fig. S5†). The observed crystal planes of (111) and (200) were related to the fcc FePt (JCPDS card no. 00-029-0718), which indicated the formation of the homogeneous FePt NCs without any oxide phase. Overall, the FePt atomic compositional ratio could be easily controlled using 1,2-hexadecanediol as the reducing reagent. Although there was a change in the atomic composition of FePt with a change in the precursor ratio, it still exhibited a homogeneous phase of FePt.
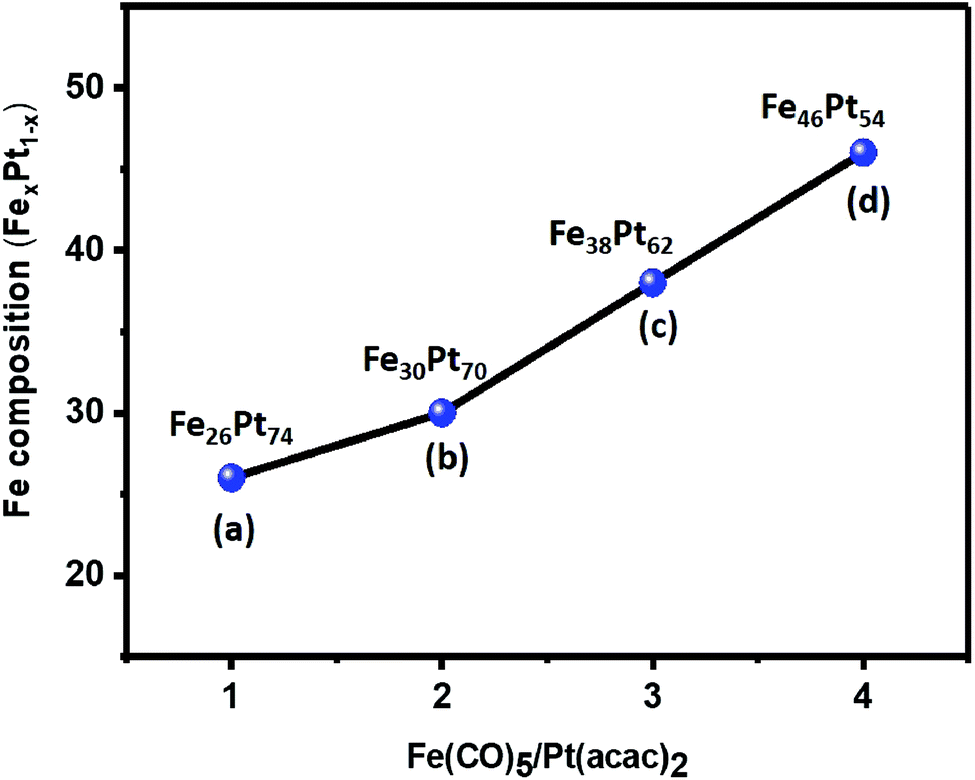 | ||
| Fig. 3 Compositional variation in the FePt NCs with different precursor ratios of Fe to Pt (a) 1:1, (b) 2:1, (c) 3:1, and (d) 4:1 using 1,2-hexadecanediol. | ||
However, usage of 1-octadecene as the reducing agent resulted in a heterostructure of FePt/Fe3O4 rather than the expected homogeneous FePt NCs when changing the precursor ratio. When the precursor ratio is 1:1, there is a formation of cube-shaped homogeneous FePt, as shown in Fig. 4a. When the ratio of the precursor was increased from 2:1 to 3:1, most FePt NCs were still in a homogeneous phase, and a cube-shaped morphology with an average size of around 6–10 nm was observed (Fig. 4b and c and S6†). However, in a 3:1 ratio, it was observed that the initiation of the nucleation of Fe3O4 was started on a few FePt NCs. Finally, when the precursor ratio of Fe to Pt was increased to 4:1, the heterodimer structure of FePt/Fe3O4 was formed rather than the single-phase FePt NCs (Fig. 4d). The TEM image shows that FePt appeared to be darker gray compared to Fe3O4 due to the high electron density of Pt, confirming the heterogeneity of NCs. The calculated average size of the heterostructure was around 18 nm. In the heterostructured FePt/Fe3O4 NCs, the FePt functioned as a seed and had developed a facet due to a relatively large particle size and Fe3O4 grew on their facets. Interestingly, excessive Fe ions did not make either the nuclei separately or the shell on the FePt NCs, rather nucleated on a facet of FePt, and Fe3O4 separately developed its phase and yielded the heterostructure of the FePt/Fe3O4 NCs. It suggested that the activation energy of the nuclei formation was higher than that of the energy of the surface growth; thus, it was possible to make a heterostructure.31 Comparatively, a less driving force was required to grow the heterogeneous nucleation than the homogeneous one; thus, 1-octadecene as a mild reducing agent showed heterogeneous nucleation after seed generation with a specific precursor ratio.35 Furthermore, the nucleation site was influenced by the solvent polarity where the polar solvent allowed multiple nucleation sites, whereas the non-polar solvent restricted the nucleation to only a single site.36 Herein, we used octyl ether, a good non-polar solvent, which leads to the nucleation of Fe3O4 in a single site of the FePt nanoparticle rather than multiple nucleations sporadically outside, thereby resulting in the formation of a heterostructure of FePt/Fe3O4 NCs. The HR-TEM images of the homogeneous FePt and the heterostructured FePt/Fe3O4 NCs are shown in Fig. 4e and f, respectively, which indicate the high crystallinity of NCs. Similar to the homogeneous FePt, the measured interplanar distance of FePt in the heterostructure was 0.2256 nm, which corresponded to the (111) facet of the fcc FePt structure, and the interplanar distance of Fe3O4 in the heterostructure was 0.296 nm, which corresponded to the inverse spinel cubic Fe3O4.31
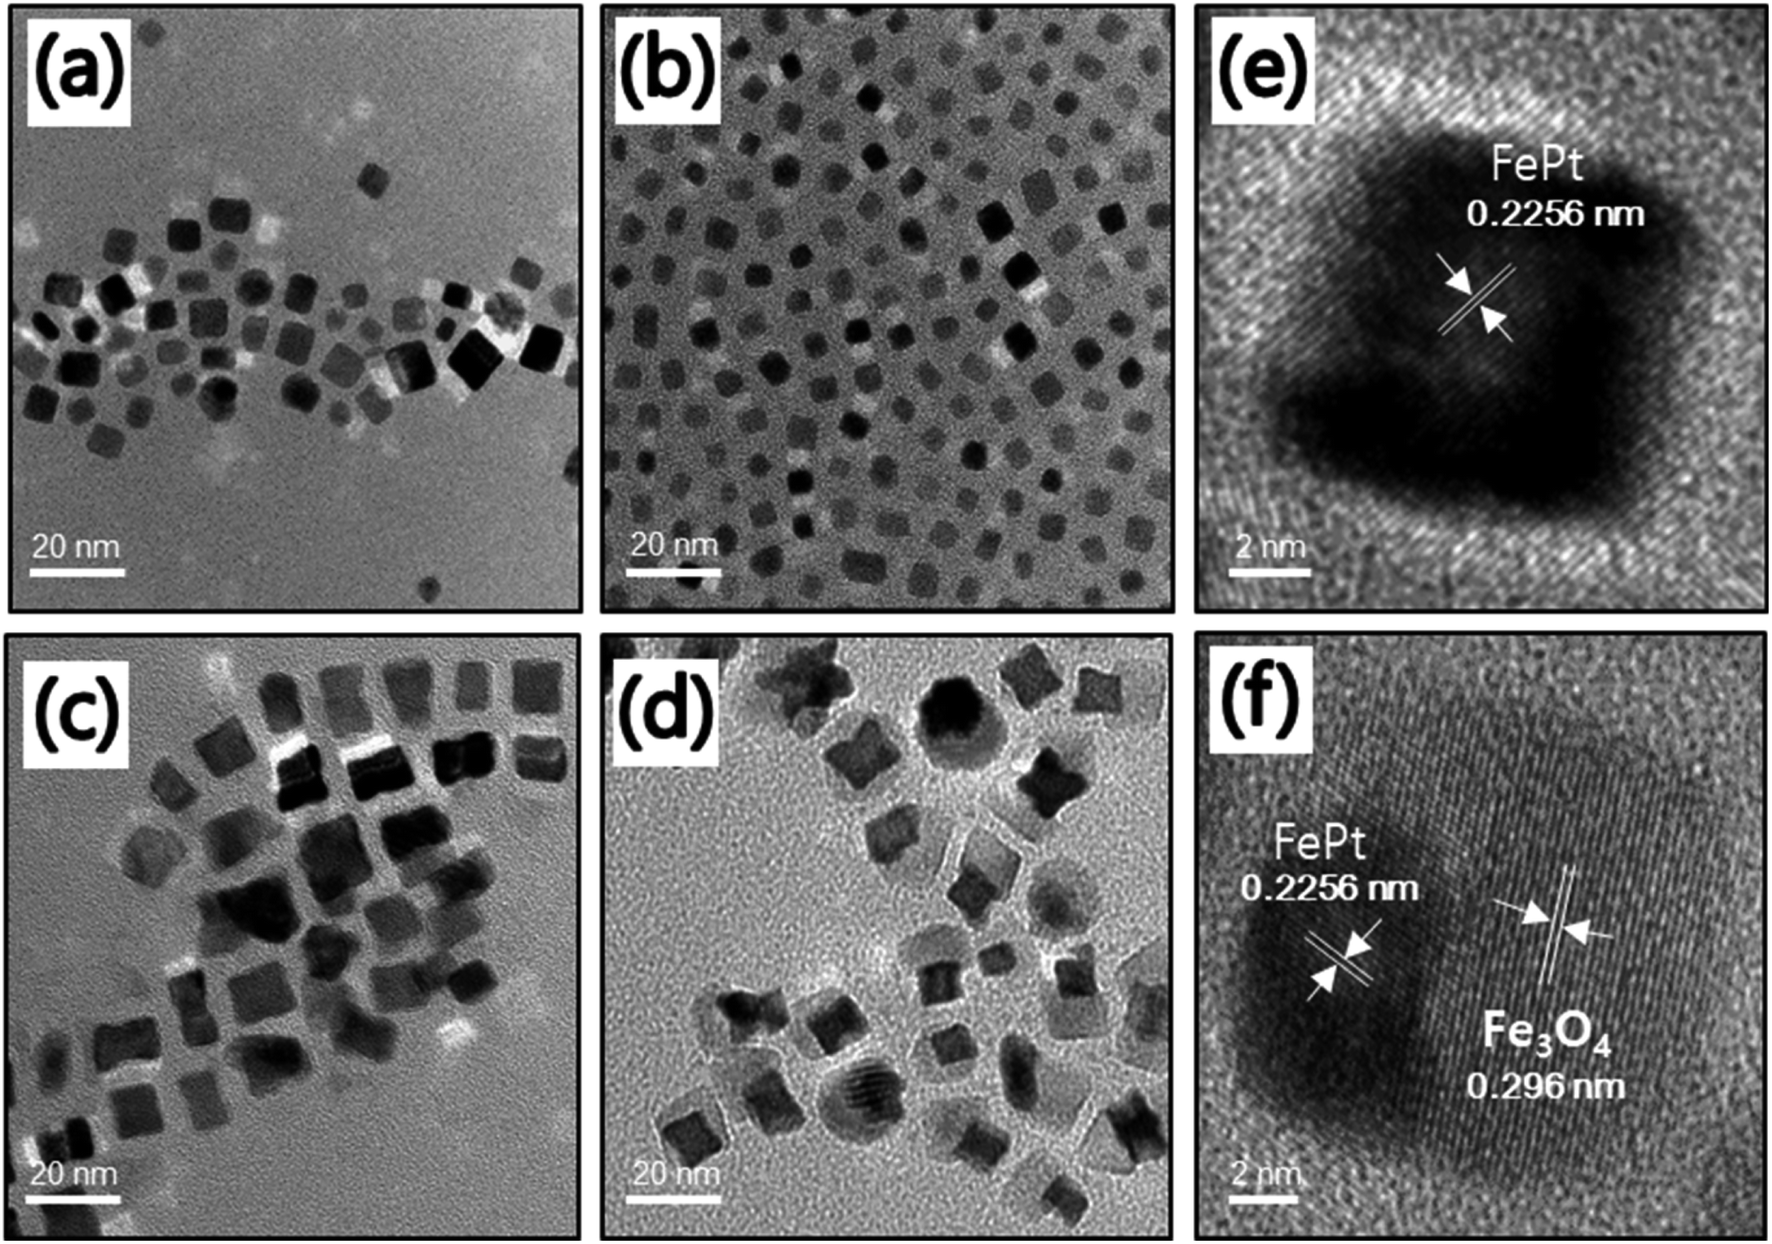 | ||
| Fig. 4 TEM images of the NCs with different precursor ratios of Fe to Pt (a) 1:1, (b) 2:1, (c) 3:1, and (d) 4:1 using 1-octadecene as the solvent. HR-TEM images of (e) the homogeneous FePt and (f) the FePt/Fe3O4 heterostructure NCs. | ||
The EDS elemental mapping images for both the NCs, which indicate the distribution of the Fe and Pt elements for FePt and the Fe, Pt, and O elements for FePt/Fe3O4, are shown in Fig. 5a and b, respectively. Fig. 5a(i) shows the TEM image of the FePt nanocube used for EDS mapping. Fig. 5a(ii–iv) shows the elemental maps of Fe (green color), Pt (red color), and merged image of FePt. From the images, it was clear that the elemental contribution from both Fe and Pt was homogeneously distributed throughout the nanocube. The TEM image of the FePt/Fe3O4 nanocube to be analyzed for the map is shown in Fig. 5b(i and ii). The elemental maps of Fe (green color), Pt (red color), O (blue color), and merged image of FePt/Fe3O4 are shown in Fig. 5b(iii–vi). The elemental contribution of Pt was only confined to the FePt region, and O was distributed in the region of Fe3O4, whereas the distribution of Fe element was observed throughout the whole nanocube, which indicated the formation of the heterostructured FePt/Fe3O4 nanocube. Moreover, Fig. S7† shows the further elemental composition is confirmed by the EDS analysis.
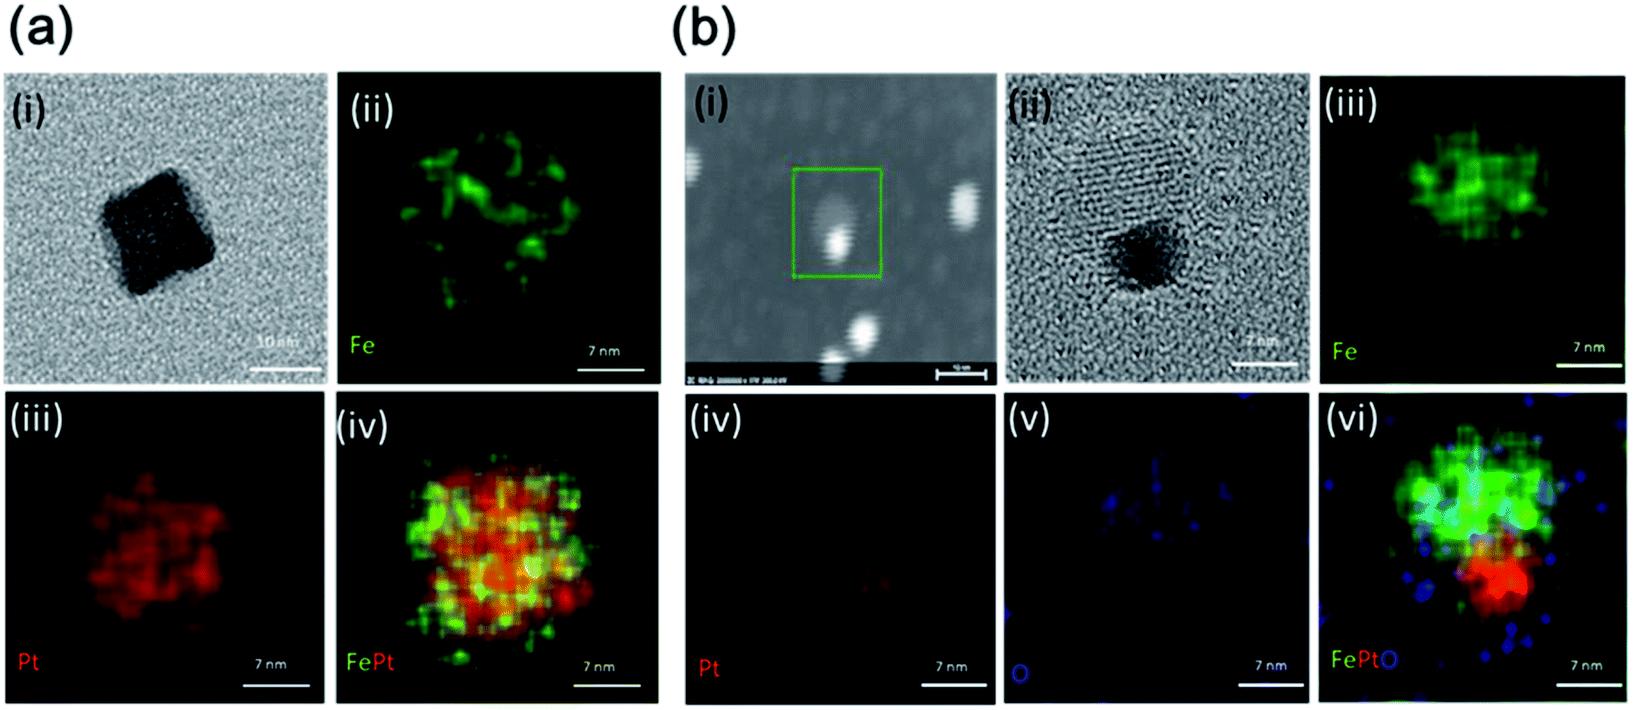 | ||
| Fig. 5 The EDS mapping of (a) FePt NCs with (i) the TEM image of the nanocube, (ii) map of Fe, (iii) map of Pt and (iv) merged image, and (b) FePt/Fe3O4 NCs with (i and ii) the TEM image, (iii) map of Fe, (iv) map of Pt, (v) map of O and (vi) merged image. | ||
Fig. 6a shows the XRD diffraction patterns of the synthesized FePt NCs and the FePt/Fe3O4 NCs when utilizing 1-octadecene as the reducing agent. FePt exhibited crystal planes of (111) and (200) and were well-matched with the standard data for fcc FePt (JCPDS card no. 00-029-0718).30 However, with an increase in the precursor ratio from 1:1 to 4:1, in addition to crystal plane being related to the FePt, the crystal planes of (220), (311), (400), (440), and (511) corresponding to Fe3O4 were identified and well matched with the standard data for inverse spinel Fe3O4 (JCPDS card no. 00-019-0629).25 However, there are few small intense peaks related to Fe3O4 were also found in the sample of 3:1 precursor ratio which may be due to the nucleation of Fe3O4 phase was initiated at this precursor ratio, and finally, in 4:1 ratio, the Fe3O4 phase is more prominent, and thus obtained a complete heterostructure of FePt/Fe3O4 NCs. The XRD pattern confirmed the heterostructure with both the FePt and Fe3O4 phases.
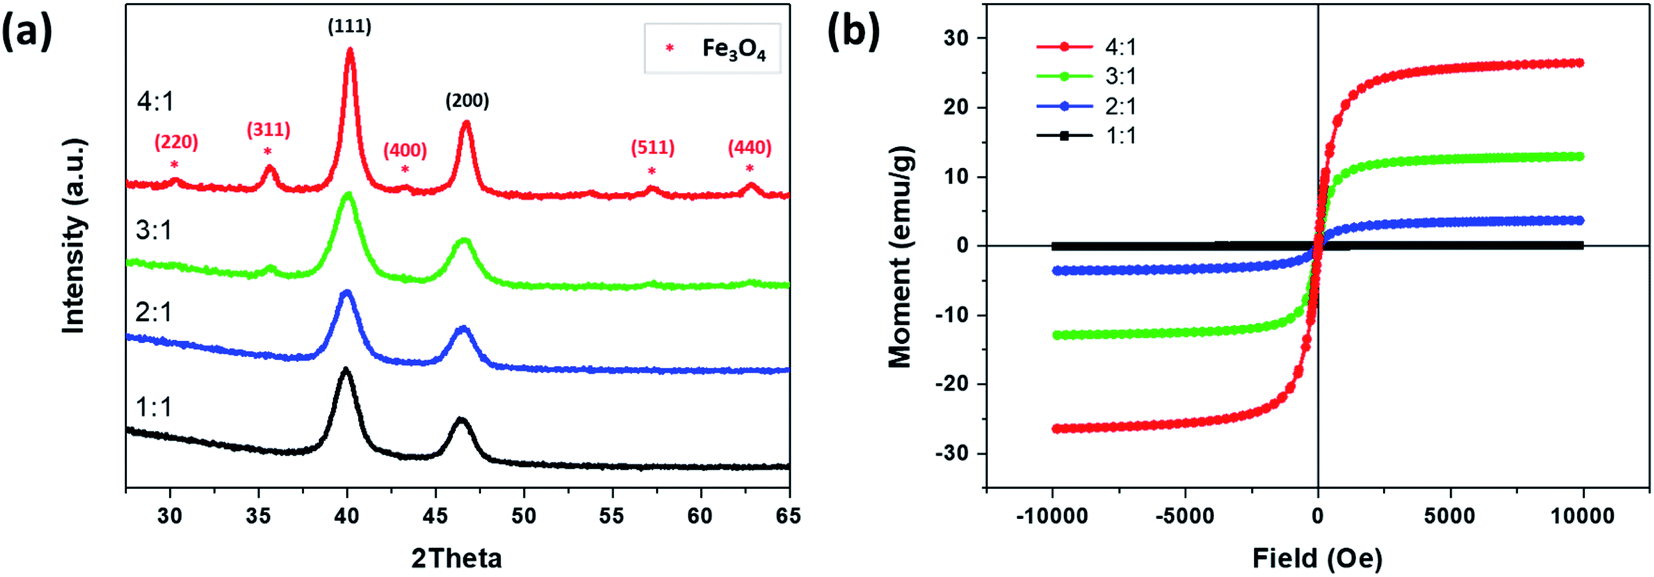 | ||
| Fig. 6 (a) The XRD patterns and (b) the hysteresis loops of NCs synthesized by changing the precursor ratio of Fe to Pt from 1:1 to 4:1 using 1-octadecene as the reducing agent. | ||
The magnetic property of synthesized NCs using 1-octadecene as the reducing agent and by changing the precursor ratio of Fe and Pt from 1:1 to 4:1 was measured by the VSM at room temperature (Fig. 6b). The saturation magnetization (Ms) of Fe to Pt 1:1 was 0.07 emu g−1. However, an increase in the Fe precursor ratio from 1:1 to 3:1 increased the Ms value, where 2:1 and 3:1 exhibited 3.67 and 12.93 emu g−1, respectively. Furthermore, an increase in the precursor ratio to 4:1 where the FePt/Fe3O4 heterostructure was obtained had the highest Ms of 26.5 emu g−1 due to the formation of the Fe3O4 phase. Moreover, the synthesized FePt and FePt/Fe3O4 NCs did not exhibit any coercivity, which indicated an excellent superparamagnetic nature of the NCs, and thus could serve as a potential candidate for the dual-modality contrast agent for CT/MRI molecular imaging.21
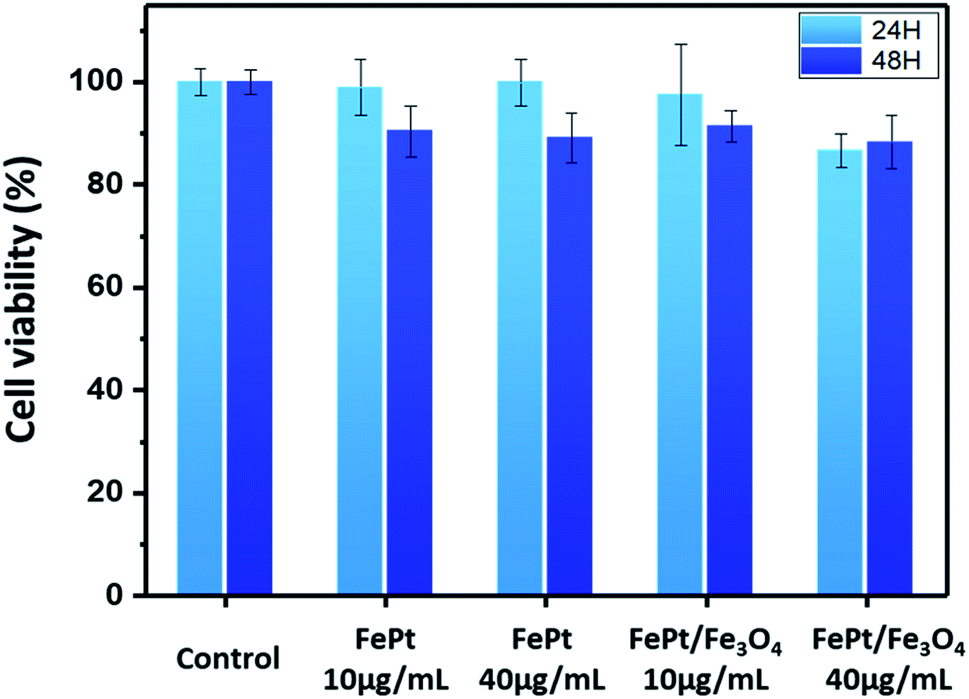
The cytotoxicity of the ligand exchanged FePt and FePt/Fe3O4 NCs synthesized using 1-octadecene as the reducing agent was evaluated in a THP-1 (ATCC TIB-202D) cell line using the CCK-8 assay. Both the NCs were tested over a dosage of 10 and 40 μg mL−1 for 24 and 48 hours (Fig. 7). The CCK-8 assay indicated that both the ligand exchanged FePt and the FePt/Fe3O4 NCs did not exhibit any significant cytotoxic response or inhibitory effect on the cell growth even at a higher concentration (40 μg mL−1) and a longer duration (48 hours). However, in comparison with the heterostructured FePt/Fe3O4 NCs, the FePt NCs showed a slightly higher cell viability with a high concentration at 48 hours.
 | ||
| Fig. 7 THP-1 cell viability test of the FePt and FePt/Fe3O4 NCs with different concentrations (10 and 40 μg mL−1) and time (24 and 48 hours). | ||
Fig. 8 shows the stained live and dead cells through the differential interference contrast (DIC) optical microscopy and fluorescence microscopy images, suggesting and quantifying the cell viability at each concentration. Generally, live cells show stained green colored images and dead cells show red colored images.37 It was observed from the figure that at low concentrations, the THP-1 cells were almost alive. However, at high concentrations, only a few stained red cells were observed. Overall, the high cell viability of the FePt and FePt/Fe3O4 NCs was observed, which indicated their excellent in vitro biocompatibilities. Furthermore, the internalization of the NCs into the cell is confirmed through TEM, as shown in Fig. S8.† As observed from the image, it was clear that the NCs underwent internalization and were located near the cell membrane region, and thus showed good cell viability. Moreover, the use of citric acid as a ligand exchange material in our study could be advantageous due to its biocompatibility, ability of being a good stabilizer in an aqueous phase. Furthermore, the uncoordinated carboxyl groups provide a good surface to conjugate biomolecules.38
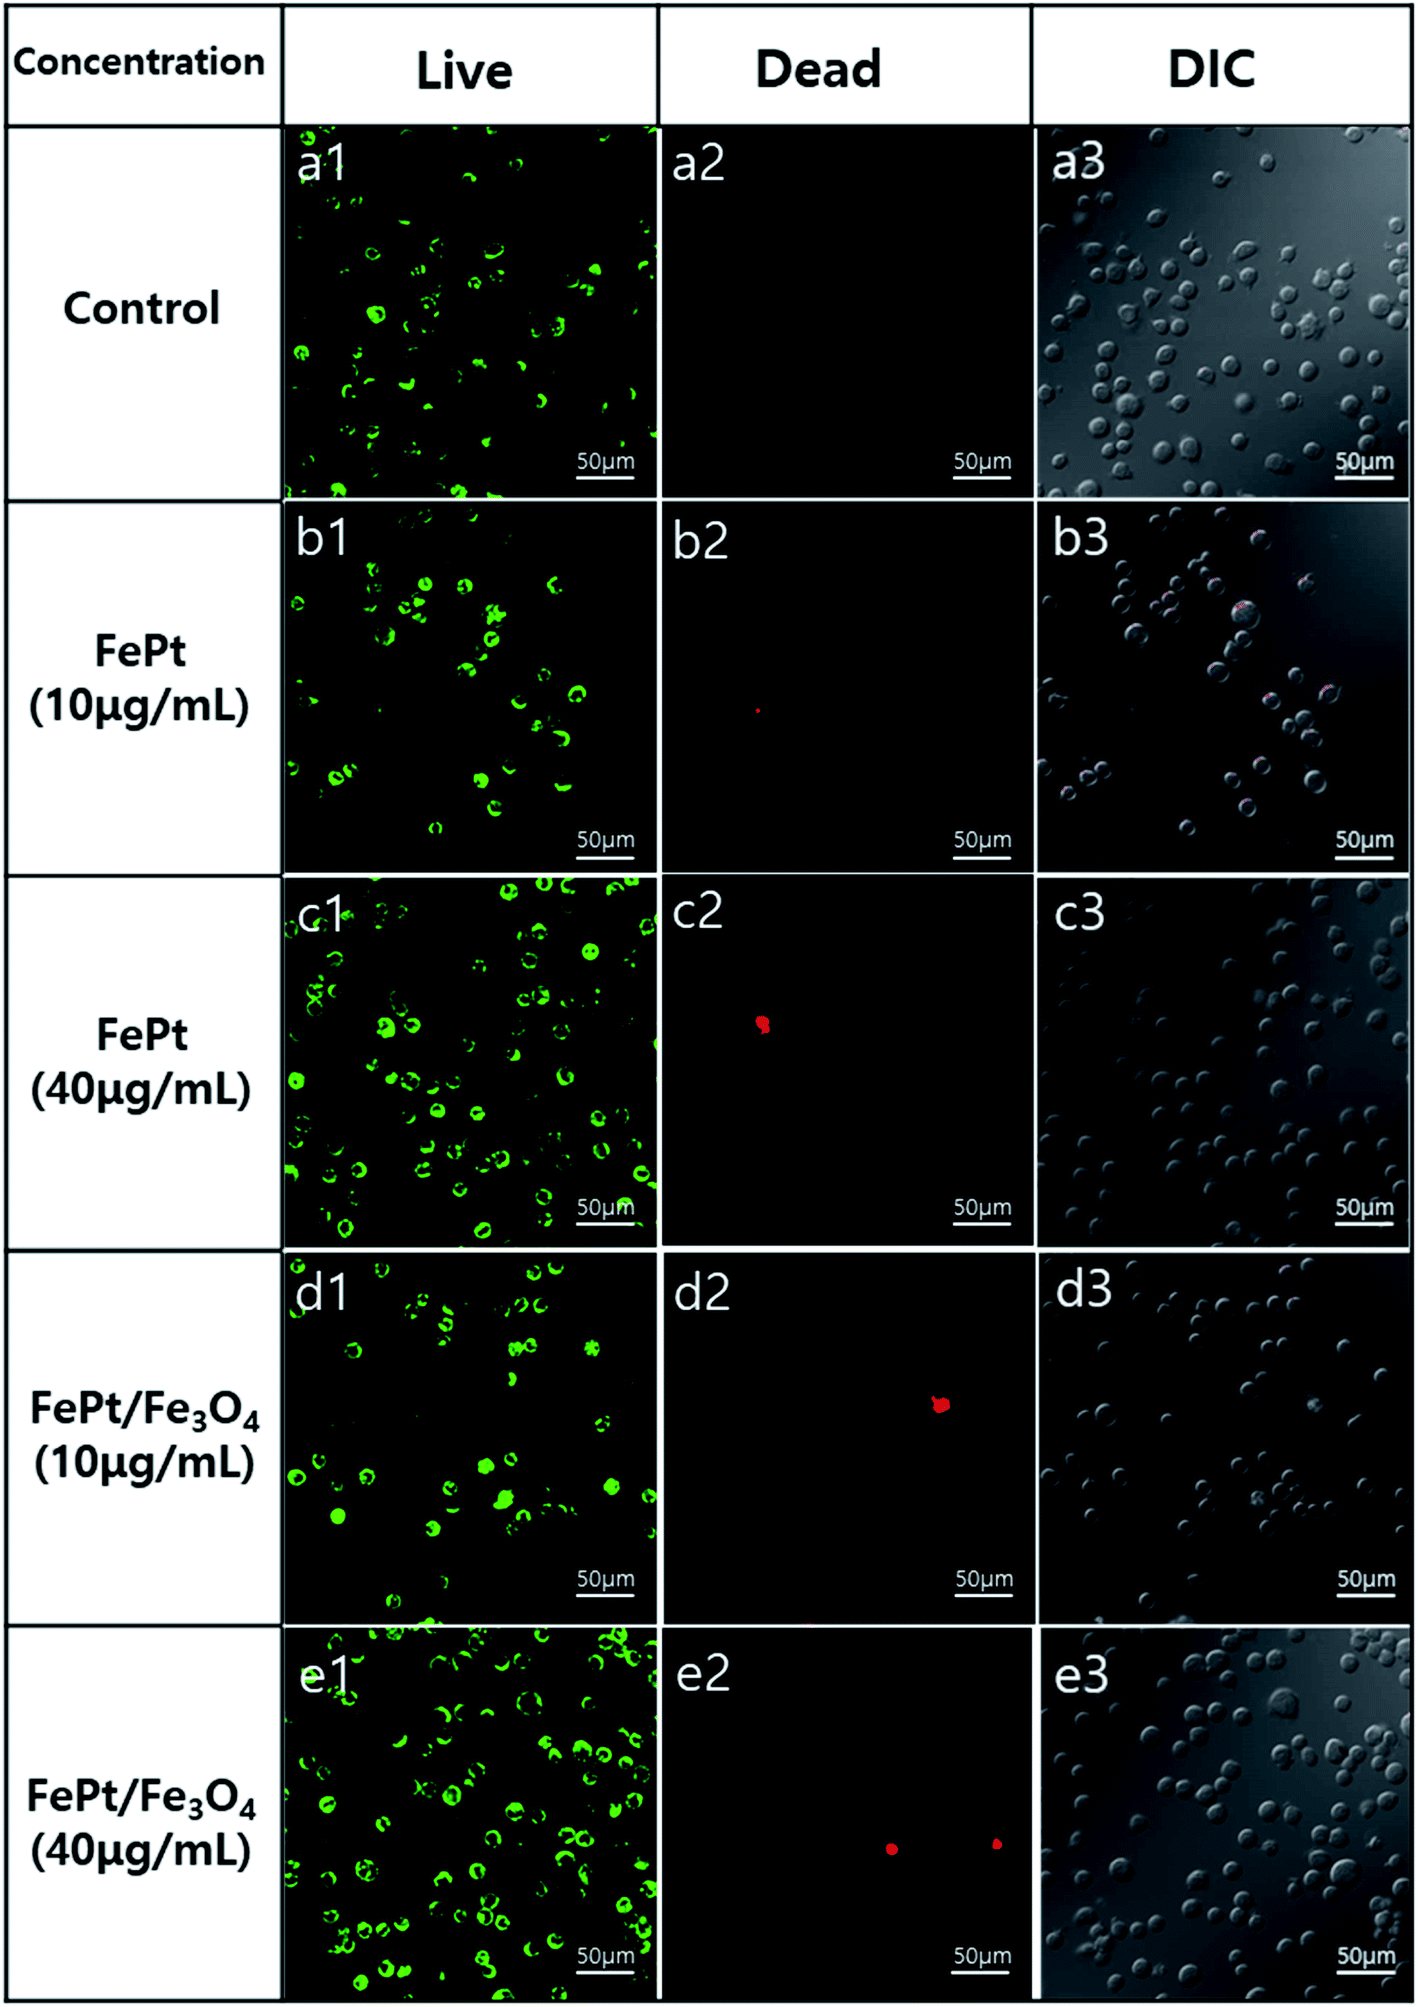 | ||
| Fig. 8 Confocal microscopy images of THP-1 cells loaded with high and low concentrations of FePt and FePt/Fe3O4 NCs for an incubation period of 24 hours. (a1–e1) Live cells, (a2–e2) dead cells, and (a3–e3) DIC images. | ||
Conclusions
In summary, we demonstrated a one-pot synthesis approach for the preparation of homogenous FePt and heterostructured FePt/Fe3O4 NCs using 1,2-hexadecanediol and 1-octadecene as the reducing agents, respectively. The effect of the change in the precursor ratios of Fe to Pt from 1:1 to 4:1 was analyzed towards the formation of the NCs using both these reducing reagents. Usage of both 1,2-hexadecanediol and 1-octadecene reducing agents showed different results: the former reagent leads to the controlled composition and homogeneous FePt NCs, whereas the latter reagent resulted in a phase-controlled heterostructured FePt/Fe3O4 NCs with one-point growth of Fe3O4. The heterostructure was obtained when the precursor ratio of Fe to Pt was 4:1 and when utilizing 1-octadecene as the reducing agent whereby the initial nucleation of the FePt seeds played an important role and the subsequent growth of Fe3O4 proceeded at one facet of the FePt in a single reaction. The synthesis approach avoided the separate synthesis of one material of seed for the growth of the another material and was advantageous in obtaining a controlled morphology of NCs. Furthermore, both the FePt and FePt/Fe3O4 NCs showed a high cell viability, which indicated their good in vitro biocompatibilities, thereby extending their applicability towards the various biomedical applications, including use as an MRI agent, hyperthermia, and multifunctional platform with the specific characteristic of each material. Moreover, the FePt/Fe3O4 heterostructure could be used as a site-specific multifunctional material for the simultaneous multiplexing applications.
Conflicts of interest
There are no conflicts of interest to declare.Acknowledgements
This research was supported by the National Research Foundation of Korea (NRF) grant funded by the Korean government (MSIT) (2018R1A5A1025511).References
- Z. Wan and J. Wang, J. Hazard. Mater., 2017, 324, 653–664 CrossRef CAS.
- Z. Wang, X. Xue, H. Lu, Y. He, Z. Lu, Z. Chen, Y. Yuan, N. Tang, C. A. Dreyer, L. Quigley, N. Curro, K. S. Lam, J. H. Walton, T.-y. Lin, A. Y. Louie, D. A. Gilbert, K. Liu, K. W. Ferrara and Y. Li, Nat. Nanotechnol., 2020, 15, 482–490 CrossRef CAS.
- J. Kim, Y. Piao, N. Lee, Y. I. Park, I. H. Lee, J. H. Lee, S. R. Paik and T. Hyeon, Adv. Mater., 2010, 22, 57–60 CrossRef CAS.
- A. Ranzoni, G. Sabatte, L. J. van IJzendoorn and M. W. Prins, ACS Nano, 2012, 6, 3134–3141 CrossRef CAS.
- Y. Xu, M. Yan and D. Sellmyer, J. Nanosci. Nanotechnol., 2007, 7, 206–224 CrossRef.
- X. Sun, Y. Huang and D. E. Nikles, Int. J. Nanotechnol., 2004, 1, 328–346 CrossRef CAS.
- S. Kim, S. R. Torati, A. Talantsev, C. Jeon, S. Lee and C. Kim, Sensors, 2020, 20, 434 CrossRef CAS.
- X. N. Pham, T. P. Nguyen, T. N. Pham, T. T. N. Tran and T. V. T. Tran, Adv. Nat. Sci.: Nanosci. Nanotechnol., 2016, 7, 045010 Search PubMed.
- M. Abbas, S. R. Torati and C. Kim, Nanoscale, 2015, 7, 12192–12204 RSC.
- M. Abbas, S. R. Torati and C. Kim, Dalton Trans., 2017, 2303–2309 RSC.
- K. V. Ranganath, J. Kloesges, A. H. Schäfer and F. Glorius, Angew. Chem., Int. Ed., 2010, 49, 7786–7789 CrossRef CAS.
- A. M. Munshi, D. Ho, M. Saunders, V. Agarwal, C. L. Raston and K. S. Iyer, Sens. Actuators, B, 2016, 235, 492–497 CrossRef CAS.
- A. M. Munshi, V. Agarwal, D. Ho, C. L. Raston, M. Saunders, N. M. Smith and K. S. Iyer, Cryst. Growth Des., 2016, 16, 4773–4776 CrossRef CAS.
- M. Sahu, M. Shaikh, A. Rai and K. V. Ranganath, J. Inorg. Organomet. Polym. Mater., 2020, 30, 1002–1007 CrossRef CAS.
- S.-H. Choi, H. B. Na, Y. I. Park, K. An, S. G. Kwon, Y. Jang, M.-h. Park, J. Moon, J. S. Son and I. C. Song, J. Am. Chem. Soc., 2008, 130, 15573–15580 CrossRef CAS.
- G. Tang, W. Chen, X. Wan, F. Zhang and J. Xu, Colloids Surf., A, 2020, 587, 124291 CrossRef CAS.
- V. Nandwana, G. S. Chaubey, K. Yano, C.-b. Rong and J. P. Liu, J. Appl. Phys., 2009, 105, 014303 CrossRef.
- D. H. Kim, E. A. Vitol, J. Liu, S. Balasubramanian, D. J. Gosztola, E. E. Cohen, V. Novosad and E. A. Rozhkova, Langmuir, 2013, 29, 7425–7432 CrossRef CAS.
- J.-S. Lee, M. I. Bodnarchuk, E. V. Shevchenko and D. V. Talapin, J. Am. Chem. Soc., 2010, 132, 6382–6391 CrossRef CAS.
- Z. Cheng, N. Choi, R. Wang, S. Lee, K. C. Moon, S. Y. Yoon, L. Chen and J. Choo, ACS Nano, 2017, 11, 4926–4933 CrossRef CAS.
- S.-W. Chou, Y.-H. Shau, P.-C. Wu, Y.-S. Yang, D.-B. Shieh and C.-C. Chen, J. Am. Chem. Soc., 2010, 132, 13270–13278 CrossRef CAS.
- M. S. Seehra, V. Singh, P. Dutta, S. Neeleshwar, Y. Y. Chen, C. L. Chen, S. W. Chou and C. C. Chen, J. Phys. D: Appl. Phys., 2010, 43, 145002 CrossRef.
- D. Jishkariani, Y. Wu, D. Wang, Y. Liu, A. van Blaaderen and C. B. Murray, ACS Nano, 2017, 11, 7958–7966 CrossRef CAS.
- Y.-w. Jun, J.-w. Seo and J. Cheon, Acc. Chem. Res., 2008, 41, 179–189 CrossRef CAS.
- Y. Eom, M. Abbas, H. Noh and C. Kim, RSC Adv., 2016, 6, 15861–15867 RSC.
- M. Abbas, S. R. Torati, S. A. Iqbal and C. Kim, New J. Chem., 2017, 41, 2724–2734 RSC.
- B. Sinha, T. S. Ramulu, K. Kim, R. Venu, J. Lee and C. Kim, Biosens. Bioelectron., 2014, 59, 140–144 CrossRef CAS.
- I. Zafiropoulou, V. Tzitzios, D. Petridis, E. Devlin, J. Fidler, S. Hoefinger and D. Niarchos, Nanotechnology, 2005, 16, 1603 CrossRef CAS.
- C. Xu, B. Wang and S. Sun, J. Am. Chem. Soc., 2009, 131, 4216–4217 CrossRef CAS.
- C.-W. Lai, Y.-H. Wang, B. P. Uttam, Y.-C. Chen, J.-K. Hsiao, C.-L. Liu, H.-M. Liu, C.-Y. Chen and P.-T. Chou, Chem. Commun., 2008, 42, 5342–5344 RSC.
- A. Figuerola, A. Fiore, R. Di Corato, A. Falqui, C. Giannini, E. Micotti, A. Lascialfari, M. Corti, R. Cingolani and T. Pellegrino, J. Am. Chem. Soc., 2008, 130, 1477–1487 CrossRef CAS.
- C. Liu, X. Wu, T. Klemmer, N. Shukla, X. Yang, D. Weller, A. G. Roy, M. Tanase and D. Laughlin, J. Phys. Chem. B, 2004, 108, 6121–6123 CrossRef CAS.
- K. Yano, V. Nandwana, G. S. Chaubey, N. Poudyal, S. Kang, H. Arami, J. Griffis and J. P. Liu, J. Phys. Chem. C, 2009, 113, 13088–13091 CrossRef CAS.
- C. Zhang, H. Wang, Y. Mu, J. Zhang and H. Wang, Nanoscale Res. Lett., 2014, 9, 615 CrossRef.
- Y. Xia, K. D. Gilroy, H. C. Peng and X. Xia, Angew. Chem., Int. Ed., 2017, 56, 60–95 CrossRef CAS.
- H. Zeng and S. Sun, Adv. Funct. Mater., 2008, 18, 391–400 CrossRef CAS.
- B.-J. Kroesen, G. Mesander, J. Ter Haar, T. The and L. De Leij, J. Immunol. Methods, 1992, 156, 47–54 CrossRef CAS.
- S. Nigam, K. Barick and D. Bahadur, J. Magn. Magn. Mater., 2011, 323, 237–243 CrossRef CAS.
Footnote |
| † Electronic supplementary information (ESI) available. See DOI: 10.1039/d0ra06911f |
| This journal is © The Royal Society of Chemistry 2020 |