
 Open Access Article
 This Open Access Article is licensed under a Creative Commons Attribution-Non Commercial 3.0 Unported Licence
Nanoparticle induced formation of self-assembled zwitterionic surfactant microdomains which mimic microemulsions for the in situ fabrication and dispersion of silver nanoparticles†
Taichi
Nakagawa
a,
Akihide
Hibara
 b,
Willie L.
Hinze
c and
Yoshitaka
Takagai
*a
b,
Willie L.
Hinze
c and
Yoshitaka
Takagai
*a
aFaculty of Symbiotic Systems Science, Cluster of Science and Technology, Fukushima University, 1 Kanayagawa, Fukushima 960-1296, Japan. E-mail: s015@ipc.fukushima-u.ac.jp
bInstitute of Multidisciplinary Research for Advanced Materials, Tohoku University, 2-1-1 Katahira, Aoba-ku, Sendai 980-8577, Japan
cDepartment of Chemistry, Wake Forest University, P. O. Box 7486, Winston-Salem, North Carolina 27109, USA. E-mail: hinze@wfu.edu
First published on 15th September 2020
Abstract
The effective synthesis of highly concentrated and stable spherical silver nanoparticles (Ag-NPs) enclosed within microdomains formed by the Ag-NP induced self-assembly of zwitterionic surfactants is described. In this paper, the rapid and efficient synthesis of dispersed and stable Ag-NPs in zwitterionic surfactants, such as 3-(nonyldimethylammonio)- or 3-(decyldimethyl-ammonio)-propyl sulfate (C9– or C10–APSO4) that self-assemble in the presence of the Ag-NPs to form microdomains akin to microemulsions (ME) without the need of any organic solvent, co-surfactant or polymer is presented. Essentially all (>99.9%) of the synthesized Ag-NPs (TEM diameter 16.8 ± 4.3 nm) were incorporated and dispersed within the ME microdomains (213.5 ± 48.0 nm). A mechanism for formation of ME and its enclosing of the Ag-NPs in the ME is proposed.
1. Introduction
Self-assembling nanoparticles (NPs) on/in confined micro-domains, such as microparticles, microdroplets and emulsions have been intensely researched1 owing to their attractive chemical properties which improve the effectiveness of the resultant materials to function as catalysts,2 sensors,3 and medical agents.4 The synthesis of NPs on surfaces or inside micro-domains can have a positive influence on properties such as the reaction speed,2 efficiency,5 sensitivity,6 and enhance phenomenon such as emission.7 In particular, numerous reports focus on applications of silver (Ag)-NPs synthesized using microemulsion technology in various fields8,9 such as catalysis, nanoreactors, biology, medicine, optics, and electronics among others. Although it is difficult to control the size and homogeneity of Ag-NPs prepared by chemical reduction methods,10 utilization of surfactant oil-in-water (o/w) or water-in-oil (w/o) emulsion systems have proven beneficial in the synthesis of small and uniform Ag-NPs which were formed within the emulsion microdroplets.8,9 Bulavchenko et al. reported that the fabrication efficiency of Ag-NPs was enhanced by utilizing microemulsions relative to larger emulsions.11 Thus far, the microemulsion systems employed have been composed of water, water–immiscible organic solvent (oil), surfactant and in some cases, a co-surfactant or polymer.8,9Herein, we report the use of simple aqueous solutions of zwitterionic surfactants, such as 3-(nonyldimethylammonio)- or 3-(decyldimethyl-ammonio)-propyl sulfate (C9– or C10–APSO4), for the efficient synthesis of Ag-NPs. At concentrations greater than their critical micelle concentration (CMC), surfactants of this class are thermo-responsive and exist as a homogeneous aqueous micellar solution at temperatures above their upper critical solution temperature (UCST), whereas they phase separate at temperatures below the UCST to form a small surfactant-rich phase and a larger aqueous surfactant-poor phase.12–14 In this study, the surfactant concentrations were below the CMC values and at temperatures such that homogeneous solutions were formed in which the surfactant was initially present in its monomeric (molecular) form. During the course of the synthetic reaction at elevated temperature, these surfactants undergo induced self-assembly to form micro-domains (ME) in which the Ag-NPs are sequestered and dispersed in a manner akin to that observed in o/w microemulsions or swollen micelles except that no added organic solvent, co-surfactant or polymer is required.
2. Experimental
2.1. Instrumentation
Ultraviolet-visible spectra were obtained using a JASCO V-650 double beam spectrophotometer equipped with quartz cuvette (1 cm × 1 cm). The sample solution was measured without dilution. Dynamic light-scattering (DLS) measurements were performed using a HORIBA SZ-100 nanoparticle analyzer with a fluorescence analytical grade quartz cuvette (1 cm × 1 cm) at room temperature (25.0 °C) and green laser output at 532 nm and the measurement scattering angle set to 90°. DLS measurement of particle size is strongly influenced by the viscosity of sample solution. Thus, a sine-wave vibro viscometer SV-A (A&D Co. Ltd, Tokyo, Japan) was used to measure the viscosity of the sample solutions prior to the DLS measurement. The viscosity was then imputed as the parameter of DLS measurement. The hydrodynamic diameters reported are the mean diameters. Transmission electron microscopy (TEM) images were obtained using a JEOL JEM-1400plus transmission electron microscope (TEM; Tokyo, Japan) operating at 120 kV. The HD-2700 (Hitachi, Ltd) microscope was employed for the scanning TEM (STEM) analysis. The acceleration voltage was 200 kV at magnification between 30![[thin space (1/6-em)]](https://www.rsc.org/images/entities/char_2009.gif) 000 and 100000. The Octane T Ultra (AMETEK Co., Ltd) energy-dispersive X-ray (EDX) analyzer was used, which was connected to the STEM apparatus. TEM samples were prepared by placing 5.0 μL aliquots of the aqueous sample onto a carbon-filmed 200-mesh Cu grid (Nisshin EM Co. Ltd, Tokyo, Japan). After sample loading, the grids were dried at room temperature prior to the TEM measurements. The microemulsion size distribution was typically determined by measuring 20 such grids. Nanoparticles size distribution and concentration measurements were made using a ViewSizer3000 (HORIBA Ltd, Japan). The dimension of the cell was 10 × 10 × 45 mm with four-plane transmission (Hella Analytics, Germany). The measurement conditions were set temperature 22 °C, 3 lasers (450, 520, 650 nm) were used with the scattering angle set to 90°. The zeta potential measurements were made employing a Nano Z ZEN3600 Zetasizer (Malvern Instruments Ltd, Worcestershire, UK). The pH measurements were made using a HORIBA handy D-50 pH meter equipped with a long ToupH combination 9680-10D electrode. This electrode probe was employed to directly measure solution pH in the conical-shaped centrifuge tube. The conductivity measurements were made using a HORIBA handy D-74T water quality meter with a Conductivity Cell (Submersible Type) 9382-10D electrode. This electrode was employed to directly measure solution conductivity in the centrifuge tube.
000 and 100000. The Octane T Ultra (AMETEK Co., Ltd) energy-dispersive X-ray (EDX) analyzer was used, which was connected to the STEM apparatus. TEM samples were prepared by placing 5.0 μL aliquots of the aqueous sample onto a carbon-filmed 200-mesh Cu grid (Nisshin EM Co. Ltd, Tokyo, Japan). After sample loading, the grids were dried at room temperature prior to the TEM measurements. The microemulsion size distribution was typically determined by measuring 20 such grids. Nanoparticles size distribution and concentration measurements were made using a ViewSizer3000 (HORIBA Ltd, Japan). The dimension of the cell was 10 × 10 × 45 mm with four-plane transmission (Hella Analytics, Germany). The measurement conditions were set temperature 22 °C, 3 lasers (450, 520, 650 nm) were used with the scattering angle set to 90°. The zeta potential measurements were made employing a Nano Z ZEN3600 Zetasizer (Malvern Instruments Ltd, Worcestershire, UK). The pH measurements were made using a HORIBA handy D-50 pH meter equipped with a long ToupH combination 9680-10D electrode. This electrode probe was employed to directly measure solution pH in the conical-shaped centrifuge tube. The conductivity measurements were made using a HORIBA handy D-74T water quality meter with a Conductivity Cell (Submersible Type) 9382-10D electrode. This electrode was employed to directly measure solution conductivity in the centrifuge tube.
2.2. Materials
All chemicals and reagents were used without any further purification, unless otherwise noted. N,N-Dimethyldecylamine (>95.0%) was purchased from Tokyo Chemical Industry Co., Ltd (Japan). Trimethylene sulphate (98%) was obtained from Combi-Blocks, Inc. (USA). Acetone (≥99.5%), trisodium citrate dihydrate (≥99.0%), sodium hydroxide (≥97.0%) and diethyl ether (≥99.5%) were acquired from FULIFILM Wako Chemicals Co. (Japan). Silver nitrate (≥99.0%) was obtained from Sigma-Aldrich (USA). Distilled water was obtained using a water purification apparatus RFD240NA (ADVANTEC, Japan).The zwitterionic surfactants, C10–APSO4, C9–APSO4 and C8–APSO4 were synthesized using published literature procedures.12,14
2.3. Procedures
 was made and the CMC was determined from the inflection point of the curve.
3. Results and discussion
3.1. Synthesis and characterization
The Ag-NPs prepared in the ME appeared as a yellow homogeneous solution (see inset to Fig. 1A) and exhibited a surface plasmon resonance (SPR) absorption band at 401.5 nm (Fig. 1A solid red line) with the peak width at half maximum (PWHM) of 95 nm. The TEM images indicate that the Ag-NPs are monodisperse and roughly spherical-shaped in the ME, which is composed of the surfactant C10–APSO4 (Fig. 1B). Furthermore, STEM-EDX mapping (Fig. S1 in ESI†) confirmed that the Ag-NPs were dispersed in the C10–APSO4 surfactant ME microdomains. The mean diameter of the Ag-NPs in the ME was 16.8 ± 4.3 nm (n = 50) as determined from the TEM images, whereas the average hydrodynamic diameter obtained from DLS was 55.3 ± 46.3 nm (Fig. 1C). Essentially all (>99.9%) of the synthesized Ag-NPs were incorporated and dispersed within the ME. The size of the ME microdomains was determined as 213.5 ± 48.0 nm (n = 25; dry state) from the TEM image. On conducting the synthetic protocol in the absence of C10–APSO4, flocculation (aggregation) of the Ag-NPs occurred (Fig. 1A dotted red line). We propose that the surfactant adsorbs onto the surface of Ag-NPs providing a capping layer, which stabilizes the Ag-NPs and mediates their growth.8 In the absence of Cn–APSO4 surfactant, no such confinement of growth occurs and the resultant NPs are not uniform and unstable. A typical Ag-NP synthesis by the citric acid method (without surfactant) was reported as yielding a range of Ag-NP sizes (10–200 nm) with their SPR bands (λmax) ranging from 397 to 427 nm.12 For comparison, the previously PWHM (near 130 nm) and size distribution (89.6 ± 94.6 nm)15 which are larger than those of the Ag-NPs synthesized in this work (Fig. 1A and C dotted black lines). The smaller number of λmax and PWHM represents a smaller size and more uniformed size distribution for the Ag-NPs.15,16 | ||
| Fig. 1 Characterization of the Ag-NPs in ME. Panel [A] shows a photograph of the solution containing Ag-NPs and the UV-visible absorption spectra of Ag-NPs prepared by this method in the presence (solid red line) and absence of the surfactant (red dotted line). The black dotted line is spectra of Ag-NPs obtained using a typical citric acid reductant method.17 Panel [B] shows transmission electron microscopy (TEM) image of Ag-NPs in the (ME). Panel [C] shows the dynamic light scattering (DLS) profile of the Ag-NPs prepared by this method (red line) and a typical citric acid reductant method17 (black dotted line). Panel [D] shows the NP tracking analyzer (NTA) profile which indicates the presence of both the Ag-NPs (mode diameter 28 nm) and the ME (mode diameter 110 nm). Experimental conditions: [C10–APSO4]T = 0.20% (w/w); [AgNO3]T = 0.11 mM; [trisodium citrate]T = 1.10 mM; [NaOH]T = 0.010 mM; total volume = 2.25 mL; pH = 11; reaction time: 8 min at 108 °C. TEM voltage 120 kV (30k to 50k magnification). | ||
The NTA profile (Fig. 1D) indicates the presence of two major size distributions (37 ± 12 and 162 ± 87 nm). The two peaks correspond to the values obtained from DLS (33 nm, modal Ag-NP diameter) and TEM (213.5 ± 48.0 nm as dried ME). As ME liquid droplets were dried for TEM observation, the apparent diameter (after drying) in the TEM image is larger than that of the dispersive state in NTA. This method of synthesizing Ag-NPs in an ME serves to regulate the size (57.7 to 72.1 nm; described in the Section 3.2) and shape (spherical) of the NPs. NTA indicated that the number of Ag-NPs and ME clusters were 6.2 ± 109 and 8.5 ± 107 particle per mL, respectively. The resultant concentration for Ag-NPs in ME was 73 particle/ME, whereas the mean apparent concentration of the Ag-NPs in ME was 15 ± 10 particle/ME (n = 50) as determined from TEM images (max. frequency).
3.2. Effect of the concentration of Ag+ ion
Fig. 2 shows the relationships between the concentration of Ag+ and the diameter of the Ag-NPs and their concentration in the ME. Although the formed Ag-NPs (average size) only slightly decreased (from 72.1 to 57.7 nm) with increases in the silver ion concentration (Fig. 2 blue line), the uncertainties associated with these values were ca. 25%. Thus, there was no appreciably difference in the size of Ag-NPs with variations in the concentration of Ag+ ion. Thus, this method can synthesize a specific sized Ag-NP in the C10–APSO4 ME. This is in contrast to a literature report in which the Ag-NPs size typically increased with an increase in [Ag+].8 The concentration of Ag-NPs in the ME increases with concentration of Ag+ (Fig. 2 red line). At concentrations > 0.22 mM AgNO3, formation of agglomerated or aggregated Ag-NPs resulted owing to saturation. The ME size is also impacted by the silver ion concentration (Fig. 2, green line). Over the concentration range examined, the size of ME increases from ca. 100 to 200 nm with increases in [Ag+]. This result suggests that the presence of Ag+ is an important factor in the formation of the ME. No ME formation was observed in a mixture of Ag+ and C10–APSO4 surfactant without citric acid (reducing agent). This indicates that the formation of the surfactant ME microdomains is related to the presence of Ag-NP precursor. The precursor functions to induce assembly of surfactant monomers initially present in solution to form aggregates with microdomains which mimic the behavior of a microemulsion (ME). It is important to note that no such ME formed if pre-prepared citrate coated Ag-NPs were used instead of Ag+ (i.e. AgNO3) in the described procedure as the Ag-NPs existed in an as-dispersed state in solution. It is considered that rapid exchange of Cn–APSO4 surfactant with the pre-coated citric acid Ag-NPs is difficult resulting in the absence of a surfactant capping layer on the Ag-NPs. | ||
| Fig. 2 Influence of the variation of Ag+ concentration upon the Ag-NP particle size (blue line) and surfactant ME diameter (green line) as well as the Ag-NP concentration in the ME (red line). Experimental conditions: [C10–APSO4]T = 0.20% (w/w); [trisodium citrate]T = 1.10 mM; [NaOH]T = 0.010 mM; total volume = 2.25 mL; pH = 11; reaction time: 8 min at 108 °C. Diameters and concentrations determined from replicate (n = 10) DLS and TEM measurements, respectively. | ||
3.3. Impact of the concentration of citrate ions and pH
The effect of the citrate ion concentration upon the size and concentration of the Ag-NPs in the ME was briefly examined. The results (Fig. S2 in ESI†) indicate that at citrate concentrations > ca. 1.0 mM, the concentration of Ag-NPs in the ME noticeably decreased and their size increased (due to aggregation). The results suggest that citrate functions as a reductant; however, at higher concentrations, it is not only a reductant but also a dispersing agent. The pH impact on the fabrication of both Ag-NP and ME is shown in Fig. S3 in ESI.† The formation of Ag-NPs in the ME was only observed at pH 11. Dong et al. reported that the fabrication rate of Ag-NPs at pH 11 was faster than other pH values (citric acid reduction method) owing to the reduction activity.17 Perhaps the rate of the surfactant binding onto the precursor of Ag-NPs is faster than that of citric acid (as capping agent). At pH values > 11 Ag-NP, synthesis is difficult due to formation of AgOH (Ksp = 2 × 10⁻⁸).183.4. Effect of surfactant and impact on ME production
The preparation of dispersed Ag-NPs in the ME was successful using both C9– and C10–APSO4 as surfactants (Fig. 3). The number of Ag-NPs in the ME was essentially the same (15 ± 4 for C9–APSO4 and 15 ± 10 for C10–APSO4). The diameter of the Ag-NPs in the C9–APSO4 and C10–APSO4 MEs were also very similar. The ME size was 100 ± 31 nm (from TEM image) for C9–ASPO4 which is smaller than that of C10–APSO4. However, use of the shorter carbon chain surfactant, (C8–APSO4), only resulted in the formation of Ag-NP aggregates (Fig. 3C). It should be noted that the diameters of the C9– and C10–APSO4 ME aggregates containing the dispersed Ag-NPs are much greater relative to normal micelles formed from similar zwitterionic sulfobetaine surfactants.19,20 For instance, the surfactant SB3-10 (same formula as C10–APSO4 except the terminal anionic group is sulfonate, –SO3, rather than sulfate) has a diameter of only 2–4 nm.19,20 | ||
| Fig. 3 TEM images of the Ag-NPs formed using three different zwitterionic surfactants in the synthetic procedure: [A] C10–APSO4. [B] C9–APSO4. [C] C8–APSO4. | ||
Although a Cn–APSO4 surfactant is neutral overall, the zeta-potential of the solution including this surfactant at pH 3 (without Ag-NPs) was determined to be +23.2, +10.2 and −20.0 mV for C8–, C9–, and C10–APSO4 respectively. These values are in the range of reported values for other zwitterionic surfactant systems which can range from slightly positive to −70 mV depending upon the type and concentration of added salts and pH.20–23 The bipolar ionic moiety of the zwitterionic surfactants can interact with the uncapped or citrate capped Ag-NPs and the values become more negative, i.e., −89 ± 12 mV for C10–APSO4 at pH 11. A similar phenomenon was reported for the potential of a NP-surfactant bilayer composite, in which the potential was gradually decreased by the surfactant-coating on metallic NPs from 0 mv to −57.9 mV.24,25 Taking into account the fact that the zeta potentials for zwitterionic surfactant systems (as well as citrate coated Ag-NPs themselves) decrease with increases in solution pH, the zeta potential obtained for the C10–APSO4/Ag-NP ME in this work is reasonable and in the general range reported for Au- and Ag-NPs dispersed or capped with other zwitterionic species.13,26,27
The C10–APSO4 concentration range that allows formation of the ME for the synthesis of Ag-NPs as reported is rather limited. The upper concentration is dictated by the phase separation behavior (UCST) exhibited by this surfactant. As shown (Fig. S4 in ESI†), at concentrations ≥ 0.6 w/w% (18.5 mM), a heterogeneous solution results which phase separates (the volume of the surfactant-rich phase formed is indicated in the figure in the presence and absence of Ag-NPs). In addition, the concentration of the surfactant needs to be smaller than the CMC at the final temperature in the procedure (25 °C). The CMC was 0.24w/w% (7.4 mM) at 25 °C (Fig. S5; green line in ESI†). In addition, the CMC value modestly increased with the formation of Ag-NPs as shown in Fig. 4, whereas the presence of Ag+ (at any concentration) did not affect the CMC values (Fig. 4, supported by Fig. S6 in ESI†). The CMCs of a homologous series of zwitterionic surfactants in water are temperature dependent; namely, as the temperature is increased, an initial slight decrease in the CMC value is observed until a minimum value is reached after which the CMCs start to increase with temperature.28–30 The CMC of C10–APSO4 increased with temperature (i.e. 0.24 w/w%, 0.38 w/w%, and 0.44w/w% for 25 °C, 35 °C, and 42 °C, respectively; Fig. S5 in ESI†).
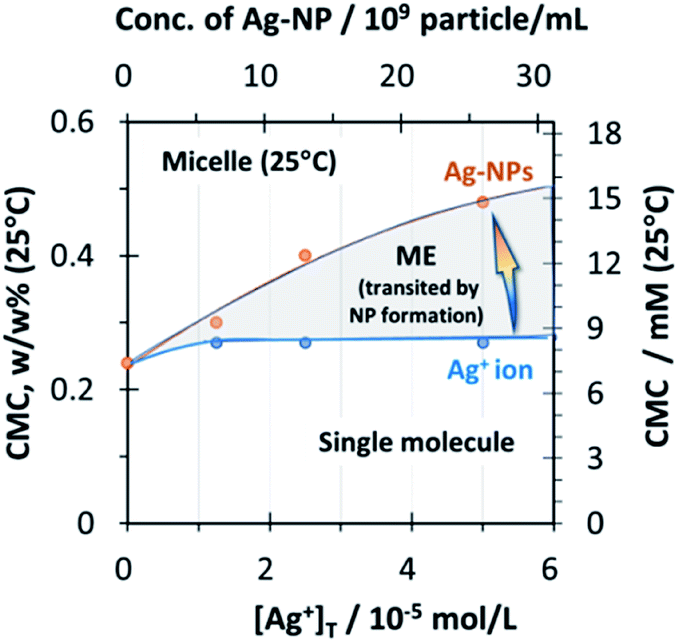 | ||
| Fig. 4 The transition of critical micelle concentration (CMC) values in the presence of Ag+ (blue line) and Ag nanoparticles (orange line). | ||
3.5. Mechanism
Fig. 5 illustrates a potential mechanism for fabrication of the Ag-NPs in the C9– or C10–APSO4. Initially, the surfactants exist in solution in monomeric form along with the Ag+ ion reactant (stage I). As citrate ion is added, silver ion is converted to Ag-NPs to which the bipolar zwitterionic surfactant head group bind at a faster rate relative to the citrate ions (stage II). Several Ag-NPs can then interact with each other via hydrophobic interactions; i.e., the alkyl chain of one surfactant coated Ag-NP interacts with that of another (or several) other such coated Ag-NPs (stage III). Lastly, the exterior of such self-assembled zwitterionic surfactant microdomains or clusters (i.e., the alkyl chain of the coated Ag-NPs) can interact with the alkyl chain of the monomeric surfactants such that the self-assembled microdomains then has the bipolar zwitterionic group in contact with the bulk water solvent (stage IV). The formation of such zwitterionic surfactant coated (monolayer or bilayer) individual metal NPs or citrate coated NPs has literature precedence.21–23,31 In this work, it appears that the entire exterior of the C10–APSO4–Ag-NP microdomains (clusters) are thus coated as well, mimicking an oil-in-water microemulsion system that houses the dispersed Ag-NPs.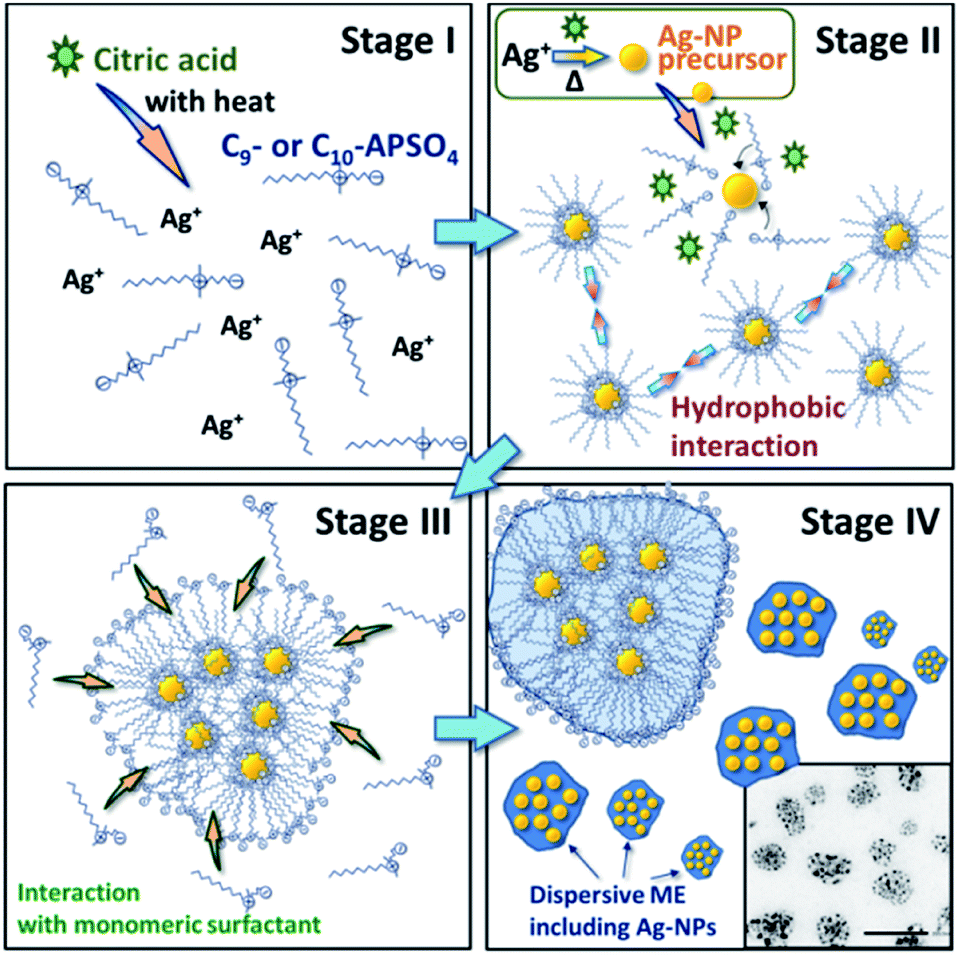 | ||
| Fig. 5 Illustration of the possible mechanism of fabrication of dispersive ME enclosed Ag-NPs, prepared by following the synthetic procedure (see Section 2.3.3). | ||
4. Conclusions
In summary, the rapid and efficient synthesis of dispersed and stable Ag-NPs in zwitterionic Cn–APSO4 surfactants that self-assemble in the presence of the Ag-NPs to form microdomains akin to microemulsions without the need of any organic solvent or co-surfactant was developed. Essentially all the Ag-NPs were present within the ME. The effects of silver ion concentration and pH upon the size and concentration of the Ag-NPs were assessed. In addition, the concentration of the surfactant, its zeta-potential, and the variation of CMC was investigated. The mechanism for the formation of ME and the enclosing of Ag-NPs in the ME was presented. It is thought that the Ag-NPs in the surfactant ME could potentially be employed as a suitable surfactant-based dispersion solution for different applications.Conflicts of interest
There are no conflicts to declare.Acknowledgements
The authors gratefully acknowledge funding from the Japan Atomic Energy Agency (JAEA) Nuclear Energy S&T and Human Resource Development Project through concentrating wisdom Grant Number JPJA19H19210081 and Japan Society for the Promotion of Science (JSPS) Grant-in-Aid for Scientific Research(B) JP20H04352.Notes and references
- N. Yan, Y. Zhu and W. Jiang, Chem. Commun., 2018, 54, 13183–13195 RSC.
- Y. Zhao, X. Ni, S. Ye, Z.-G. Gu, Y. Li and T. Ngai, Langmuir, 2020, 36, 2037–2043 CrossRef CAS.
- Y. Liu, A. Teitelboim, A. Fernandez-Bravo, K. Yao, M. V. P. Altoe, S. Aloni, C. Zhang, B. E. Cohen, P. J. Schuck and E. M. Chan, ACS Nano, 2020, 14, 1508–1519 CrossRef CAS.
- F. Huang, Y. Gao, Y. Zhang, T. Cheng, H. Ou, L. Yang, J. Liu, L. Shi and J. Liu, ACS Appl. Mater. Interfaces, 2017, 9, 16880–16889 CrossRef CAS.
- M. B. Schütz, K. Lê, S. Ilyas and S. Mathur, Langmuir, 2020, 36, 1552–1558 CrossRef PubMed.
- A. Del Tedesco, V. Piotto, G. Sponchia, K. Hossain, L. Litti, D. Peddis, A. Scarso, M. Meneghetti, A. Benedetti and P. Riello, ACS Appl. Nano Mater., 2020, 3, 1232–1241 CrossRef CAS.
- L. Bao, H. You, L. Wang, L. Li, R. Qiao, Y. Zhang, Y. Zhong, Y. Xiong and Z. Li, J. Mater. Chem. C, 2014, 2, 8949–8955 RSC.
- J. N. Solanki and Z. V. P. Murthy, Ind. Eng. Chem. Res., 2011, 50, 12311–12323 CrossRef CAS.
- M. Sanchez-Dominguez, K. Pemartin and M. Boutonnet, Curr. Opin. Colloid Interface Sci., 2012, 17, 297–305 CrossRef CAS.
- H. D. Beyene, A. A. Werkneh, H. K. Bezabh and T. G. Ambaye, Sustain. Mater. Technol., 2017, 13, 18–23 CAS.
- A. I. Bulavchenko, A. T. Arymbaeva, M. G. Demidova, P. S. Popovetskiy, P. E. Plyusnin and O. A. Bulavchenko, Langmuir, 2018, 34, 2815–2822 CrossRef CAS PubMed.
- T. Saitoh and W. L. Hinze, Anal. Chem., 1991, 63, 2520–2525 CrossRef CAS PubMed.
- Y. Takagai, R. Miura, A. Endo and W. L. Hinze, Chem. Commun., 2016, 52, 10000–10003 RSC.
- P. G. Nilsson, B. Lindman and R. G. Laughlin, J. Phys. Chem., 1984, 88, 6357–6362 CrossRef CAS.
- N. G. Bastús, F. Merkoçi, J. Piella and V. Puntes, Chem. Mater., 2014, 26, 2836–2846 CrossRef.
- L. Mulfinger, S. D. Solomon, M. Bahadory, A. V. Jeyarajasingam, S. A. Rutkowsky and C. Boritz, J. Chem. Educ., 2007, 84, 322 CrossRef.
- X. Dong, X. Ji, H. Wu, L. Zhao, J. Li and W. Yang, J. Phys. Chem. C, 2009, 113, 6573–6576 CrossRef CAS.
- The Chemical Society of Japan, Handbook of Chemistry: Pure Chemistry, Maruzen Pubulication, Tokyo, 5th edn, 2004 Search PubMed.
- J. Wang, O. Morales-Collazo and A. Wei, ACS Omega, 2017, 2, 1287–1294 CrossRef CAS PubMed.
- D. P. Santos and R. L. Longo, J. Phys. Chem. B, 2016, 120, 2771–2780 CrossRef CAS.
- F. D. Souza, B. S. Souza, D. W. Tondo, E. C. Leopoldino, H. D. Fiedler and F. Nome, Langmuir, 2015, 31, 3587–3595 CrossRef CAS.
- J. P. Priebe, F. D. Souza, M. Silva, D. W. Tondo, J. M. Priebe, G. A. Micke, A. C. O. Costa, C. A. Bunton, F. H. Quina, H. D. Fiedler and F. Nome, Langmuir, 2012, 28, 1758–1764 CrossRef CAS PubMed.
- C. Yao, P. Wang, L. Zhou, R. Wang, X. Li, D. Zhao and F. Zhang, Anal. Chem., 2014, 86, 9749–9757 CrossRef CAS.
- A. Sambasivam, A. V. Sangwai and R. Sureshkumar, Langmuir, 2016, 32, 1214–1219 CrossRef CAS PubMed.
- E. K. Perttu and F. C. Szoka, Chem. Commun., 2011, 47, 12613 RSC.
- Z. Qiao, Y. Yao, S. Song, M. Yin and J. Luo, J. Mater. Chem. B, 2019, 7, 830–840 RSC.
- T. C. Prathna, N. Chandrasekaran and A. Mukherjee, Colloid. Surface. Physicochem. Eng. Aspect., 2011, 390, 216–224 CrossRef CAS.
- N. Muller, Langmuir, 1994, 10, 2202–2205 CrossRef CAS.
- E. Sikorska, D. Wyrzykowski, K. Szutkowski, K. Greber, E. A. Lubecka and I. Zhukov, J. Therm. Anal. Calorim., 2016, 123, 511–523 CrossRef CAS.
- C. Brinatti, L. B. Mello and W. Loh, Langmuir, 2014, 30, 6002–6010 CrossRef CAS.
- H. D. Fiedler, E. E. Drinkel, B. Orzechovicz, E. C. Leopoldino, F. D. Souza, G. I. Almerindo, C. Perdona and F. Nome, Anal. Chem., 2013, 85, 10142–10148 CrossRef CAS PubMed.
Footnote |
| † Electronic supplementary information (ESI) available: The elemental mapping; the impact of citric acid concentration; absorption spectra; the relationship between the surfactant concentration and the volume of second phase; relationship between the conductivity and the concentration of C10–APSO4 surfactant; the relationship between the C10–APSO4 surfactant and conductivity. See DOI: 10.1039/d0ra06824a |
| This journal is © The Royal Society of Chemistry 2020 |