
 Open Access Article
 This Open Access Article is licensed under a Creative Commons Attribution-Non Commercial 3.0 Unported Licence
Novel porous iron phthalocyanine based metal–organic framework electrochemical sensor for sensitive vanillin detection†
Jinyun Peng *a,
Liying Weiab,
Yuxia Liuc,
Wenfeng Zhugea,
Qing Huanga,
Wei Huanga,
Gang Xianga and
Cuizhong Zhanga
*a,
Liying Weiab,
Yuxia Liuc,
Wenfeng Zhugea,
Qing Huanga,
Wei Huanga,
Gang Xianga and
Cuizhong Zhanga
aCollege of Chemistry and Chemical Engineering, Guangxi Normal University for Nationalities, Chongzuo 532200, China. E-mail: pengjinyun@yeah.net; Fax: +86 771 7870799; Tel: +86 771 7870653
bSchool of Pharmacy, Henan University of Traditional Chinese Medicine, Zhengzhou 450046, China
cCollege of Physics and Electronic Engineering, Guangxi Normal University for Nationalities, Chongzuo 532200, China
First published on 6th October 2020
Abstract
Vanillin is widely used as a flavor enhancer and is known to have numerous other interesting properties, including antidepressant, anticancer, anti-inflammatory, and antioxidant effects. However, as excess vanillin consumption can affect liver and kidney function, simple and rapid detection methods for vanillin are required. Herein, a novel electrochemical sensor for the sensitive determination of vanillin was fabricated using an iron phthalocyanine (FePc)-based metal–organic framework (MOF). Scanning electron microscopy and transmission electron microscopy showed that the FePc MOF has a hollow porous structure and a large surface area, which impart this material with high adsorption performance. A glassy carbon electrode modified with the FePc MOF exhibited good electrocatalytic performance for the detection of vanillin. In particular, this vanillin sensor had a wide linear range of 0.22–29.14 μM with a low detection limit of 0.05 μM (S/N = 3). Moreover, the proposed sensor was successfully applied to the determination of vanillin in real samples such as vanillin tablets and human serum.
1. Introduction
Vanillin (4-hydroxy-3-methoxybenzaldehyde), the major component of Vanilla planifolia, a large orchid plant, is mainly derived from vanilla beans or pods.1 Due to the unique aromatic properties, vanillin is one of the most commonly produced spices globally, and it is widely used as a flavor enhancer for candy, ice cream, wine, and other food products.2 In addition, vanillin has been found to have antidepressant, anticancer, anti-inflammatory, and antioxidant effects, and shows potential as a food preservative.3–6 However, excessive vanillin intake can affect liver and kidney function, causing symptoms such as headaches, nausea, and vomiting.7 Therefore, it is necessary to develop simple and rapid detection methods for vanillin.Various analytical methods have been developed for the determination of vanillin, including gas chromatography–mass spectrometry, high-performance liquid chromatography, thin-layer chromatography, capillary electrophoresis, and UV-Vis spectrometry.8–12 Despite the good selectivity and high accuracy of these methods, they are time-consuming and costly, and most require complicated sample pretreatment before analysis. In recent years, electrochemical (EC) methods have attracted extensive attention because of their high sensitivity, high selectivity, low cost, fast response, and operational simplicity. As vanillin has electrochemically active groups, it can be detected electrochemically. However, there are few studies on the electrochemical detection of vanillin, mainly because the overpotential for vanillin oxidation on a bare electrode is too high and the easy adsorption of the oxidation products on the electrode surface causes electrode poisoning.13 These issues could be overcome via electrode modification. Therefore, it is important to develop new chemically modified electrodes for the sensitive detection of vanillin.
Metal–organic frameworks (MOFs) are porous crystalline materials with periodic network structures formed by metal ions/clusters and organic ligands connected through coordination bonds.14–16 MOFs, which have the advantages of large specific surface areas, high porosities, and adjustable pore sizes, have been widely studied in fields such as energy storage, gas storage and separation, catalysis, and sensors.16–20 The advantageous characteristics of MOFs combined with the simplicity, low cost, and high sensitivity of electrochemical sensors has made the development of MOF-based electrochemical sensors of particular recent interest.21–24
Phthalocyanine, one of the most investigated functional organic materials, has a two-dimensional conjugated macrocyclic structure with 18π electrons that is composed of four isoindole rings connected by nitrogen atoms.25–27 The phthalocyanine structure is similar to the porphyrin structure, but phthalocyanine is easier to synthesize. In addition, the application range of phthalocyanine exceeds that of porphyrin owing to the enhanced stability, spectral characteristics, coordination characteristics, and structural flexibility of phthalocyanine.28 Phthalocyanine can coordinate different metals to form metal phthalocyanine (MPc) complexes, which have unique electronic and optical properties, including good electron-transfer performance and redox activity.28–31 In addition, phthalocyanine derivatives, in which hydrogen on the phthalocyanine benzene rings is substituted with functional groups such as amino carboxyl, or nitro groups, can exhibit increased reactivity for MPc formation and expand the application field.32–34 Owing to their unique structures and various functional properties, including excellent semiconductor properties and catalytic activities, MPc derivatives have been widely used in various fields including catalysis, sensors, and photodynamic therapy.35–42 Due to its redox activity, catalytic activity, and carrier transport ability result from the extended π-system, MPc complexes have been used as the linking units in 2D MOFs, which show good stability, conductivity, redox activity, and electrocatalytic activity.43–45
Here, we developed a novel electrochemical sensor based on an iron phthalocyanine (FePc) MOF for the sensitive detection of vanillin. The electrochemical behavior of vanillin on a glassy carbon electrode (GCE) modified with the FePc MOF was systematically investigated, and the developed sensor was applied to the detection of vanillin in real samples such as vanillin tablets and human serum. To the best of our knowledge, this is the first example of an electrochemical sensor based on a phthalocyanine derived MOF.
2. Experimental
2.1 Reagents and apparatus
Trimellitic anhydride, urea, anhydrous FeCl3, ammonium molybdate, trifluoroacetic acid (TFA), iron(III) nitrate nonahydrate (Fe(NO3)3·9H2O), sodium acetate trihydrate (NaOOCCH3·3H2O), and N,N-dimethylformamide (DMF) were purchased from Aladdin Reagent Co., Ltd. (Shanghai, China). Britton–Robinson (B–R) buffer solutions (0.1 M) with different pH values were prepared by mixing stock solutions of 0.04 M H3PO4, H3BO3, CH3COOH, and 0.2 M NaOH. All reagents were of analytical grade and used directly without further purification. Double distilled water was used in all experiments.All electrochemical measurements were performed on a CHI 760E electrochemical workstation (Shanghai Chenhua Instrument Co., Ltd., Shanghai, China) using a GCE working electrode, Pt counter electrode, and Ag/AgCl reference electrode. The FePc MOF material was characterized using scanning electron microscopy (SEM, Hitachi S-4800, Tokyo, Japan; 15 kV), transmission electron microscopy (TEM, JEM 2100, JEOL, Japan; 200 kV), Fourier transform infrared (FT-IR) spectroscopy (Spectrum 65, PerkinElmer, Waltham, USA), X-ray diffraction (XRD, D8 advance, Bruker, Germany) and X-ray photoelectron spectroscopy (XPS, K-Alpha, Thermo Scientific, USA).
2.2 Synthesis of materials
2.3 Preparation of modified electrode
Prior to modification, the GCE was polished with 0.3 and 0.05 μm alumina slurries to remove adsorbed organic substances and then washed by sonication in ethanol and double distilled water. The FePc MOF (1.5 mg) was dispersed in 1 mL of DMF under sonication for 40 min. Next, 3 μL of 1.5 mg mL−1 FePc MOF suspension was dropped onto the surface of GCE and dried under infrared light to prepare FePc MOF/GCE. Scheme 1 illustrates the Fabrication of FePc MOF/GCE modified electrode and electrochemical determination of vanillin.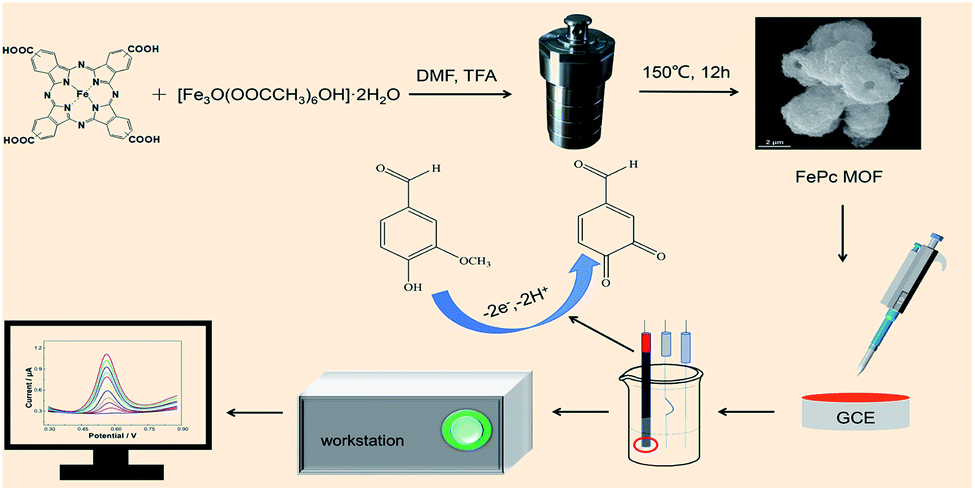 | ||
| Scheme 1 Fabrication of FePc MOF/GCE modified electrode and electrochemical determination of vanillin. | ||
2.4 Preparation of samples
Vanillin tablets were obtained from China Pharmaceutical University Pharmaceutical Co., Ltd. (0.2 g × 36 tablets). Twenty tablets were ground into a fine powder. Then, a precisely weighed amount of powder (∼0.2 g vanillin) was dissolved in ethanol. After filtering the solution, 5 mL of the filtrate was diluted 50 times with ethanol. The human serum samples, which were collected from Chongzuo People's Hospital (Guangxi, China), were mixed with anhydrous ethanol at 1![[thin space (1/6-em)]](https://www.rsc.org/images/entities/char_2009.gif) :3 (v/v) and centrifuged at 10000 rpm for 10 min.
:3 (v/v) and centrifuged at 10000 rpm for 10 min.
3. Results and discussion
3.1 Characterization of FePc-based MOF
The surface morphology of the FePc MOF was characterized using SEM and TEM (Fig. 1). The SEM image (Fig. 1A) indicates that the FePc MOF material has a hollow porous structure, which was further confirmed by the hollow structure (Fig. 1B) and pore structure (Fig. 1C) observed in the TEM images. Fig. 1D shows the FT-IR spectra of FePc and the FePc MOF. For FePc (Fig. 1D, red), the peak at 1698 cm−1 corresponds to the telescopic vibration absorption peak of C![[double bond, length as m-dash]](https://www.rsc.org/images/entities/char_e001.gif) O, whereas the peaks at 1333, 1147, 1086, 857, and 739 cm−1 are assigned to the characteristic absorption peaks of the phthalocyanine macroring. Similar peaks are observed for the FePc MOF (Fig. 1D, black) but the intensities are reduced.
O, whereas the peaks at 1333, 1147, 1086, 857, and 739 cm−1 are assigned to the characteristic absorption peaks of the phthalocyanine macroring. Similar peaks are observed for the FePc MOF (Fig. 1D, black) but the intensities are reduced.
 | ||
| Fig. 1 (A) SEM and (B and C) TEM images of FePc MOF. (D) FT-IR spectra of FePc (red) and FePc MOF (black). | ||
XPS was used to analyze the chemical composition of FePc MOF, and the results showed the presence of C, N, O, Fe, and F elements in the sample (Fig. S1A†). In the Fe 2p spectrum (Fig. S1B†), two sets of peaks at 710.9 and 724.8 eV, assignable to Fe 2p3/2 and Fe 2p1/2, respectively, revealing the oxidation state of +3 for Fe in the FePc MOF.47 Moreover, the two satellite peaks at 718.8 and 733.1 eV, which further proves the existence of Fe3+. Fig. S1D† shows The XRD pattern of FePc MOF (black curve). The diffraction peaks are consistent with the simulation results (red curve).
3.2 Electrochemical behavior of FePc MOF
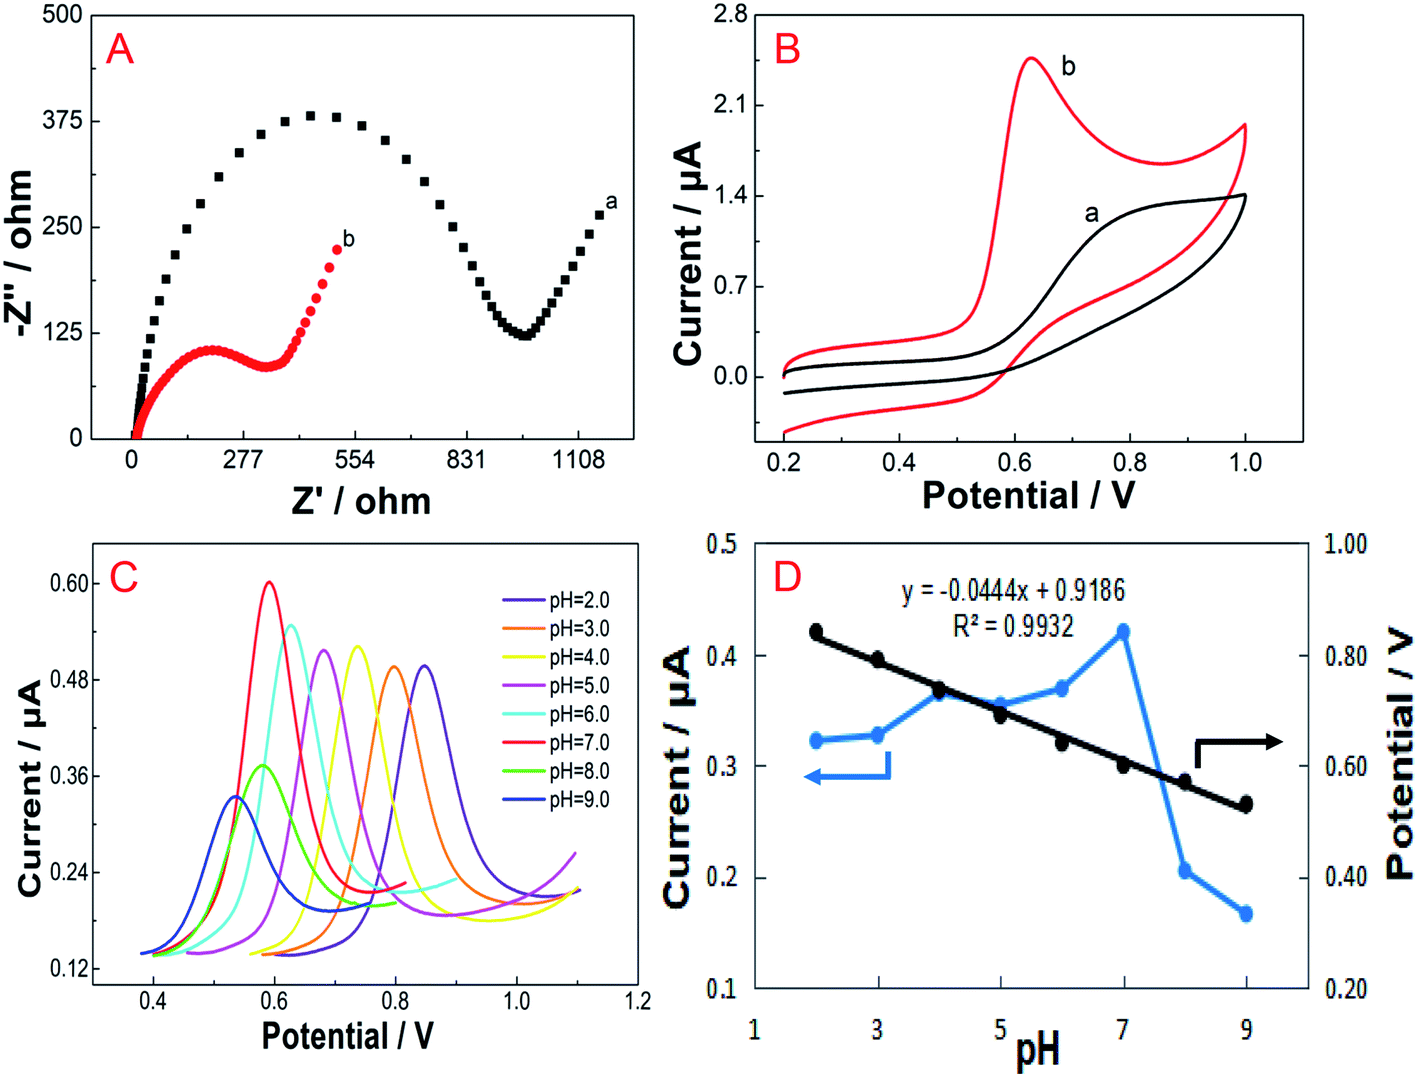 | ||
| Fig. 2 (A) Nyquist plots for bare GCE (a) and FePc MOF/GCE (b) in 1.0 mM [Fe(CN)6]3−/4− (K3Fe(CN)6/K4Fe(CN)6 = 1:1, containing 0.1 M KCl). (B) Cyclic voltammograms of 65.46 μM vanillin on bare GCE (a) and FePc MOF/GCE (b) in B–R buffer (pH 7.0). Scan rate = 0.1 V s−1. (C) Differential pulse voltammograms of 15 μM vanillin in 0.1 M B–R buffer at different pH values (2.0–9.0) obtained using the FePc MOF/GCE and (D) changes in the oxidation peak current and potential as a function of pH. | ||
3.3 Effect of pH
The electrochemical responses of vanillin on the FePc MOF/GCE in B–R buffer solutions at pH 2.0–9.0 were studied using differential pulse voltammetry (DPV), as shown in Fig. 2C. The oxidation peak current of vanillin increases slowly from pH 2.0 to 6.0, reaches a maximum value at pH 7.0, and then gradually decreases from pH 7.0 to 9.0. Therefore, pH 7.0 B–R buffer was selected for vanillin analysis. In addition, as the pH value increases from 2.0 to 9.0, the oxidation peak potential (Ep, V) obviously decreases, indicating that protons participate in the oxidation reaction. A linear relationship was observed between Ep and pH, as described by the equation Ep = 0.9186 − 0.0444 pH (R2 = 0.9932) (Fig. 2D). The slope of −44.4 mV pH−1 demonstrated that the numbers of transferred protons and electrons are the same during the electrochemical oxidation of vanillin.3.4 Effect of scan rate
Determining the influence of the scan rate on electrochemical behavior is an effective method for exploring the mechanism of an electrode surface reaction. The effect of the scan rate on the electrochemical performance of the FePc MOF/GCE for the oxidation of vanillin was investigated using CV (Fig. 3). In B–R buffer (pH 7.0), the oxidation peak current (Ip) of vanillin exhibits a good linear relationship with the scan rate (v) in the range of 0.01–0.1 V s−1, as described by the equation Ip = 0.3233 + 5.630v (R2 = 0.9911). This result indicates that the oxidation of vanillin on the surface of the FePc MOF/GCE is a typical adsorption-controlled process. | ||
| Fig. 3 Cyclic voltammograms of FePc MOF/GCE in 0.1 M B–R buffer (pH 7.0) containing 15 μM vanillin collected at different scan rates (0.01–0.1 V s−1). Inset a: linear relationship between the oxidation current (Ip) and the scan rate (v). Inset b: linear relationship between the oxidation peak potential (Ep) and the natural logarithm of the scan rate (lnv). | ||
In addition, the oxidation peak potential (Ep) is shifted positively as the scan rate increased, which indicates that the oxidation process is irreversible. The linear relationship between the oxidation peak potential and the natural logarithm of the scan rate (lnv) can be expressed as Ep = 0.0219(lnv) + 0.7044 (R2 = 0.9933). For an irreversible and adsorption-controlled oxidation process, the correlation between the Ep and lnv can be described using Laviron's theory:49

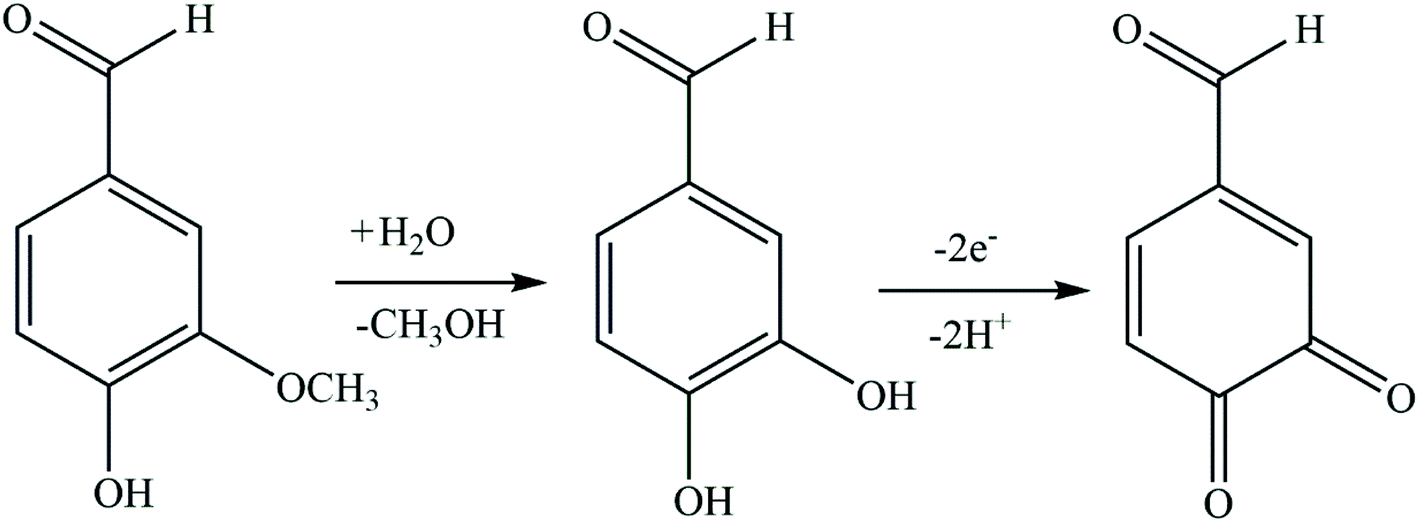 | ||
| Scheme 2 Proposed mechanism for the oxidation of vanillin at FePc MOF/GCE. | ||
3.5 Chronocoulometry analysis
The effective surface areas of the bare GCE and FePc MOF/GCE were analyzed by chronocoulometry. Fig. 4A shows the Q–t curves of the bare GCE and FePc MOF/GCE in 1 mM K3Fe(CN)6 containing 0.1 M KCl. Fig. 4B shows the linearized Q–t1/2 plots, where gave equations of Q (μC) = 38.96t1/2 + 1.438 (R2 = 0.9998) and Q (μC) = 54.04t1/2 + 13.739 (R2 = 0.9962) for bare GCE and FePc MOF/GCE, respectively. The slopes of the Q–t1/2 plots can be expressed as 2nFAcD1/2/π1/2, as in the Anson equation:53where A (cm2) is the surface area of the electrode; c is the vanillin concentration; D is the apparent diffusion coefficient; F is the Faraday constant; n is the number of electrons transferred, Qdl (C) is the double-layer charge, which can be eliminated by background subtraction; and Qads (C) is Faradaic charge due to the oxidation of adsorbed vanillin. For 1 mM K3Fe(CN)6, n can be considered equal to 1 and D equal to 7.6 × 10⁻⁶ cm2 s−1.54 Thus, using the slopes of the linear plots, the A values for bare GCE and FePc MOF/GCE were calculated as 0.129 and 0.180 cm2, respectively. These results indicate that modification with FePc MOF increases the specific surface area of the electrode, thus providing more reaction sites and improving the detection sensitivity.

 | ||
| Fig. 4 (A) Q–t curves of bare GCE (a) and FePc MOF/GCE (b). (B) Linearized Q–t1/2 plots for bare GCE (a) and FePc MOF/GCE (b). (C) Differential pulse voltammograms of FePc MOF/GCE in 0.1 M B–R buffer with 0.22–29.14 μM vanillin. (D) Linear relationship between the oxidation peak current and the vanillin concentration. | ||
3.6 Vanillin detection
Under the optimal conditions, the electrochemical response of FePc MOF/GCE to vanillin at different concentrations was studied using DPV. As shown in Fig. 4C and D, the peak current increases with increasing vanillin concentrations, and a good linear relationship (Ip = 0.027c − 0.023, R2 = 0.9978) is observed between the vanillin concentration and its oxidation peak current in the range of 0.22–29.14 μM. The limit of detection (LOD, S/N = 3) was calculated as 0.05 μM.The proposed method was compared with previous reported electrochemical methods for vanillin detection (Table 1). It can be seen that the FePc MOF/GCE provides a reasonable linear range for vanillin detection and has a lower LOD, which is comparable to other sensors.
| Electrode | Technique | Linear range (μmol L−1) | LOD (μmol L−1) | Reference |
|---|---|---|---|---|
| a Nanoparticles.b Boron-doped diamond electrode.c Arginine-functionalized graphene.d Screen-printed carbon electrode.e Polydopamine-functionalized multi-walled carbon nanotubes, MIP and carboxyl single-walled carbon nanotubes composite.f Ketjen black/ferrocene dual-doped zeolite-like MOFs and electrodeposited gold nanoparticles coupled with DNA aptamer.g Carbon nanofibers.h CTAB-modified graphene paste electrode.i Graphene-quantum dots.j Amperometry: amperometric measurements.k Square wave voltammetry.l Linear sweep voltammetry.m Current–time. | ||||
| Au–Ag alloy NPa/GCE | Amperometryj | 0.2–50 | 0.04 | 53 |
| BDDb | SWVk | 3.3–98 | 0.16 | 55 |
| Arg-Gc/GCE | DPV | 2–70 | 1 | 56 |
| Al–TiO2-NPs/SPCEd | LSVl | 0.07–20 | 0.02 | 57 |
| MWNTs-PDA@MIP/SWNTs-COOHe/GCE | DPV | 0.2–10 | 0.1 | 58 |
| Aptamer-AuNPs/FcKB/ZIF-8f@GCE | SWV | 0.01–200 | 0.03 | 59 |
| MoS2–CNFg/GCE | I–Tm | 0.3–135 | 0.15 | 60 |
| CTABMGPEh | DPV | 4–15 and 20–70 | 1.29 | 61 |
| CoS NR@nafion-GCE | DPV | 0.5–56 | 0.07 | 62 |
| G-QDi@Nafion/AuNPSPCE | LSV and DPV | 13–660 and 0.66–33 | 3.9 and 0.32 | 63 |
| FePc MOF/GCE | DPV | 0.22–29.14 | 0.05 | This work |
3.7 Reproducibility, stability, and interference
To evaluate the reproducibility of the sensor, the DPV current responses to 1.5 μM vanillin were used. Eleven consecutive measurements with the same electrode gave a relative standard deviation (RSD) for the response peak current of 2.02%. Measurements with five independently prepared electrodes gave an RSD of 1.25%. These results indicate that the sensor has good reproducibility. To evaluate stability, the modified electrode was stored at 4 °C for 1 week. After week, the sensor maintained 93% of the initial peak current, indicating good storage stability.The selectivity of the sensor was evaluated by examining the interference of possible coexisting substances in drug and biological samples. The results are shown in Table 2, using a 1.5 μM vanillin standard solution, no interference (deviation <5%) with 500-fold Fe3+, Al3+, and SO42−; 300-fold glucose and sucrose; 200-fold K+; 100-fold maltose, L-leucine, Ca2+, Na+, HCO3−, and Cl−; 50-fold starch, dextrin, L-gystein, L-phenylalanine, Mg2+, Zn2+, Cu2+, NH4+, CO32−, NO3−; and 10-fold ascorbic acid. Fig. S3† showed the DPV of 1.5 μM vanillin at FePc MOF/GCE when coexisting with 150 μM UA and DA. It can be seen that owing to the oxidation potential differences, the oxidation peak of vanillin (oxidation peak: 0.5–0.70 V) is significantly higher than UA (oxidation peak: 0.2–0.5 V) and less than DA (oxidation peaks: 0.9–1.1 V). Therefore, the interference of UA and DA can be ignored when the interference analysis ratio is 100:1. These results indicate that the FePc MOF/GCE had good selectivity for vanillin determination.
| Interferent | na | Er (%) | Interferent | na | Er (%) |
|---|---|---|---|---|---|
| a Molar ratio (interfering substances/vanillin). | |||||
| Glucose | 300 | −1.49 | Na+ | 100 | −0.82 |
| Sucrose | 300 | 0.70 | Mg2+ | 50 | −3.92 |
| Maltose | 100 | −1.96 | Zn2+ | 50 | 2.17 |
| Starch | 50 | −2.27 | Cu2+ | 50 | 2.27 |
| Dextrin | 50 | −3.80 | Fe3+ | 500 | −0.03 |
| Glycine | 50 | −2.12 | Al3+ | 500 | 2.33 |
| L-Leucine | 100 | 1.40 | NH4+ | 50 | −1.55 |
| L-Gystein | 50 | 0.45 | SO42− | 500 | −0.03 |
| L-Phenylalanine | 50 | −2.34 | Cl− | 100 | −0.82 |
| Ascorbic acid | 10 | 4.92 | HCO3− | 100 | −3.92 |
| K+ | 200 | −2.30 | CO32− | 50 | 1.55 |
| Ca2+ | 100 | 1.19 | NO3− | 50 | 0.80 |
3.8 Analysis of real samples
To evaluate the practicality of the developed sensor, the feasibility of vanillin detection in vanillin tablets and human serum was investigated using DPV under the optimized conditions. As shown in Table S1,† satisfactory vanillin recoveries were obtained using the FePc MOF/GCE. Moreover, the vanillin contents determined using the FePc MOF/GCE were in good agreement with those obtained by UV analysis, indicating that the sensor has good application potential for determining the vanillin content of real samples (Table S2†).4. Conclusions
In this work, a novel electrochemical sensor was developed for the determination of vanillin by modifying a GCE with FePc MOF. The good electrocatalytic performance of the FePc MOF may be due to its pore structure, which can absorb vanillin and accelerate the electron-transfer rate, thus increasing the oxidation rate. The fabricated sensor exhibited a linear response range for vanillin of 0.22–29.14 μM with an LOD of 0.05 μM. Moreover, the prepared sensor was successfully applied to detect the content of vanillin in tablets and human serum.Conflicts of interest
There are no conflicts to declare.Acknowledgements
This work was supported by the Natural Science Foundation of Guangxi Province [grant no. 2016GXNSFAA380113, 2018JJA12000] and the National Natural Science Foundation of China [grant no. 21465004].References
- F. Shakee, N. Haq, N. A. Siddiqui, F. K. Alanazi and I. A. Alsarra, Food Chem., 2015, 188, 57–61 CrossRef.
- Z. Dong, F. Gu, F. Xu and Q. Wang, Food Chem., 2014, 149, 54–61 CrossRef CAS.
- A. Shoeb, M. Chowta, G. Pallempati, A. Rai and A. Singh, Indian J. Pharmacol., 2013, 45, 141–144 CrossRef.
- S. Srinual, P. Chanvorachote and V. Pongrakhananon, Int. J. Oncol., 2017, 50, 1341–1351 CrossRef CAS.
- M. E. Kim, J. Y. Na, Y. D. Park and J. S. Lee, Appl. Biochem. Biotechnol., 2019, 187, 884–893 CrossRef CAS.
- I. Mourtzinos, S. Konteles, N. Kalogeropoulos and V. T. Karathanos, Food Chem., 2009, 114, 791–797 CrossRef CAS.
- L. Jiang, Y. Ding, F. Jiang, L. Li and F. Mo, Anal. Chim. Acta, 2014, 833, 22–28 CrossRef CAS.
- N. Ochiai, K. Sasamoto, A. Hoffmann and K. Okanoya, J. Chromatogr. A, 2012, 1240, 59–68 CrossRef CAS.
- C. Liu, L. Zhao, Z. Sun, N. Cheng, X. Xue, L. Wu and W. Cao, Anal. Methods, 2018, 10, 743–748 RSC.
- S. S. Hingse, S. B. Digole and U. S. Annapure, J. Anal. Sci. Technol., 2014, 5, 21 CrossRef.
- M. Shu, Y. Man, H. Ma, F. Luan, H. Li and Y. Gao, Food Anal. Methods, 2016, 9, 1706–1712 CrossRef.
- N. Altunay, LWT–Food Sci. Technol., 2018, 93, 9–15 CrossRef CAS.
- F. Bettazzi, I. Palchetti, S. Sisalli and M. Mascini, Anal. Chim. Acta, 2006, 555, 134–138 CrossRef CAS.
- H.-C. Zhou, J. R. Long and O. M. Yaghi, Chem. Rev., 2012, 112, 673–674 CrossRef CAS.
- H.-C. Zhou and S. Kitagawa, Chem. Soc. Rev., 2014, 43, 5415–5418 RSC.
- G. Cai and H.-L. Jiang, Angew. Chem., Int. Ed., 2017, 56, 563–567 CrossRef CAS.
- T. Mehtab, G. Yasin, M. Arif, M. Shakeel, R. M. Korai, M. Nadeem, N. Muhammad and X. Lu, J. Energy Storage, 2019, 21, 632–646 CrossRef.
- H. Li, L. Li, R.-B. Lin, W. Zhou, Z. Zhang, S. Xiang and B. Chen, EnergyChem, 2019, 1, 100006 CrossRef.
- L. Chen and Q. Xu, Matter, 2019, 1, 57–89 CrossRef.
- E. Naghian, E. M. Khosrowshahi, E. Sohouli, F. Ahmadi, M. R. Nasrabadi and V. Safarifard, New J. Chem., 2020, 44, 9271–9277 RSC.
- C. Bao, Q. Niu, Z.-A. Chen, X. Cao, H. Wang and W. Lu, RSC Adv., 2019, 9, 29474–29481 RSC.
- Z. Zeng, X. Fang, W. Miao, Y. Liu, T. Maiyalagan and S. Mao, ACS Sens., 2019, 4, 1934–1941 CrossRef CAS.
- X. Fang, X. Chen, Y. Liu, Q. Li, Z. Zeng, T. Maiyalagan and S. Mao, ACS Appl. Nano Mater., 2019, 2, 2367–2376 CrossRef CAS.
- X. Fang, B. Zong and S. Mao, Nano-Micro Lett., 2018, 10, 64 CrossRef.
- Z. Liu, Q. Jiang, R. Zhang, R. Gao and J. Zhao, Electrochim. Acta, 2016, 187, 81–91 CrossRef CAS.
- N. Masilela and T. Nyokong, Dyes Pigm., 2010, 84, 242–248 CrossRef CAS.
- A. Gelir, İ. Yılmaz and Y. Yılmaz, J. Phys. Chem. B, 2007, 111, 478–484 CrossRef CAS.
- M. K. Sener, A. Koca, A. Gül and M. B. Kocak, Polyhedron, 2007, 26, 1070–1076 CrossRef CAS.
- N. Silva, C. Castro-Castillo, M. P. Oyarzún, S. Ramírez, C. Gutierrez-Ceron, J. F. Marco, J. F. Silva and J. H. Zagal, Electrochim. Acta, 2019, 308, 295–306 CrossRef CAS.
- M. Arıcı, D. Arıcan, A. L. Uğur, A. Erdoğmuş and A. Koca, Electrochim. Acta, 2013, 87, 554–566 CrossRef.
- K. Sakamoto and E. Ohno, Dyes Pigm., 1997, 35, 375–386 CrossRef CAS.
- J. Peng, Q. Huang, Y. Liu, F. Liu and C. Zhang, Sens. Actuators, B, 2019, 294, 157–165 CrossRef CAS.
- T. Xu, D. Wang, L. Dong, H. Shen, W. Lu and W. Chen, Appl. Catal., B, 2019, 244, 96–106 CrossRef CAS.
- D. Yu and X. He, Appl. Mater. Today, 2016, 3, 1–10 CrossRef.
- J. Peng, W. Zhuge, Y. Liu, C. Zhang, W. Yang and Y. Huang, J. Electrochem. Soc., 2019, 166, B1612–B1619 CrossRef CAS.
- Y.-J. Yuan, J.-R. Tu, H.-W. Lu, Z.-T. Yu, X.-X. Fan and Z.-G. Zou, Dalton Trans., 2016, 45, 1359–1363 RSC.
- C. Li, T. Huang, Z. Huang, J. Sun, C. Zong, J. Yang, W. Deng and F. Dai, Dalton Trans., 2019, 48, 17258–17265 RSC.
- C. Marinescu, M. B. Ali, A. Hamdi, Y. Cherifi, A. Barras, Y. Coffinier, S. Somacescu, V. Raditoiu, S. Szunerits and R. Boukherroub, Chem. Eng. J., 2018, 336, 465–475 CrossRef CAS.
- J. Peng, Q. Huang, W. Zhuge, Y. Liu, C. Zhang, W. Yang and G. Xiang, Biosens. Bioelectron., 2018, 106, 212–218 CrossRef CAS.
- J. Peng, W. Zhuge, Y. Huang, C. Zhang and W. Huang, Bull. Korean Chem. Soc., 2019, 40, 214–219 CrossRef CAS.
- Y. Baygu and Y. Gök, Inorg. Chem. Commun., 2018, 96, 133–138 CrossRef CAS.
- Z. Huang, L. Huang, Y. Huang, Y. He, X. Sun, X. Fu, X. Xu, G. Wei, D. Chen and C. Zhao, Nanoscale, 2017, 9, 15883–15894 RSC.
- H. Nagatomi, N. Yanai, T. Yamada, K. Shiraishi and N. Kimizuka, Chem. – Eur. J., 2018, 24, 1806–1810 CrossRef CAS.
- H. Zhong, K. H. Ly, M. Wang, Y. Krupskaya, X. Han, J. Zhang, J. Zhang, V. Kataev, B. Büchner, I. M. Weidinger, S. Kaskel, P. Liu, M. Chen, R. Dong and X. Feng, Angew. Chem., Int. Ed., 2019, 31, 10677–10682 CrossRef.
- H. Jia, Y. Yao, J. Zhao, Y. Gao, Z. Luo and P. Du, J. Mater. Chem. A, 2018, 6, 1188–1195 RSC.
- L. Sun, J. Xie, Z. Chen, J. Wu and L. Li, Dalton Trans., 2018, 47, 9989–9993 RSC.
- T. Yamashita and P. Hayes, Appl. Surf. Sci., 2008, 254, 2441–2449 CrossRef CAS.
- W. Cai, T. Lai, H. Du and J. Ye, Sens. Actuators, B, 2014, 193, 492–500 CrossRef CAS.
- E. Laviron, J. Electroanal. Chem., 1979, 101, 19–28 CrossRef CAS.
- T. T. Calam and D. Uzun, Electroanalysis, 2019, 31, 2347–2358 CrossRef CAS.
- A. T. Ezhil Vilian, P. Puthiaraj, C. H. Kwak, S.-K. Hwang, Y. S. Huh, W.-S. Ahn and Y.-K. Han, ACS Appl. Mater. Interfaces, 2016, 8, 12740–12747 CrossRef.
- D. Y. Zheng, C. G. Hua, T. Gan, X. P Dang and S. S. Hu, Sens. Actuators, B, 2010, 148, 247–252 CrossRef CAS.
- F. C. Anson, Anal. Chem., 1964, 36, 932–934 CrossRef CAS.
- Y. Wang, Y. Ding, L. Li and P. Hu, Talanta, 2018, 178, 449–457 CrossRef CAS.
- Y. Yardım, M. Gülcan and Z. Şentürk, Food Chem., 2013, 141, 1821–1827 CrossRef.
- Y. Zhao, Y. Du, D. Lu, L. Wang, D. Ma, T. Ju and M. Wu, Anal. Methods, 2014, 6, 1753–1758 RSC.
- K. Murtada, S. Jodeh, M. Zougagh and Á. Ríos, Electroanalysis, 2018, 30, 969–974 CrossRef CAS.
- W. Wu, L. Yang, F. Zhao and B. Zeng, Sens. Actuators, B, 2017, 239, 481–487 CrossRef CAS.
- Y. Sun, X. Jiang, H. Jin and R. Gui, Anal. Chim. Acta, 2019, 1083, 101–109 CrossRef CAS.
- Q. Mei, Y. Ding, L. Li, A. Wang, D. Duan and Y. Zhao, J. Electroanal. Chem., 2019, 833, 297–303 CrossRef CAS.
- C. Raril and J. G. Manjunatha, Microchem. J., 2020, 154, 104575 CrossRef CAS.
- M. Sivakumar, M. Sakthivel and S.-M. Chen, J. Colloid Interface Sci., 2017, 490, 719–726 CrossRef CAS.
- G. M. Durán, E. J. Llorent-Martínez, A. M. Contento and Á. Ríos, Microchim. Acta, 2018, 185, 204 CrossRef.
Footnote |
| † Electronic supplementary information (ESI) available. See DOI: 10.1039/d0ra06783k |
| This journal is © The Royal Society of Chemistry 2020 |