 Open Access Article
Creative Commons Attribution 3.0 Unported Licence
A biotin-guided hydrogen sulfide fluorescent probe and its application in living cell imaging†
Chen Zhang‡
a,
Jiewen Zhang‡a,
Zhiqiang Xub,
Kun Zanga,
Feng Liua,
Jun Yin *b,
Ying Tan
 *a and
Yuyang Jiangc
aState Key Laboratory of Chemical Oncogenomics, Key Laboratory of Chemical Biology, Tsinghua Shenzhen International Graduate School, Tsinghua University, Shenzhen, 518055, P. R. China. E-mail: tan.ying@il.ccnu.edu.cn
bKey Laboratory of Pesticide and Chemical Biology, Ministry of Education, College of Chemistry, Central China Normal University, Wuhan 430079, China. E-mail: yinj@mail.ccnu.edu.cn
cSchool of Pharmaceutical Sciences, Tsinghua University, Beijing 100084, P. R. China
First published on 1st October 2020
Abstract
Hydrogen sulfide (H2S), a well-known signaling molecule, exerts significant regulatory effects on the cardiovascular and nervous systems. Therefore, monitoring the metabolism of H2S offers a potential mechanism to detect various diseases. In addition, biotin is significantly used as a targeting group to detect cancer cells exclusively. In this work, a biotin-guided benzoxadizole-based fluorescent probe, NP-biotin, was developed for H2S detection and evaluated in normal liver cell (LO2) and liver cancer cell (HepG2) lines. Results reveal that NP-biotin can detect cellular H2S with high sensitivity and selectivity. Moreover, NP-biotin has been confirmed to possess the ability to target cancer cells under the guidance of the biotin group.
Introduction
Like carbon monoxide (CO) and nitric oxide (NO), hydrogen sulfide (H2S) is well known as a gaseous mediator. H2S regulates the cardiovascular system1–5 and nervous systems6,7 and also exerts anti-inflammatory effects.8,9 So far, many studies have suggested that endogenous H2S is mainly produced from cysteine by CBS (cystathionine β-synthase) or CSE (cystathionine γ-lyase) enzymes, which are responsible for the synthesis of H2S in vivo.10–12 In addition, several pathways for H2S synthesis have been reported,13,14 in which the enzymatic actions of CBS and CSE on cysteine have been regarded as the predominant driving force.As a signaling molecule, various concentrations (from nM to μM) of H2S are found in different tissues and biological fluids,15 thus the excess generation or paucity of H2S indicate disease status. In recent years, it has been reported that dysregulation of H2S metabolism is related to neurodegenerative diseases, such as Parkinson's, Alzheimer's, and Huntington's diseases.16 However, research on the physiological and pathological functions of H2S is still in its preliminary stage compared the extensive studies on CO and NO. Monitoring the production and distribution of cellular H2S could help to understand how it stimulates biological response and interacts with signaling pathways, further illustrating its relationship with diseases.
Compared with the traditional methods, using the fluorescence imaging technique to detect cellular H2S has numerous advantages. Several benefits include monitoring the production of H2S in real-time and displaying the spatial distribution of H2S without destructive sampling. Besides, the fluorescence imaging has high sensitivity and selectivity towards its target based on fluorescent probes.17–24 To assist the fluorescence imaging of H2S, it is necessary to develop a fluorescent probe with excellent performance. Based on reports of the good selectivity of the piperazinyl-NBD-based probe towards H2S, we selected piperazinyl-NBD as a response group for H2S in designing our probe.25
Many cancer cells often overexpress vitamin receptors (such as folate and biotin) on the surface of the cell membrane to aid the transduction of signals and uptake of nutrients, which could promote the fast growth and proliferation of cancer cells.26,27 Based on the specific recognition between vitamins and their corresponding receptors, vitamins are commonly used in a drug delivery system to target cancer cells exclusively.28–30 In previous reports, researchers confirmed that the biotin-modified probes would be more selectively taken up by biotin-positive cancer cells than by biotin-negative cells.31–34 Taking this into consideration, the biotin group was introduced into our probe to increase its cancer-targeting ability.
In this work, a biotin-guided piperazinyl-NBD-based fluorescent probe NP-biotin for H2S is reported. Biotin was selected as a cancer-targeting group, and piperazinyl-NBD was used as a response group for H2S. NP-biotin exhibited great sensitivity and selectivity for H2S. In the living cell imaging, NP-biotin successfully detected cellular H2S and targeted the cancer cells via the binding with biotin receptors under guidance of the biotin group.
Experimental section
Materials and instruments
All reagents are obtained commercially. UV-Vis spectra were obtained from spectrometer (Beckman DU 800, USA) and fluorescence spectra were measured on a fluorescence spectrophotometer (SPEX Flurolog 3-TCSPC instrument, USA). 1H and 13C NMR spectra were recorded on nuclear magnetic resonance spectrometer (Bruker AVIII-400, Germany) and mass spectra were recorded on mass spectrometry (AB Sciex QSTAR Elite, USA). Water was prepared by the Milli-Q purification system.Synthesis of NP-biotin
The synthesis procedure of our probe, NP-biotin, is shown in Scheme 1. Under argon atmosphere, NBD-PZ (50 mg, 0.20 mmol) was added into a mixture of biotin (68 mg, 0.20 mmol), DIPEA (0.10 mL), EDCI (58 mg, 0.30 mmol), and HOBt (68 mg, 0.50 mmol) in DMF (5.0 mL). The mixture was stirred overnight at room temperature. After the addition of 20 mL water, the mixture was extracted with ethyl acetate and washed three times by water, then dried with Na2SO4. After the solvent was removed, the crude product was purified by silica column chromatography with dichloromethane/methanol (20![[thin space (1/6-em)]](https://www.rsc.org/images/entities/char_2009.gif) :
:![[thin space (1/6-em)]](https://www.rsc.org/images/entities/char_2009.gif) 1) to obtain the final NP-biotin product, which displayed an orange color, with a yield of 45%. The structure of NP-biotin was confirmed by 1H and 13C NMR spectrum (Fig. S1 and S2†). 1H NMR (400 MHz, DMSO-d6): δ (ppm) = 8.53 (d, J = 8 Hz, 1H, Ar-H), 6.62 (d, J = 8 Hz, 1H, Ar-H), 6.47 (s, 1H), 6.39 (s, 1H), 4.31 (t, J = 8 Hz, 1H), 4.24–4.14 (m, 4H), 4.09 (s, 1H), 3.80–3.73 (m, 4H), 3.14–3.09 (m, 1H), 2.85–2.80 (m, 1H), 2.59 (d, J = 12 Hz, 1H), 2.38 (t, J = 8 Hz, 2H), 1.64–1.47 (m, 4H), 1.37 (t, J = 4 Hz, 2H). 13C NMR (101 MHz, DMSO-d6): δ (ppm) = 171.0, 162.6, 145.4, 144.7, 136.2, 121.0, 103.0, 61.0, 59.1, 55.4, 48.9, 48.5, 43.5, 32.0, 28.2, 28.0, 24.5. ESI-HRMS: m/z calcd for C20H26N7O5S [M + H]+ 476.1716; found: 476.1712.
1) to obtain the final NP-biotin product, which displayed an orange color, with a yield of 45%. The structure of NP-biotin was confirmed by 1H and 13C NMR spectrum (Fig. S1 and S2†). 1H NMR (400 MHz, DMSO-d6): δ (ppm) = 8.53 (d, J = 8 Hz, 1H, Ar-H), 6.62 (d, J = 8 Hz, 1H, Ar-H), 6.47 (s, 1H), 6.39 (s, 1H), 4.31 (t, J = 8 Hz, 1H), 4.24–4.14 (m, 4H), 4.09 (s, 1H), 3.80–3.73 (m, 4H), 3.14–3.09 (m, 1H), 2.85–2.80 (m, 1H), 2.59 (d, J = 12 Hz, 1H), 2.38 (t, J = 8 Hz, 2H), 1.64–1.47 (m, 4H), 1.37 (t, J = 4 Hz, 2H). 13C NMR (101 MHz, DMSO-d6): δ (ppm) = 171.0, 162.6, 145.4, 144.7, 136.2, 121.0, 103.0, 61.0, 59.1, 55.4, 48.9, 48.5, 43.5, 32.0, 28.2, 28.0, 24.5. ESI-HRMS: m/z calcd for C20H26N7O5S [M + H]+ 476.1716; found: 476.1712.
Spectroscopic measurements
The stock solution of NP-biotin (1 mM, DMSO) was prepared then stored in the dark until use. The stock solution of Na2S (the source of H2S) and other analytes (10 mM) were dissolved in water then diluted by PBS (10 mM, pH = 7.4) when used. For the spectroscopic measurements, the stock solution of NP-biotin was diluted to work solution (10 μM) by PBS (10 mM, pH = 7.4, 1% DMSO). In the titration experiment, Na2S was added step-wise into the NP-biotin work solution to observe the behavior of NP-biotin towards different concentrations of Na2S. Subsequently, the selectivity of NP-biotin was investigated by addition of the various analytes (100 μM) mentioned above. Also, the availability of NP-biotin was tested in solutions of different pH values, ranging 3.0–12.0. The kinetics between NP-biotin and Na2S (100 μM) were explored by recording the fluorescence change of NP-biotin at 550 nm upon the addition of Na2S. The fluorescence spectrum of NP-biotin was recorded under the excitation at 480 nm, and the slit width of the excitation and emission was set to 5 nm.Cell culture and living cell imaging
HepG2 and LO2 cells were cultured in Dulbecco's modified Eagle's medium supplemented with 10% fetal bovine serum in an atmosphere with 5% CO2 at 37 °C. Cells were seeded in glass-bottom culture dishes until attached and then incubated with the 10 μM probe followed by washing with PBS before imaging on a laser scanning confocal microscope (Olympus FV-1000-IX81). Emission was collected at the green channel (500–600 nm, excitation at 488 nm).Cytotoxicity assay
Cells were seeded in a 96-well cell culture dish (1000–10![[thin space (1/6-em)]](https://www.rsc.org/images/entities/char_2009.gif) 000 cells per well). After cell attachment, the cell culture medium containing the probe from 0–100 μM was added for 24 h incubation. Then, the medium containing probe was replaced with the medium containing 10% CCK-8 reagent. After another 4 h of incubation, the absorbance of each well at 450 nm was measured with the microplate reader (TECAN Infinite Series M1000 Pro).
000 cells per well). After cell attachment, the cell culture medium containing the probe from 0–100 μM was added for 24 h incubation. Then, the medium containing probe was replaced with the medium containing 10% CCK-8 reagent. After another 4 h of incubation, the absorbance of each well at 450 nm was measured with the microplate reader (TECAN Infinite Series M1000 Pro).
Results and discussion
Optical response of NP-biotin to H2S
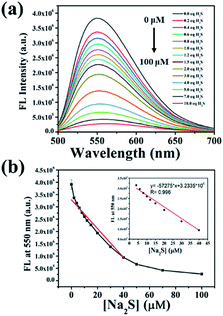
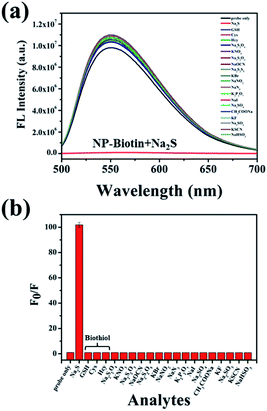
To explore the response of NP-biotin towards different equivalents of Na2S, we performed a titration experiment. The fluorescence spectra of NP-biotin were recorded after the Na2S stepwise addition. As shown in Fig. 1a, NP-biotin shows strong fluorescence emission at 550 nm, and the emission peak gradually decreased as the concentration of Na2S increased. A good linear relationship is seen between the fluorescence intensity at 550 nm and Na2S concentration in the range of 0–40 μM (Fig. 1b). Based on the 3σ/s principle,35 the limit of detection was calculated to be 3.69 nM, which is much lower than the physiological concentration of H2S (10–100 μM).36–38 NP-biotin exhibited great sensitivity for Na2S, which indicates its good potential in living cell imaging.The selectivity was evaluated by Na2S and other analytes, including biothiols GSH, Cys, and Hcy. As shown in Fig. 2a, only Na2S could efficiently quench the fluorescence of the probe, and the fluorescence intensity at 550 nm was reduced about 100-fold after the addition of Na2S (Fig. 2b). It is worth mentioning that GSH, Cys, and Hcy had almost no effect on the fluorescence performance of NP-biotin. Furthermore, the response of NP-biotin to Na2S was also explored in the presence of other analytes (Fig. S3†). The results show that the existence of other species do not affect the quenching of NP-biotin by Na2S. It is also interesting to note that the probe showed excellent selectivity towards Na2S, which implies it could be applied in complex biological systems.
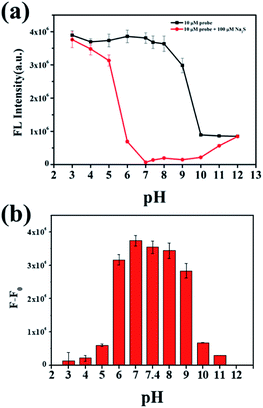
To investigate the behavior of NP-biotin with or without Na2S at different pH values, a series of phosphate buffers with different pH values were prepared. The difference between the fluorescence intensity at 550 nm in the absence (black line in Fig. 3a) and presence (red line in Fig. 3a) of Na2S could reflect the availability of NP-biotin towards Na2S under different pH conditions. In Fig. 3b, a dramatic reduction of fluorescence intensity at 550 nm occurred in the pH range from 6.0–9.0 and reached a maximum at pH 7.0, which is closed to the physiological pH of humans. Impressively, these results indicate that NP-biotin works well in physiological pH conditions.
To explore the kinetics between NP-biotin and Na2S, the time-dependent fluorescence intensity of NP-biotin at 550 nm was monitored after the addition of Na2S. As shown in Fig. 4, the fluorescence intensity of NP-biotin decreased significantly as soon as the Na2S was added and reached a minimum after about 1 h. The pseudo-first-order rate was calculated to be 7.4 × 10⁻³ S−1 by fitting the fluorescence intensity with a single exponential function. These data imply the possibility of NP-biotin to detect H2S in a real-time manner.
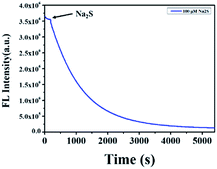 | ||
| Fig. 4 The time-dependent fluorescence intensity at 550 nm of 10 μM NP-biotin upon reaction with Na2S (100 μM). | ||
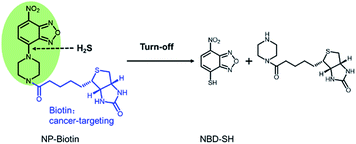
In order to verify the mechanism of the reaction between the probe and Na2S, the methanol solution before and after the reaction was analyzed by mass spectrometry. The sensing mechanism was explored by ESI-HRMS. As shown in Fig. S4 and S5,† [NP-biotin + H]+ (m/z: 476.1712, calcd for C20H26N7O5S ([M + H]+: 476.1716)) was detected in the mass spectrum of the probe solution before Na2S was added. [NBD-SH-H]− (m/z: 195.9821, calcd for C6H2N3O3S ([M − H]−: 195.9820)) was detected in the mass spectrum of the probe solution after Na2S was added. These data confirm that in the proposed sensing mechanism (Fig. 5) based on the nucleophilicity, H2S cleaves the C–N bond between piperazinyl and benzoxadizole of NP-biotin to ultimately produce NBD-SH.
Fluorescence imaging of NP-biotin in living cells
In the following cell imaging experiments, HepG2,39–41 a liver cancer cell line, was used as biotin receptor-positive cell, and a normal liver cell line LO2 (ref. 42) was selected as biotin receptor-negative cell.To explore the application of NP-biotin in the detection of intracellular hydrogen sulfide, we examined the effects of probes at different concentrations on cell viability using the CCK-8 Kit. HepG2 cells were treated by the probe with different concentrations for 24 h. The cytotoxicity results show that the cell viability of HepG2 had almost no change with 0–50 μM probe treatment and remained about 80% with the 100 μM probe, which indicates that the probe exhibits low cytotoxicity (Fig. S6†). Hence, we selected a concentration of 10 μM for subsequent cell imaging experiments.
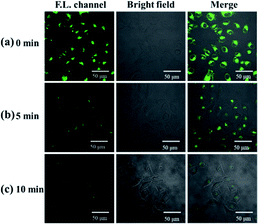
To verify the ability of probe molecules to detect exogenous hydrogen sulfide, LO2 cells were selected as the target cells. After incubation with 10 μM NP-biotin for 1 h, strong fluorescence was observed inside LO2 cells (Fig. 6a). After 50 μM Na2S was added, the fluorescence gradually decreased and almost turned off 10 min (Fig. 6c). These results demonstrate that the probe could detect exogenous hydrogen sulfide.
Comparatively, in fluorescent imaging of HepG2, fluorescence was observed on the cell membrane but almost no fluorescence could be observed in the cytoplasm (Fig. 7a). It has been reported that cancer cells usually express excessive hydrogen sulfide compared to normal cells;43,44 thus, the weak fluorescence inside the HepG2 cells may be caused by the high concentration of hydrogen sulfide. NMM (N-methylmaleimide), a hydrogen sulfide scavenger, was tested to verify our speculation. HepG2 was pretreated with 1 mM NMM, which was used to consume endogenous H2S before incubation with the probe. The fluorescence appeared when the cells were pretreated with NMM, as shown in Fig. 7b. At the moment, the pH of endosome and lysosome in HepG2 cells was acidic, but the significant fluorescence of the NP-biotin was shown in the cells. So this experiment can confirm that the fluorescence of the NP-biotin would not be significantly reduced by being exposed to acidic pH in endosome and lysosome. From what has been discussed above these results indicate that the weak fluorescence was caused by the high concentration of H2S in HepG2.
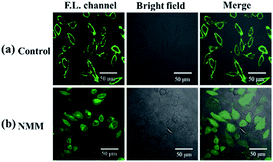 | ||
| Fig. 7 (a) Fluorescent images of HepG2 cells incubated with 10 μM NP-biotin for 1 h; (b) fluorescent images of HepG2 cells pretreated with 1 mM NMM for 1 h then incubated with 10 μM probe for 1 h. | ||
Cell imaging was further used to investigate the tumor targeting ability of the probe. In this assay, both biotin receptor-positive cells (HepG2) and biotin receptor-negative cells (LO2) were selected as subjects. It is suggested that the bright fluorescence on the cell membrane of HepG2 may be attributed to the biotin receptors, which could recognize and bind to the biotin group of our probe.45–47 To confirm this, biotin (final concentration of 2 mM) was added with probe, in which biotin was used as competition for biotin receptors on the cell membrane with the probe. As shown in Fig. 8, the presence of biotin significantly reduced the fluorescence intensity on the cell membrane of HepG2, which indicates that biotin occupied a certain amount of biotin receptors and limited the sites available for NP-biotin. This phenomenon demonstrates the targeting ability of NP-biotin towards cancer cells via biotin receptors. As expected, the co-incubation of biotin with the probe had no influence on LO2 cells, a biotin receptor negative cell line (Fig. 9). These results prove that NP-biotin possesses a cancer-targeting function by binding to the biotin receptor.
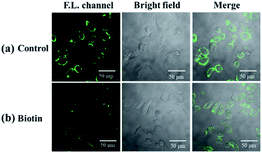 | ||
| Fig. 8 (a) Fluorescent images of HepG2 cells incubated with 10 μM NP-biotin for 1 h; (b) fluorescent images of HepG2 cells incubated with 2 mM biotin and 10 μM NP-biotin for 1 h simultaneously. | ||
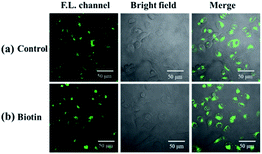 | ||
| Fig. 9 (a) Fluorescent images of LO2 cells incubated with 10 μM NP-biotin for 1 h; (b) fluorescent images of LO2 cells incubated with 2 mM biotin and 10 μM NP-biotin for 1 h simultaneously. | ||
After incubation with 10 μM probe for 1 h and washing by PBS, HepG2 and LO2 cells were observed every 5 min by the microscope. The fluorescence on the cell membrane of HepG2 gradually decreased over time, which suggests that the probe was transported from the membrane to cytoplasm and then recognized by the H2S inside HepG2 cells (Fig. 10a). On the contrary, the fluorescence of LO2 cells did not decrease (Fig. 10b), indicating that the probe in the cytoplasm was not completely quenched. This result demonstrates that HepG2 cells exhibit a higher H2S concentration than LO2 cells, which agrees with the previous studies that reported cancer cells usually express more H2S than normal cells.43,44
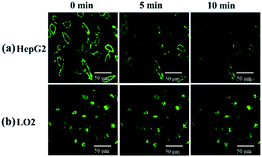 | ||
| Fig. 10 (a) HepG2 and (b) LO2 were imaged every 5 min after incubation with 10 μM NP-biotin for 1 h and washing by PBS. | ||
Conclusions
In this work, a novel biotin-guided piperazinyl-NBD-based fluorescent probe (NP-biotin) for sensing cellular H2S was successfully developed. Results confirm that NP-biotin possesses excellent sensitivity and selectivity toward H2S, which implies its good application in live cell imaging. The cell imaging results show that the NP-biotin could detect cellular H2S in complex biological systems. This work further reports that, by selecting HepG2 and LO2 as biotin receptor positive and negative cells, respectively, NP-biotin can target cancer cells via the recognition between the biotin group of NP-biotin and biotin receptors.Conflicts of interest
There are no conflicts to declare.Acknowledgements
This work is supported by grants from the National Key R&D Program of China, Synthetic Biology Research (2019YFA0905900), Department of Science and Technology of Guangdong Province (No. 2017B030314083), and Shenzhen Municipal Government (No. 2019156; JCYJ20180306174248782).References
- B. Olas, Clin. Chim. Acta, 2015, 439, 212–218 CrossRef CAS.
- X. B. Wang, H. F. Jin, C. S. Tang and J. B. Du, Clin. Exp. Pharmacol. Physiol., 2010, 37, 745–752 CrossRef CAS.
- M. Tian, Y. Ma and W. Lin, Acc. Chem. Res., 2019, 52, 2147–2157 CrossRef CAS.
- Y. Tang, Y. Ma, J. Yin and W. Lin, Chem. Soc. Rev., 2019, 48, 4036–4048 RSC.
- D. Cao, Z. Liu, P. Verwilst, S. Koo, P. Jangjili, J. S. Kim and W. Lin, Chem. Rev., 2019, 119, 10403–10519 CrossRef CAS.
- X.-Q. Liu and Y. Yan, Shengli Kexue Jinzhan, 2007, 38, 177–180 CAS.
- Y. Y. Liu and J. S. Bian, J. Alzheimer's Dis., 2012, 31, 453 Search PubMed.
- J. L. Wallace, Trends Pharmacol. Sci., 2007, 28, 501–505 CrossRef CAS.
- R. C. O. Zanardo, V. Brancaleone, E. Distrutti, S. Fiorucci, G. Cirino and J. L. Wallace, FASEB J., 2006, 20, 2118–2120 CrossRef CAS.
- M. H. Stipanuk and P. W. Beck, Biochem. J., 1982, 206, 267–277 CrossRef CAS.
- P. F. Erickson, I. H. Maxwell, L. J. Su, M. Baumann and L. M. Glode, Biochem. J., 1990, 269, 335–340 CrossRef CAS.
- K. Qu, S. W. Lee, J. S. Bian, C. M. Low and P. T. H. Wong, Neurochem. Int., 2008, 52, 155–165 CrossRef CAS.
- D. Julian, J. L. Statile, S. E. Wohlgemuth and A. J. Arp, Comp. Biochem. Physiol., Part A: Mol. Integr. Physiol., 2002, 133, 105–115 CrossRef.
- N. Shibuya, M. Tanaka, M. Yoshida, Y. Ogasawara, T. Togawa, K. Ishii and H. Kimura, Neurosci. Res., 2009, 65, S57 CrossRef.
- M. N. Hughes, M. N. Centelles and K. P. Moore, Free Radical Biol. Med., 2009, 47, 1346–1353 CrossRef CAS.
- B. D. Paul and S. H. Snyder, Biochem. Pharmacol., 2018, 149, 101–109 CrossRef CAS.
- Z. Q. Xu, X. T. Huang, X. Han, D. Wu, B. B. Zhang, Y. Tan, M. J. Cao, S. H. Liu, J. Yin and J. Y. Yoon, Chem, 2018, 4, 1609–1628 CAS.
- B. Deng, M. Ren, J.-Y. Wang, K. Zhou and W. Lin, Sens. Actuators, B, 2017, 248, 50–56 CrossRef CAS.
- L. He, X. Yang, K. Xu, X. Kong and W. Lin, Chem. Sci., 2017, 8, 6257–6265 RSC.
- Y. Liu, J. Niu, W. Wang, Y. Ma and W. Lin, Adv. Sci., 2018, 5, 1700966 CrossRef.
- Y. Lu, B. Dong, W. Song, X. Kong, A. H. Mehmood and W. Lin, Anal. Methods, 2019, 11, 3301–3306 RSC.
- X. Wang, Y. Zuo, Y. Zhang, T. Yang and W. Lin, Anal. Methods, 2020, 12, 1064–1069 RSC.
- Q. Xu, L. He, H. Wei and W. Lin, J. Fluoresc., 2018, 28, 5–11 CrossRef CAS.
- Y. Yang, L. He, K. Xu and W. Lin, New J. Chem., 2019, 43, 10926–10931 RSC.
- Z. Y. Xu, Z. Y. Wu, H. Y. Tan, J. W. Yan, X. L. Liu, J. Y. Li, Z. Y. Xu, C. Z. Dong and L. Zhang, Anal. Methods, 2018, 10, 3375–3379 RSC.
- S. Chen, X. Zhao, J. Chen, J. Chen, L. Kuznetsova, S. S. Wong and I. Ojima, Bioconjugate Chem., 2010, 21, 979–987 CrossRef CAS.
- G. Russell-Jones, K. McTavish, J. McEwan, J. Rice and D. Nowotnik, J. Inorg. Biochem., 2004, 98, 1625–1633 CrossRef CAS.
- N. Duhem, F. Danhier and V. Preat, J. Controlled Release, 2014, 182, 33–44 CrossRef CAS.
- M. Guttoff, A. H. Saberi and D. J. McClements, Food Chem., 2015, 171, 117–122 CrossRef CAS.
- B. Ozturk, S. Argin, M. Ozilgen and D. J. McClements, J. Food Eng., 2014, 142, 57–63 CrossRef CAS.
- J. G. Vineberg, T. Wang, E. S. Zuniga and I. Ojima, J. Med. Chem., 2015, 58, 2406–2416 CrossRef CAS.
- Z. Guo, Y. Ma, Y. Liu, C. Yan, P. Shi, H. Tian and W.-H. Zhu, Sci. China: Chem., 2018, 61, 1293–1300 CrossRef CAS.
- X. Kong, B. Dong, N. Zhang, C. Wang, X. Song and W. Lin, Talanta, 2017, 174, 357–364 CrossRef CAS.
- S. Park, E. Kim, W. Y. Kim, C. Kang and J. S. Kim, Chem. Commun., 2015, 51, 9343–9345 RSC.
- J. Zhang, Y. Zhou, W. Hu, Z. Lin, H. Qi and T. Ma, Sens. Actuators, B, 2013, 183, 290–296 CrossRef CAS.
- R. Hyspler, A. Ticha, M. Indrova, Z. Zadak, L. Hysplerova, J. Gasparic and J. Churacek, J. Chromatogr. B: Anal. Technol. Biomed. Life Sci., 2002, 770, 255–259 CrossRef CAS.
- K. R. Olson, Biochim. Biophys. Acta, Bioenerg., 2009, 1787, 856–863 CrossRef CAS.
- J. Hongfang, B. Cong, B. Zhao, C. Zhang, X. Liu, W. Zhou, S. Ying, C. Tang and D. Junbao, Life Sci., 2006, 78, 1309 CrossRef.
- G. Wei, R. Dong, W. Dong, F. Lei, S. Dong, A. Song and J. Hao, New J. Chem., 2013, 38, 140–145 RSC.
- S. Brahmachari, M. Ghosh, S. Dutta and P. K. Das, J. Mater. Chem. B, 2014, 2, 1160–1173 RSC.
- K. Taeyoung, J. Hyun Mi, L. Hoa Thi, K. Tae Woo, K. Chulhun and K. Jong Seung, Chem. Commun., 2014, 50, 7690–7693 RSC.
- K. Li, L. Qiu, Q. Liu, G. Lv, X. Zhao, S. Wang and J. Lin, J. Photochem. Photobiol., B, 2017, 174, 243 CrossRef CAS.
- M. R. Hellmich and C. Szabo, Handb. Exp. Pharmacol., 2015, 230, 233–241 CAS.
- D. Wu, M. Li, W. Tian, S. Wang, L. Cui, H. Li, H. Wang, A. Ji and Y. Li, Sci. Rep., 2017, 7, 5134 CrossRef.
- Y. H. Lee, Y. Tang, P. Verwilst, W. Lin and J. S. Kim, Chem. Commun., 2016, 52, 11247–11250 RSC.
- J. Yang, K. Li, J.-T. Hou, L.-L. Li, C.-Y. Lu, Y.-M. Xie, X. Wang and X.-Q. Yu, ACS Sens., 2016, 1, 166–172 CrossRef CAS.
- B. Dong, X. Song, X. Kong, C. Wang, N. Zhang and W. Lin, J. Mater. Chem. B, 2017, 5, 988–995 RSC.
Footnotes |
| † Electronic supplementary information (ESI) available. See DOI: 10.1039/d0ra06524b |
| ‡ Authors contributed equally to this work. |
| This journal is © The Royal Society of Chemistry 2020 |


