
 Open Access Article
 This Open Access Article is licensed under a Creative Commons Attribution-Non Commercial 3.0 Unported Licence
Synthesis, structure and thermal properties of montmorillonite/ionic liquid ionogels
Andrew V. Noskov *,
Olga V. Alekseeva,
Valeriya D. Shibaeva and
Alexander V. Agafonov
*,
Olga V. Alekseeva,
Valeriya D. Shibaeva and
Alexander V. Agafonov
G.A. Krestov Institute of Solution Chemistry, Russian Academy of Sciences, Russia. E-mail: avn@isc-ras.ru
First published on 21st September 2020
Abstract
Sodium montmorillonite (Na-MMT) was synthesized as a result of two-stage processing of natural bentonite (Bent), and its particle-size distribution, structure and morphology were studied. It was found that the two-stage processing of the original clay resulted in a significant increase in the specific surface area (from 72 to 120 m2 g−1). The prepared Na-MMT powder was modified by two ionic liquids (ILs), namely, 1-ethyl-3-methylimidazolium bis(trifluoromethylsulfonyl)imide (EMImNTf2) and 1-butyl-3-methyl-imidazolium bis(trifluoromethylsulfonyl)imide (BMImNTf2). Several methods, such as SEM, XRD, TG, DSC, FTIR spectroscopy were used to study the structure and thermal behavior of the produced ionogels. The effects of the IL cation on thermal characteristics of the Na-MMT/IL ionogels were studied. Using the DSC, characteristic temperatures of glass transition, crystallization and melting were determined for Na-MMT/IL composites. Taking into account the literature data and using the method of thermogravimetric analysis, it was shown that ionogel formation was accompanied by a decrease in the thermal stability of the IL.
1 Introduction
Recently, functional materials based on various clay minerals have been the subject of intensive research in connection with the possibility of their practical application in many industries, medicine, as well as for solving environmental problems.1,2Clay minerals are widely used in daily life due to their availability, low cost, unique texture and physicochemical properties, such as developed specific surface area, high adsorption and ion-exchange properties, thermal stability and the presence of active centers of various origins. One of the important clay minerals is montmorillonite (MMT). It belongs to the structural family of 2![[thin space (1/6-em)]](https://www.rsc.org/images/entities/char_2009.gif) :1 phyllosilicates, whose structure includes layers of silicon–oxygen tetrahedra, between which aluminum-oxygen octahedra are enclosed.3 The MMTs plates have a thickness of about 1 nm.
:1 phyllosilicates, whose structure includes layers of silicon–oxygen tetrahedra, between which aluminum-oxygen octahedra are enclosed.3 The MMTs plates have a thickness of about 1 nm.
The lamella plates are bonded to each other by weak interaction forces (van der Waals bonds) and form packets with regular galleries between the individual layers.4 Therefore, layers can be easily separated from each other. Stabilization of silicate layers by van der Waals can lead to self-assembly.
Some silicon ions (Si4+) in tetrahedral positions are replaced by aluminum ions (Al3+), and some aluminum ions in octahedral positions are replaced by magnesium ions (Mg2+) and iron ions (Fe2+/Fe3+). This leads to a negative structural charge, which is compensated by interlayer (exchange) cations.5 The main exchange cations are Ca2+ and Na+. The cations can be exchanged by inorganic cations that come from organic molecules, quaternary ammonium compounds, surfactant and ionic liquids.6,7
Ionic liquids are a class of low-temperature salt melts with a melting point below 100 °C, consisting of bulk organic cations (imidazolium, pyridinium, alkylphosphonium or alkylammonium ions) and inorganic or organic anions. Some ionic liquids remain liquid even at ambient temperature.8,9 Due to their properties, such as a wide range of liquid temperatures (up to minus 70–90 °C), high chemical and thermal resistance, low vapor pressure, non-flammability and excellent solvation ability, ionic liquids are widely used in various industries.10 The literature contains information on the use of ionic liquids in energy devices and converters, as electrolytes for batteries, capacitors, solar cells, catalytic media, and analytical chemistry.11–14 It should be noted that IL can be used in devices that operate at elevated temperatures for a long time. Ionic liquids are good solvents for a wide range of inorganic, organic and polymeric materials. They are widely used in green chemistry as alternative solvents in organic synthesis.15
Among compounds of this class, ILs based on the N,N-dialkylimidazolium cation and bis (trifluoromethylsulfonyl) imide are the most studied.10,16,17 The use of these ionic liquids has been reported in thin-film transistors, fuel cells and batteries, as well as in organic light-emitting devices.18,19
In the last two decades, the attention of scientists has been attracted by ionic liquids as modifiers of layered silicates. It was shown that the modification of the clay surface by ionic liquids occurs through the intercalation and adsorption of organic cations into the structure of the material.20–24
The interaction of clays with organic cations of ionic liquids proceeds by the mechanism of ion exchange. The replacement of inorganic exchangeable cations with organic ones changes the surface properties of clays from hydrophilic to hydrophobic and significantly increases the distance between aluminosilicate layers. Additional saturation of MMT interlayer cavities will lead to the production of hybrid materials with improved physicochemical properties as compared to natural silicates. Analysis of the literature shows the possibility of using such composite materials, so-called ionogels, as adsorbents for organic substances and metal ions, catalysts, substrates for solid-phase extraction, etc.25–29
It should be especially emphasized that ionogels are of significant interest for creating new types of solid electrolytes for electrochemical devices and as greases that operate in a wide temperature range.30–33 Clays (one of the components of ionogels) have high Bronsted and Lewis acidity, which makes them catalytically active in various organic and inorganic reactions.34 Therefore, studies of the effect of the filler on the thermal stability of ionogels are important for clarifying the regularities associated with the stability of ionogels in a wide temperature range.
In the current work, montmorillonite was synthesized based on Dash-Salakhlinsky bentonite, which is characterized by a high content of montmorillonite, comparable to the best samples of other bentonite deposits in the world. Then, montmorillonite was enriched with Na+ ions and modified by two methylimidazolium-based ionic liquids: 1-ethyl-3-methylimidazolium bis(trifluoromethylsulfonyl)imide (EMImNTf2) and 1-butyl-3-methyl-imidazolium bis(trifluoromethylsulfonyl)imide (BMImNTf2). The structure, morphology, and thermal behavior of the resulting Na-MMT/IL ionogels were investigated.
It should be noted that in the mentioned papers,23,24 ionic liquids were intercalated into the layered structure of the Na-MMT by dispersion in aqueous solutions, and the main goals were to study the IL adsorption on Na-MMT and ion exchange. In contrast, in the studies presented, we focused on the effects of clay on the properties of IL and vice versa. In particular, we found that the thermochemical characteristics of the prepared ionogels differed from those for the corresponding ILs.
2 Materials and methods
2.1 Materials
Bentonite of the Dash-Salakhlinsky deposit (Republic of Azerbaijan) was used in the current work. This deposit is a type of high-quality sodium and alkaline-earth bentonite. In mineralogical terms, this bentonite contains more than 80% montmorillonite. The chemical composition of the Dash-Salakhlinsky bentonite is given in Table 1. The loss of ignition is equal to 15.99 wt%.| Oxide | SiO2 | Al2O3 | Fe2O3 | CaO | MgO | Na2O | K2O |
| Value (wt%) | 57.70 | 13.75 | 5.27 | 2.49 | 2.67 | 1.90 | 0.23 |
The ionic liquids of 1-ethyl-3-methylimidazolium bis(trifluoromethylsulfonyl)imide (EMImNTf2) and 1-butyl-3-methyl-imidazolium bis(trifluoromethylsulfonyl)imide (BMImNTf2) were purchased from Sigma-Aldrich (USA). These chemicals were used without further purification.
Fig. 1 shows the structural formulas for the cations and anion in the IL under study; the cations differ in the number of carbon atoms. Below, we demonstrate that this structural difference causes a significant difference in phase transitions upon heating.
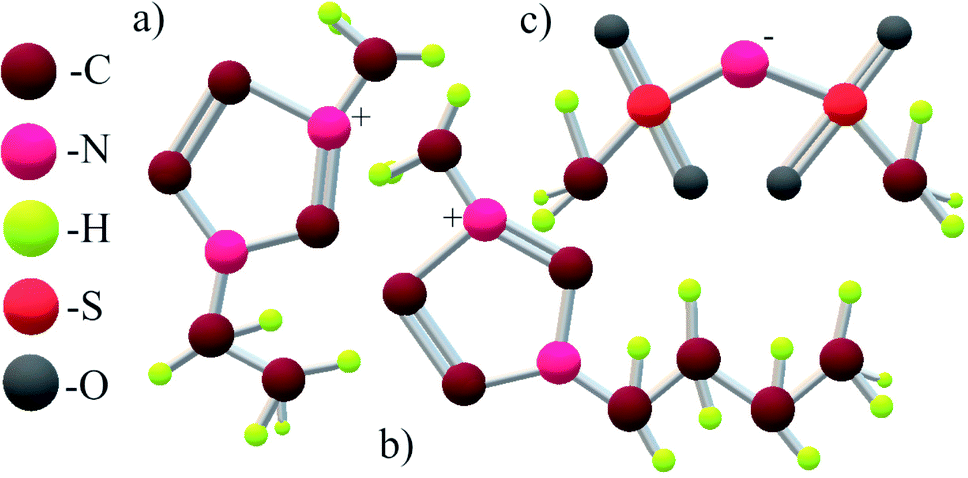 | ||
| Fig. 1 Structural formulas of the 1-ethyl-3-methylimidazolium cation [EMIm]+ (a), the 1-butyl-3-methylimidazolium cation [BMIm]+ (b) and the bis(trifluoromethylsulfonyl)imide anion [NTf2]− (c). | ||
The synthesis of the Na-MMT samples was carried out in two stages (Fig. 2). Firstly, montmorillonite was obtained from natural bentonite by the elutriation method. For these purposes, 20 g of bentonite clay was dissolved in 1 L of distilled water and settled for 24 hours. After sedimentation, the upper part of the dispersed phase was separated and centrifuged. Then, the selected fraction was dried at a temperature of 100 °C. In the second stage, the elutriated montmorillonite (MMTelutr) was enriched with Na+ ions. To do this, MMT was treated with a 1 M NaCl solution (10 g of clay per 1 L of solution) with continuous stirring on a magnetic stirrer with heating (80 °C) for 3 hours.
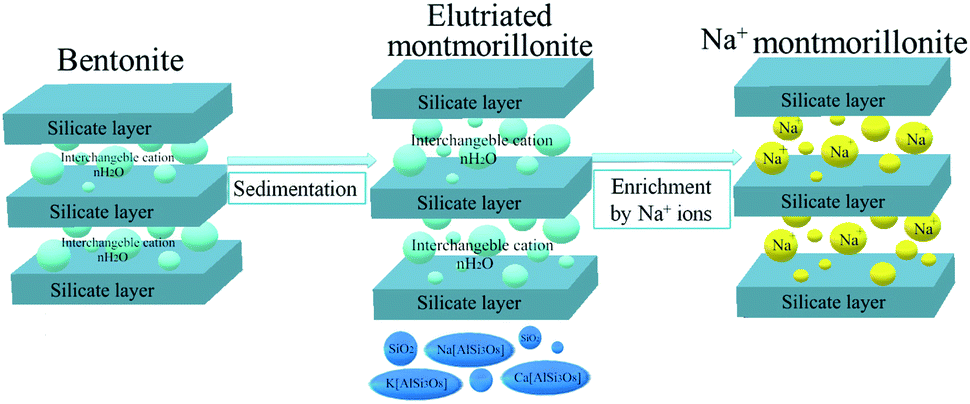 | ||
| Fig. 2 Scheme showing the two-stage processing of natural bentonite for Na-MMT synthesis. | ||
The cation exchange capacity (CEC) of Na-MMT was determined using the methylene blue adsorption method.35 The found value (84 meq./100 g of dry clay) correlates with the data reported in the literature.26,36
The Na-MMT/IL composites were produced by mixing the components with a vibration shaker IKA VORTEX 4 basic (IKA-Werke GmbH & Co. KG, Germany). The resulting mixture was placed in an ultrasonic bath CT-431D2 (CTbrand Wahluen Electronic Tool Co. Ltd., China) for 2 hours, and then in a vacuum drying oven LT-VO/20 (Labtex, Russia) at a temperature of 80 °C for 24 hours. The synthesized ionogel was centrifuged at 6000 rpm for 45 minutes. Then, the excess ionic liquid was removed, and the remaining saturated ionogel was kept for 2 weeks, controlling the delamination. Upon delamination, the excess ionic liquid was again removed.
2.2 Methods and apparatus
000 nm range. Before testing, a suspension of clay in distilled water was prepared, sonicated and kept for 24 hours.3 Results and discussion
3.1 Granulometric analysis of the clay samples under study
The DLS results for the studied clay powders are shown in Fig. 3(a and b). As can be seen from Fig. 3a, the original bentonite predominantly contains particles less than 7000 nm in diameter. Size distribution is bimodal with maxima near 459 and 5560 nm.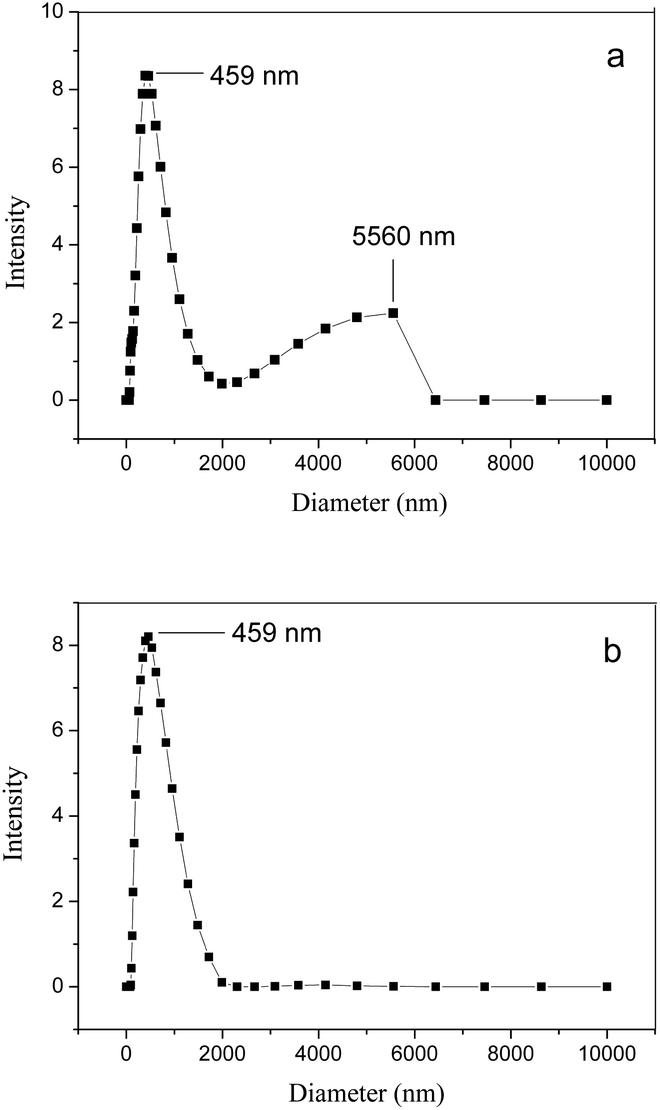 | ||
| Fig. 3 DLS particle-size distribution of the natural bentonite (a) and Na-MMT (b) powders. | ||
Unlike the original bentonite, the Na-MMT powder lacks a fraction of larger particles (with diameters of 2000–6500 nm). In this case, the particle-size distribution is monomodal (Fig. 3b). Note that for the MMTelutr sample obtained as a result of the first stage of processing, the particle-size distribution is almost the same as that for the Na-MMT powder; therefore, we did not give it here.
3.2 Porous structure of the clay samples under study
The low-temperature nitrogen adsorption–desorption was used to quantify the porosity of the original bentonite, as well as its changes during the two-stage synthesis of the Na-MMT.Fig. 4 shows that all the isotherms belong to type IV, according to the IUPAC classification.37 This type of isotherm is typical of solid bodies with mesopores.
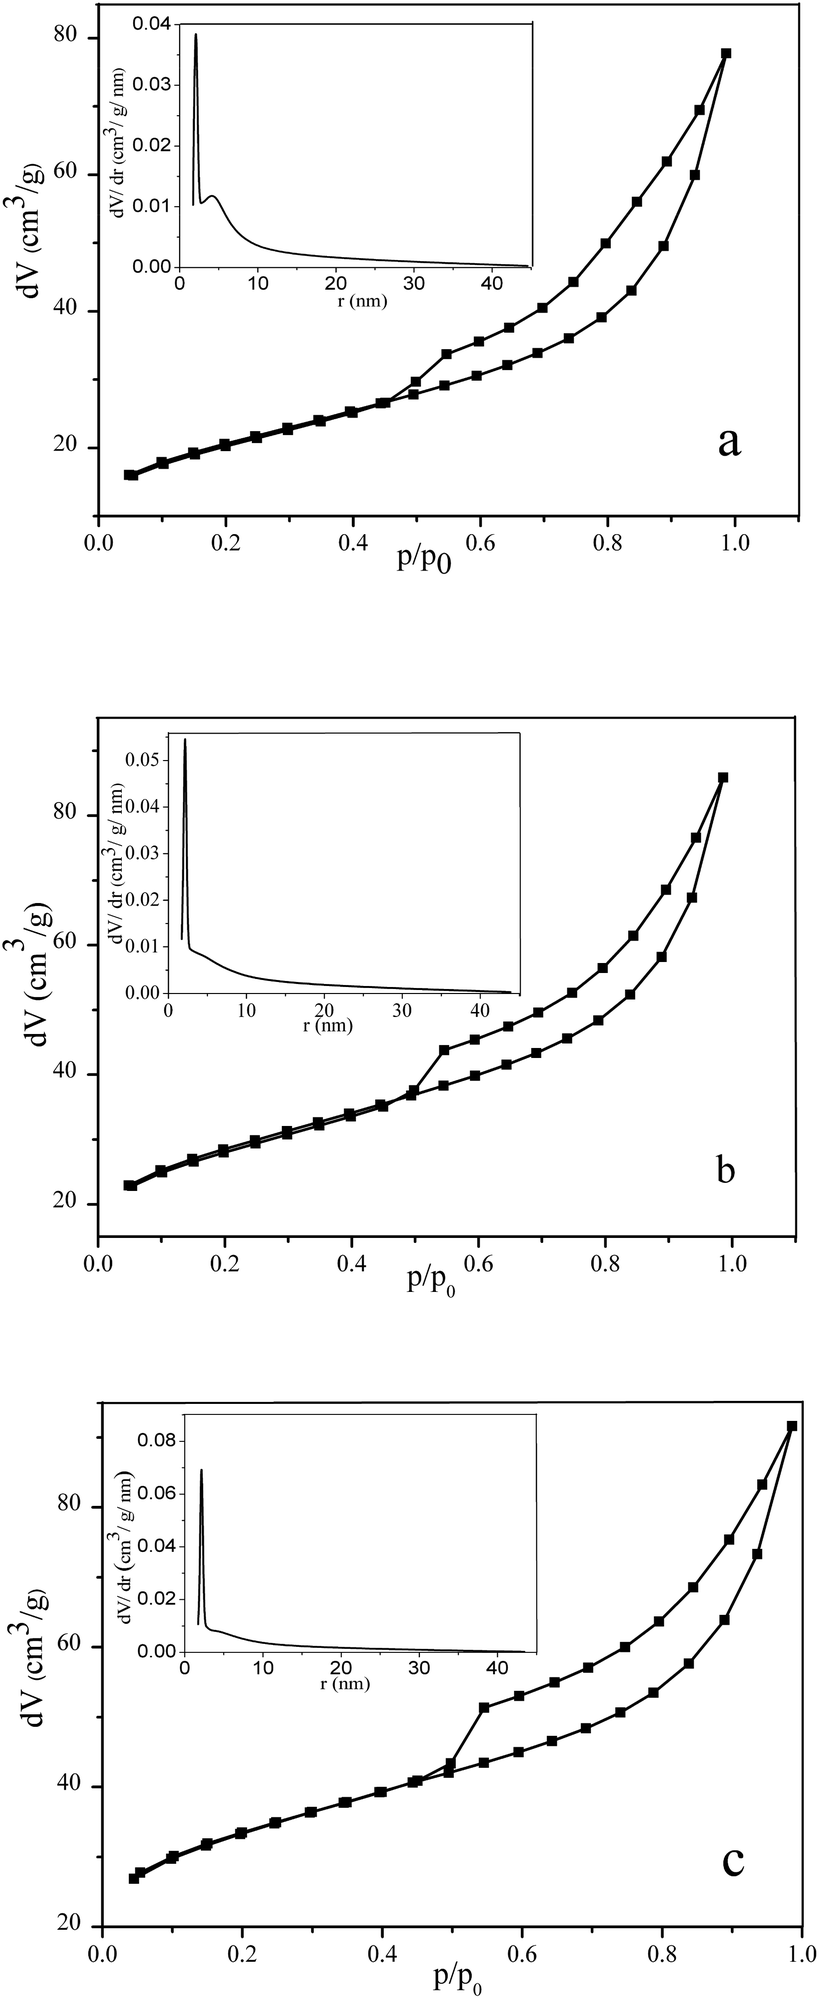 | ||
| Fig. 4 Isotherms of the N2 low-temperature adsorption–desorption and BJH pore-size distributions (insertions) for natural bentonite (a), MMTelutr (b), and Na-MMT (c). | ||
Analysis of the recorded isotherms was carried out using the Brunauer–Emmett–Teller (BET) and Barrett–Joyner–Halenda (BJH) models. The following parameters were found.
SBET is the specific surface area determined from isotherms using the BET model.
VT is the total pore volume defined as the volume of liquid nitrogen corresponding to the amount adsorbed at a relative pressure (P/P0) of 0.99.
rav is the average pore radius.
rprob is the most probable pore radius corresponding to the peak of the BJH pore-size distribution.
Table 2 shows the listed values determined for bentonite, MMTelutr, and Na-MMT powders.
| Powder | SBET (m2 g−1) | VT (cm3 g−1) | rav (nm) | rprob (nm) | df |
|---|---|---|---|---|---|
| Bent | 72.47 | 0.120 | 3.27 | 2.15 | 2.65 |
| MMTelutr | 102.29 | 0.133 | 2.60 | 2.14 | 2.72 |
| Na-MMT | 119.67 | 0.142 | 2.38 | 2.14 | 2.74 |
It can be seen that the two-stage processing of clay leads to a significant increase in the specific surface area, while the total volume of the porous space increases slightly. This effect is fully correlated with the fact that the Na-MMT powder has a larger number of small pores than the original bentonite (Table 2, column 4).
Insertions in Fig. 4a–c show the pore-size distributions for Bent, MMTelutr, and Na-MMT samples plotted using the BJH model. We can see that almost 100% of the total pore volume is pores with a radius smaller than 15 nm. This provides evidence for the framework mesoporosity of the clay samples under study. All pore-size distributions were narrow with peaks at 2.14–2.15 nm. A small peak at 4 nm was observed only for the original clay sample. Although the position of the main peak (2.14–2.15 nm) practically does not change, its height increases in the sequence of Bent < MMTelutr < Na-MMT. This means that the two-stage treatment of bentonite increased the contribution of pores with a specified size to the total volume of the pore space filled with nitrogen.
To quantitatively evaluate the heterogeneities of the clay samples, the fractal Frenkel–Halsey–Hill (FHH) model38 was applied. Data for low-temperature nitrogen adsorption/desorption were utilized to determine the surface fractal dimensions of the porous materials (df). The values of df for the current powder materials were determined using eqn (1), which take adsorbate surface tension effects into account:
 | (1) |
In this equation, Vads is the adsorbed volume and Vm is the volume necessary for the formation of one monolayer, so the  ratio represents the surface fractional coverage. It can be seen in eqn (1) that value of df can be calculated from the slope of the plot
  vs.
vs. 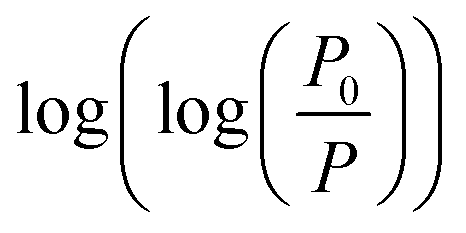 .
.
The data on the fractal dimension for Bent, MMTelutr, and Na-MMT powders found in this way are shown in Table 2. These values provide evidence that the researched powder has an extended surface. The fractal dimension (as a quantitative indicator of the heterogeneity pore-size distribution) increases in the sequence of Bent < MMTelutr < Na-MMT.
In accordance with the data of low-temperature nitrogen adsorption/desorption, the studied clay samples can be attributed to mesoporous bodies. The two-stage processing of the original bentonite results in an increase in the surface area, the total pore volume, and the fraction of smaller pores.
3.3 Surface morphologies of clay and the synthesized clay/IL ionogel samples
The surface morphologies of bentonite, Na-MMT and Na-MMT/IL composites were investigated using SEM and are presented in Fig. 5 and 6.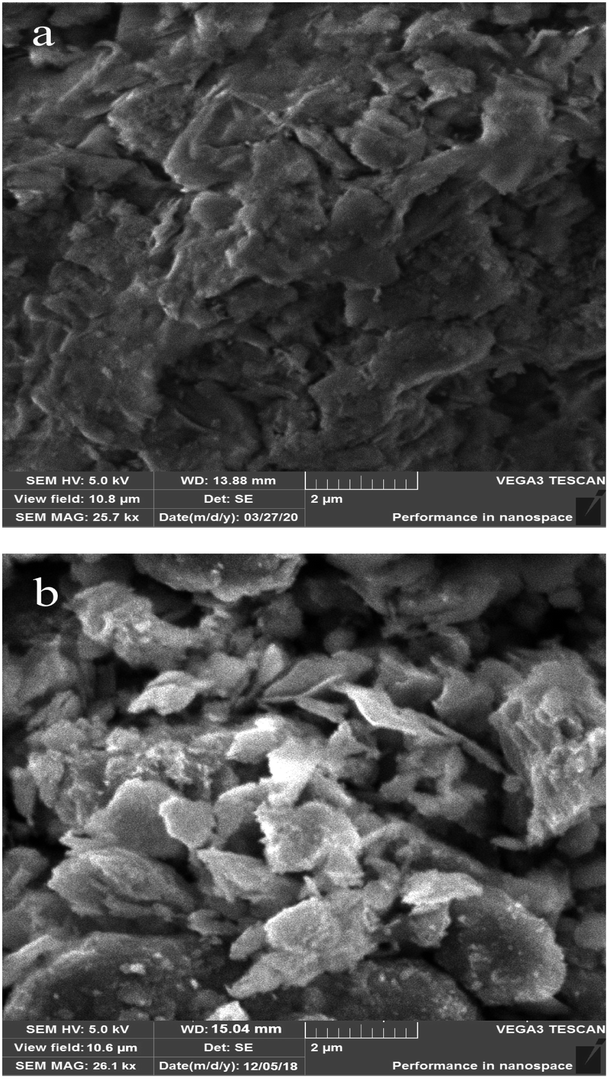 | ||
| Fig. 5 SEM-images of bentonite (a) and Na-MMT (b) surfaces. | ||
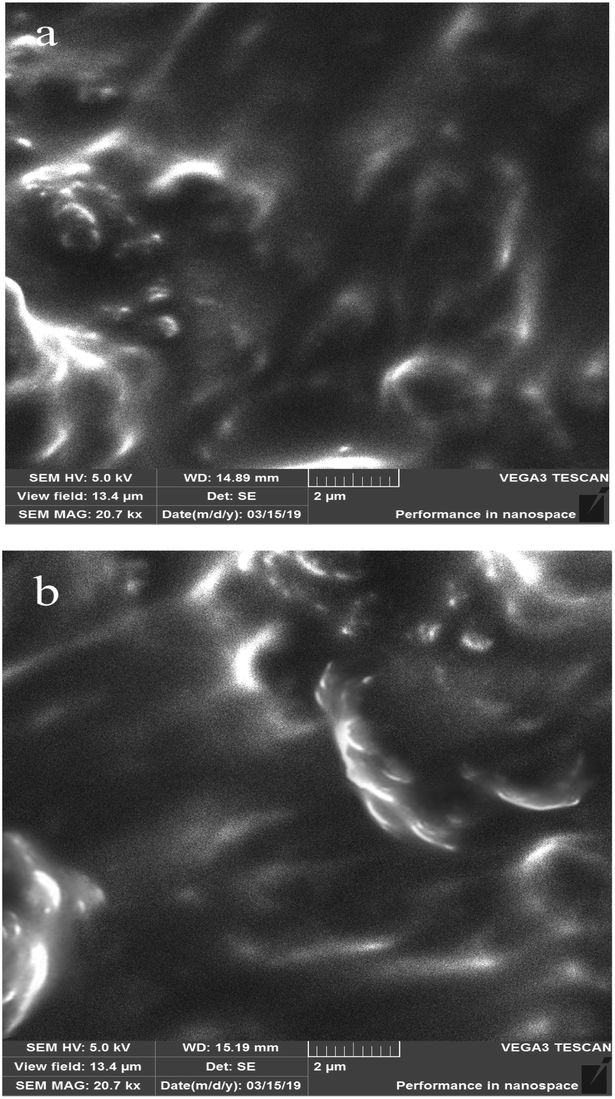 | ||
| Fig. 6 SEM-images of the Na-MMT/BMImNTf2 (a) and Na-MMT/EMImNTf2 (b) surfaces. | ||
Fig. 5b shows that the Na-MMT powder has aggregate particles on its surface characterizing the tightly stacked silicate layers. The aggregate sizes correlate with the granulometric data (Fig. 3b).
It can be seen from Fig. 6(a and b) that the composite of Na-MMT with methylimidazolium-based ionic liquids has a massive thin-layered structure with some interlayer spaces. This interlayer space may be occupied by organic molecules. Thus, the Na-MMT/IL composite is an ionic liquid filled with aggregated montmorillonite particles and the ionic liquid completely surrounds the clay particles.
3.4 Crystal structure of the studied clay powders and clay/IL composites
To obtain information on the structural changes occurring in the clay during its processing, the WAXS technique was used. Fig. 7 shows the X-ray diffraction patterns for bentonite, MMTelutr, and Na-MMT powders.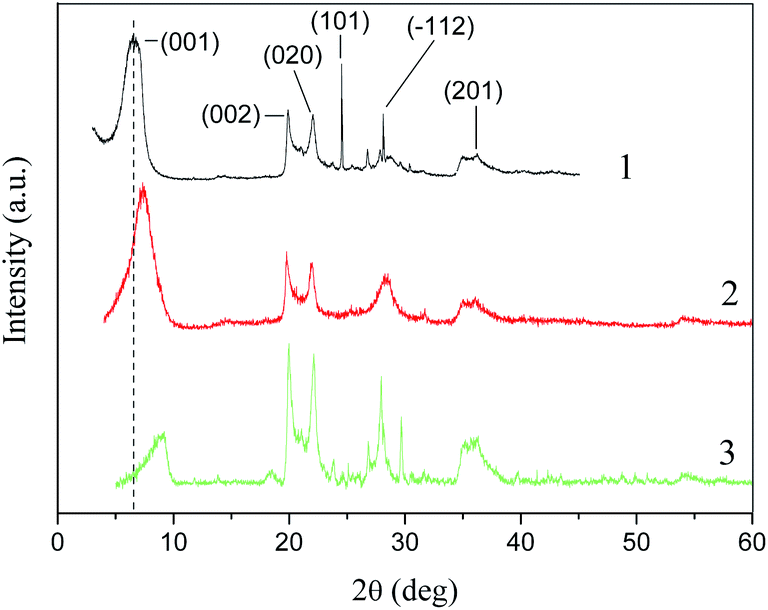 | ||
| Fig. 7 WAXS patterns for bentonite (1), MMTelutr (2), and Na-MMT (3). | ||
The pattern of the original bentonite contained reflexes corresponding to MMT ((001), (002), (020), (201)), quartz (101), and plagioclase (−112). However, the (101) reflex disappeared at the first stage of processing (Fig. 7, pattern 2).
A shift of the (001) reflex to large angles as a result of the first and then second processing stages was observed (Table 3). This indicates a decrease in the basal distance in the clay mineral. Thus, a two-stage treatment of natural bentonite affects the self-assembly of silicate layers. It has been reported by Takahashi et al.39 that the basal distance at the (001) reflex of the dried montmorillonite powder was equal to 0.968 nm. This result is in good agreement with the present XRD data.
| Sample | 2θ0 (deg) | d001 (nm) | L (nm) |
|---|---|---|---|
| Bent | 6.50 | 1.36 | 49.26 |
| MMTelutr | 7.35 | 1.20 | 41.86 |
| Na-MMT | 9.20 | 0.96 | 49.34 |
| Na-MMT/BMImNTf2 | 6.41 | 1.38 | 90.95 |
| Na-MMT/EMImNTf2 | 6.96 | 1.27 | 83.61 |
Fig. 8 shows the X-ray diffraction patterns for the Na-MMT powder, as well as for the Na-MMT/BMImNTf2 and Na-MMT/EMImNTf2 ionogels. Compared to the Na-MMT pattern, we can see that the (001) reflex was shifted to 1.38 nm due to the intercalation of the BMImNTf2. Similarly, the (001) reflex shift to 1.24 nm was observed due to the EMImNTf2 intercalation. The crystallite size (L) as determined by the Scherrer method, for Na-MMT/IL composites was larger than in the Na-MMT (Table 3). This effect indicates the intercalation of the IL molecules into the clay cavities and their adsorption between splayed platelets at the tactoid edges.
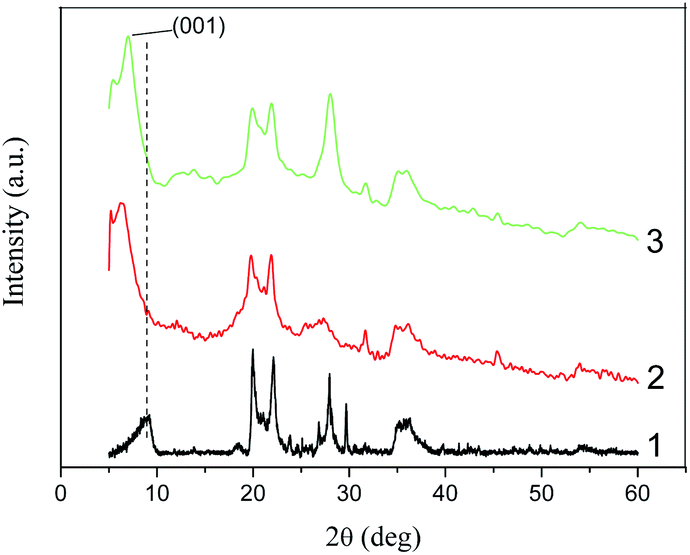 | ||
| Fig. 8 WAXS patterns for Na-MMT (1), Na-MMT/BMImNTf2 (2), and Na-MMT/EMImNTf2 (3). | ||
However, it should be recognized that intercalation is only partial. The fact is that cations interact with silicate layers, which are negatively charged. The basal distance is the sum of the silicate plate thickness and the interlayer space (gallery) in which the cations are located.4 When the inter-layer spaces are filled, the intercalated IL ions are oriented in the “tail-to-head” fashion. Cations of IL can be located in the gallery at certain angles, depending on the size of both the gallery and the ions.39
In the current study, we calculated these angles using a simple geometric model,40 taking into account the results of the X-ray analysis and the sizes of the cations. We found that for the intercalated [BMIm]+ cation (0.66 nm in diameter41), this angle was 39.5°, and for the intercalated [EMIm]+ cation (0.606 nm in diameter39), this angle was 30.8°. Based on these calculations, a schematic structure could be proposed for the studied Na-MMT/IL ionogels and is shown in Fig. 9.
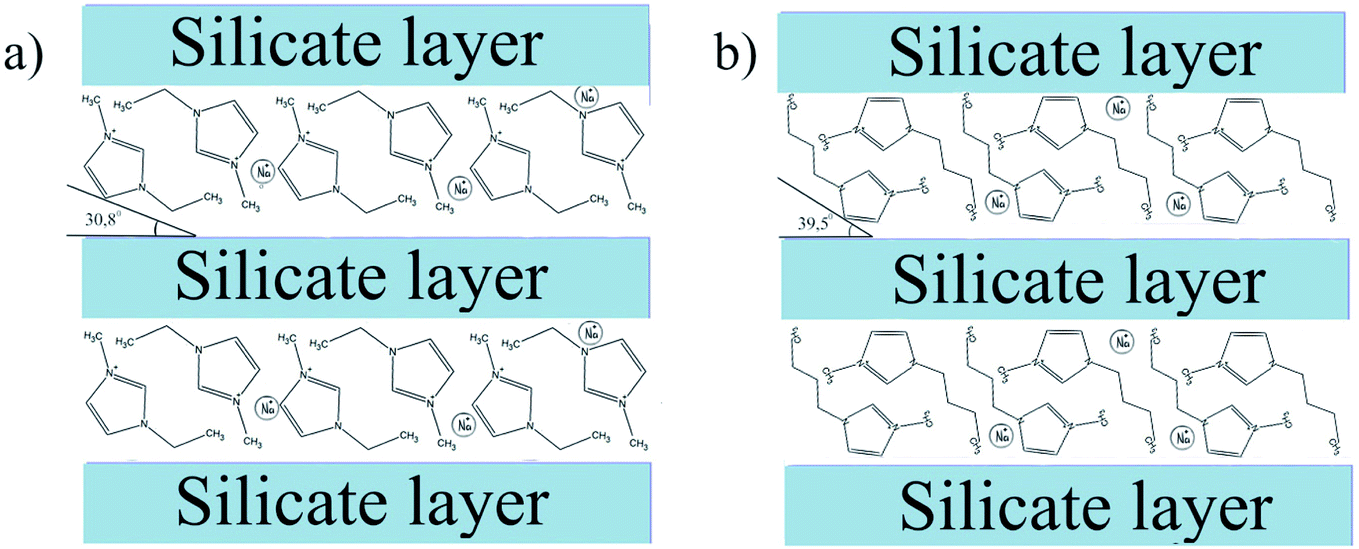 | ||
| Fig. 9 Schematic structure of the Na-MMT/EMImNTf2 (a) and Na-MMT/BMImNTf2 ionogels. | ||
The IL anions interact with the outer surface of the clay particles, which is positively charged. Thus, we can say that the structure of the ionogels is complex, and it is formed by a framework of clay particles containing IL cations in the inner interlayer space, and in the outer layer. The outer layer is formed by IL anions adsorbed on the surface of the plates, compensating their charge with sodium cations displaced due to ion exchange, and a bulk ionic liquid filling the macrospace formed as a result of contacts between clay particles. This is clearly reflected in the thermal behavior of the ionogels.
3.5 Phase transitions in the clay/IL composites
Fig. 10 and 11 show the DSC patterns of the second heating cycles for the studied clay/IL ionogels recorded in the temperature range from −110 to +100 °C. In these graphs, the inflection point of the curve corresponds to the glass transition temperature (Tg), the exothermic peak (Tc) corresponds to crystallization, and the endothermic peak (Tm) corresponds to the melting point. The characteristic parameters of the observed phase transitions are given in Tables 4 and 5.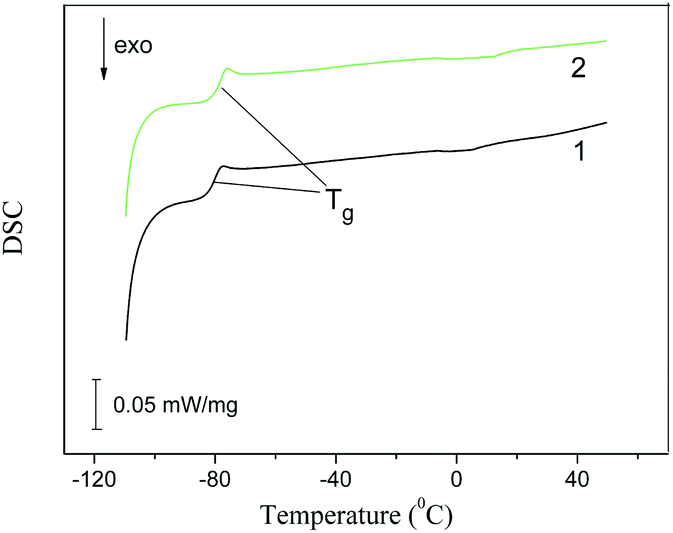 | ||
| Fig. 10 DSC traces of the second heating cycle for the Bent/BMImNTf2 (1) and Na-MMT/BMImNTf2 (2) composites. | ||
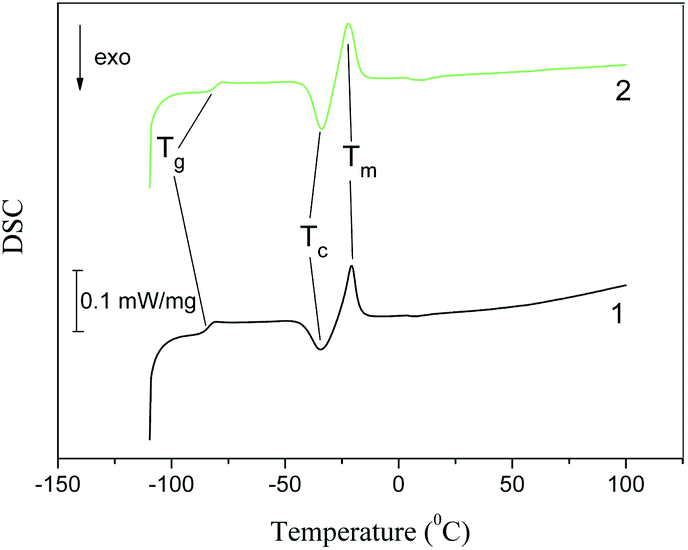 | ||
| Fig. 11 DSC traces of the second heating cycle for the Bent/EMImNTf2 (1) and Na-MMT/EMImNTf2 (2) composites. | ||
| Parameter | Bent/BMImNTf2 | Na-MMT/BMImNTf2 | BMImNTf2 |
|---|---|---|---|
| a Reported by Alekseeva et al.21b Reported by Ramenskaya et al.17 and recalculated taking into account the molecular weight of BMimNTf2 (419.37 g mol−1).c Reported by Dzyuba et al.42 | |||
| Tg (°C) | −80.2 | −78.0 | −86.3a |
| −86.8b | |||
| ΔC (J (g K)−1) | 0.165 | 0.169 | 0.393b |
| 0.09c | |||
| Parameter | Bent/EMImNTf2 | Na-MMT/EMImNTf2 | EMImNTf2 |
|---|---|---|---|
| a reported by Ramenskaya et al.17 and recalculated (ΔC value) taking into account the molecular weight of EMImNTf2 (391.31 g mol−1).b reported by Dzyuba et al.42 | |||
| Tg (°C) | −83.7 | −79.7 | −91.7a |
| ΔC (J (g K)−1) | 0.167 | 0.125 | 0.122a |
| 0.02b | |||
| Tc (°C) | −33.7 | −33.4 | −45.9a |
| Tm (°C) | −21.9 | −21.9 | −19.3a |
The thermograms for composites with BMImNTf2 are presented in Fig. 10. For such systems, the thermograms had only an inflection point corresponding to Tg, and there were no crystallization or melting peaks. As Table 4 shows, the introduction of clay into the IL increased the glass transition temperature of BMImNTf2 by 6–8 °C. However, it is not possible to evaluate the effect of clay on the change in the specific heat capacity during the glass transition, since the literature data on the ΔC values differ greatly for both BMImNTf2 and EMImNTf2 (Tables 4 and 5).
Fig. 11 shows DSC curves for clay/EMImNTf2 ionogels, where the thermograms have an inflection point corresponding to Tg. The heating of the samples led to the appearance of a broad exothermic peak of crystallization and then to an endothermic peak of melting.
Table 5 shows that for the clay/EMImNTf2 composites, the glass transition temperature is 8–12 degrees higher than for the pure IL. Other quantitative indicators of thermal behavior also change. We can state the “confinement” effect, i.e., change in the properties of both BMImNTf2 and EMImNTf2 upon intercalation into the clay.
3.6 Thermal degradation of the clay/IL ionogels
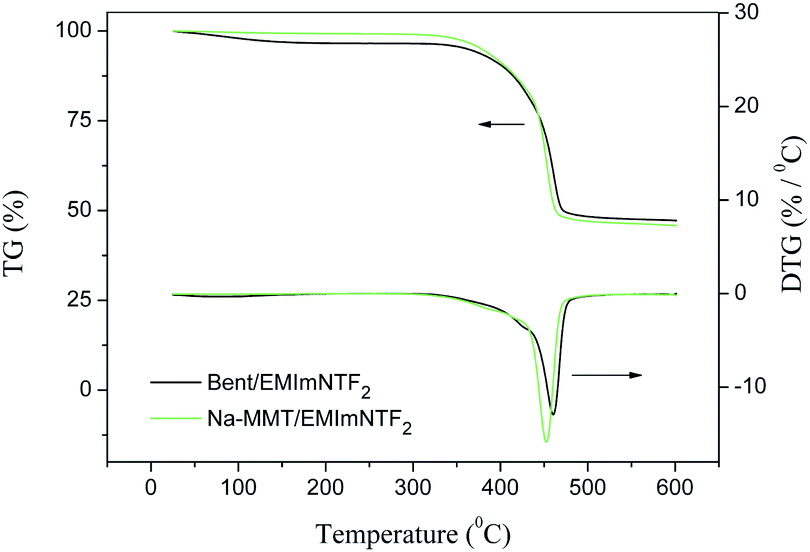
Fig. 12 and 13 show the TG and DTG traces recorded for the studied clay/IL composites.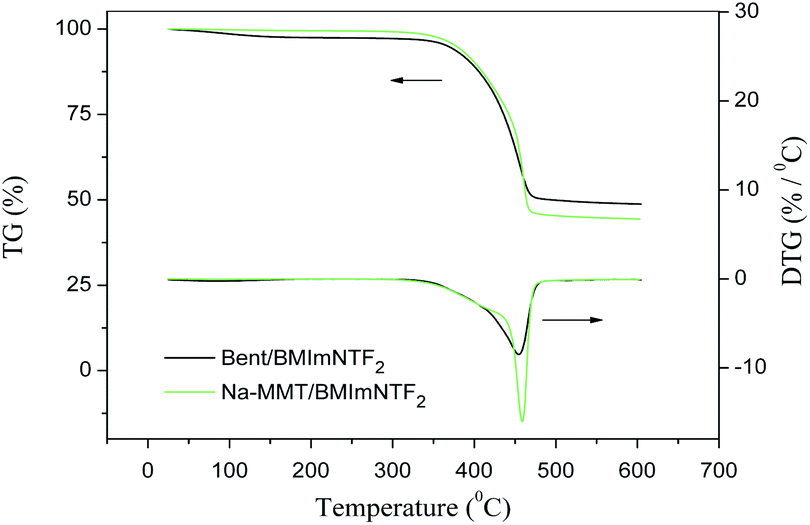 | ||
| Fig. 12 TG and DTG traces recorded for the clay/BMImNTf2 ionogels. | ||
 | ||
| Fig. 13 TG and DTG traces recorded for the clay/EMImNTf2 ionogels. | ||
The thermal degradation of the studied materials proceeded in two stages. In the first stage, the mass reduction in the samples (Δm1) was caused by water removal; this value did not exceed 3.5% (Tables 6 and 7). Note that the first stage was absent for individual ILs.17 This difference can be explained by the presence of water in the clay pores.
| Parameter | Bent/BMImNTf2 | Na-MMT/BMImNTf2 | BMImNTf2 | |
|---|---|---|---|---|
| a Reported by Ramenskaya et al.17b Reported by Alekseeva et al.21 | ||||
| First stage | ||||
| T1 (°C) | 62.5 | 60.5 | — | |
| T2 (°C) | 143.6 | 157.9 | — | |
| Δm1 (%) | 2.61 | 0.55 | — | |
|
||||
| Second stage | ||||
| T10% (°C) | 396.1 | 401.1 | 420a | |
| Td (°C) | 454.6 | 459.0 | 481.5b | |
| Tend (°C) | 468.8 | 466.6 | 500.1b | |
| Δm2 (%) | 48.59 | 55.05 | 90.4b | |
| mIL (%) | 48.02 | 54.91 | — | |
| Parameter | Bent/EMImNTf2 | Na-MMT/EMImNTf2 | EMImNTf2 |
|---|---|---|---|
| a Reported by Ramenskaya et al.17b Reported by Ramenskaya et al.43 | |||
| First stage | |||
| T1, °C | 54.5 | 58.9 | — |
| T2, °C | 146.4 | 132.2 | — |
| Δm1, % | 3.48 | 0.83 | — |
|
|||
| Second stage | |||
| T10% | 403.2 | 406.1 | 444a |
| Td, °C | 460.4 | 452.4 | 479b |
| Tend, °C | 469.2 | 461.8 | 500a |
| Δm2, % | 49.30 | 53.29 | 90a |
| mIL, % | 45.04 | 52.36 | — |
The onset and end temperatures (T1 and T2) of the first stage for composites were determined by the tangent intersection method. As can be seen from Tables 6 and 7, the temperature interval of the first stage was 50–160 °C.
The second step is associated with the IL thermolysis and was manifested in the rapid reduction of the sample mass. To characterize the degradation process we used the following parameters:
T10% is the temperature of the 10% mass-loss.
Td is the temperature at the maximum rate of mass-loss that corresponds to the minimum of the DTG trace.
Tend is the degradation end temperature determined by the tangent intersection method.
Δm2 is the mass reduction in the second stage.
In addition to the listed values for composites found in the current study, Tables 6 and 7 provide literature data on similar parameters for individual ILs. At the transition from the IL to the clay/IL composite, values of T10% and Td decreased considerably. This means that the interaction of the IL with alumosilicate decreased its thermal stability. This effect was observed for both BMImNTf2 and EMImNTf2 and is evidently associated with the weakening of the cation–anion bonds in IL, as well as the formation of intermolecular bonds with the active groups in clay.
On comparing the DTG traces in Fig. 12 and 13, we can conclude that for composites with Na-MMT, the maximum thermal degradations rates were greater than for composites with original bentonite. This effect was also observed regardless of the nature of the ionic liquid under study.
It should be noted that the loss of mass during thermal decomposition correlates with the initial mass fraction of IL in the composite (mIL). This means that when heated to 600 °C, the clay as a component of the clay/IL composite does not thermally decompose. Thus, the results of DSC and TG analysis showed that when interacting with aluminosilicates, the thermal behavior of ILs varied significantly. This may be used to regulate the properties of materials based on IL.
3.7 FTIR spectra of the Na-MMT/IL composites
The FTIR reflection spectra of the Na-MMT powder, pure ionic liquids of BMImNTf2 and EMImNTf2, as well as Na-MMT samples modified with ionic liquids are presented in Fig. 14 and 15.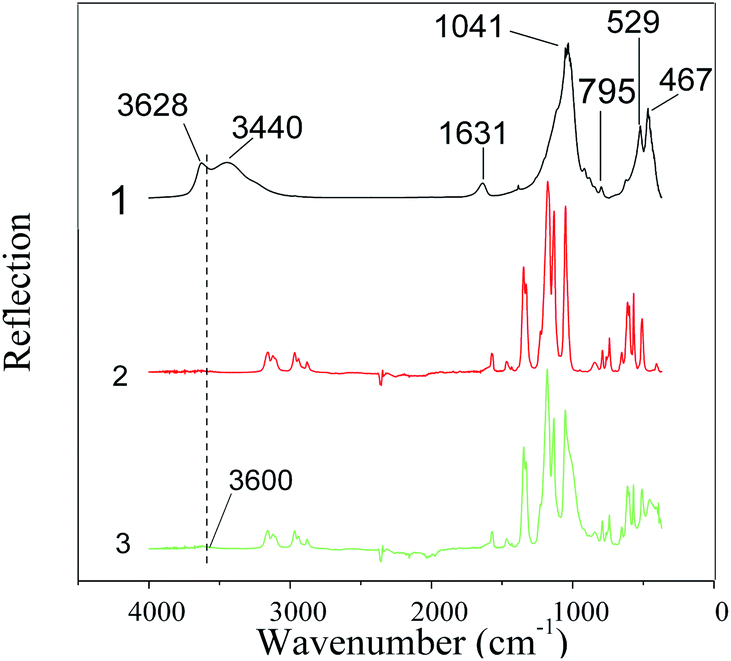 | ||
| Fig. 14 FTIR spectra of Na-MMT (1) BMImNTf2 (2) and Na-MMT/BMImNTf2 (3). | ||
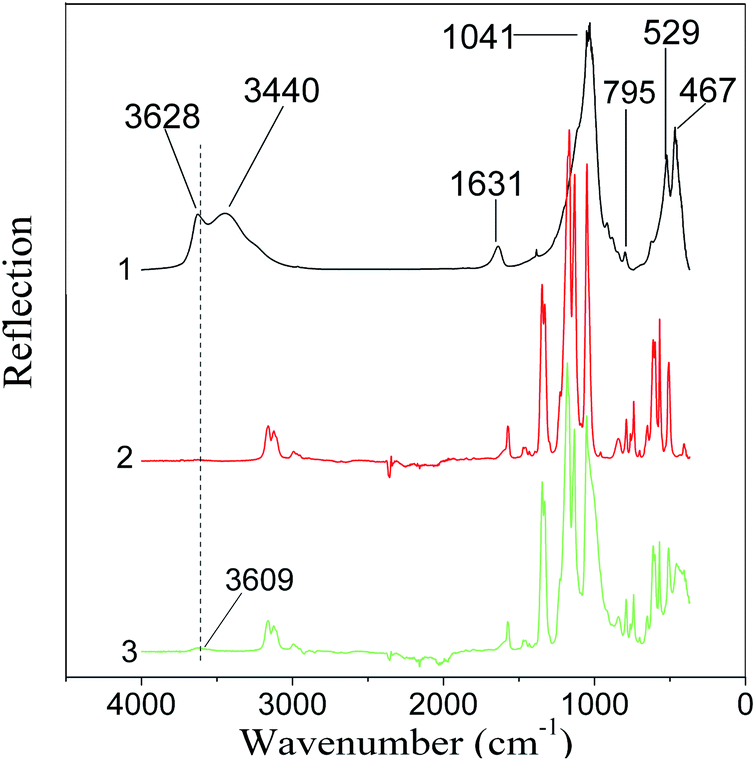 | ||
| Fig. 15 FTIR spectra of Na-MMT (1) EMImNTf2 (2) and Na-MMT/EMImNTf2 (3). | ||
In the IR spectrum of Na-MMT (Fig. 14, spectrum 1), there are bands due to the vibrations of OH groups (3628 and 3440 cm−1) and the stretching modes of absorbed water molecules (1631 cm−1).3 The intense broad band with the maximum at 1041 cm−1 corresponds to the Si–O–Si valence vibrations of the tetrahedra in the silicon–oxygen framework.44 The narrow band at 795 cm−1 corresponds to the deformation vibrations of silanol groups. The magnesium–oxygen (νMgO) bond is assigned to the band between 467 and 529 cm−1.
FTIR spectra of Na-montmorillonite, modified with ionic liquids, show the presence of characteristic bands of inorganic and organic components. In the spectrum of Na-MMT/BMImNTf2, the νOH band belonging to clay at 3440 cm−1 is observed as a small wave centered at 3600 cm−1, which indicates that the introduction of BMImNTf2 leads to a decrease in bound water.21 In the spectrum of the modified Na-MMT, one can see the bands in the region of 2800–3000 cm−1, characteristic of BMImNTf2, which are related to the symmetric and asymmetric stretching vibrations of νCH groups. The peak from 1300 to 800 cm−1 is a superposition of bands belonging to oxygen-containing groups of montmorillonite and BMImNTf2. In the range of 600–400 cm−1, there are peaks of MMT, which changed in comparison to pure clay.
It should be noted that in the spectrum of the Na-MMT/BMImNTf2 ionogel (Fig. 14, spectrum 1), the above-mentioned band at 1631 cm−1 was observed, which associated with absorbed water molecules. This is consistent with the TG analysis results, which demonstrated the dehydration of the samples when heated.
The same trend was observed in the spectrum of the Na-MMT/EMImNTf2 ionogel (Fig. 15).
4 Conclusions
In this work, sodium montmorillonite was synthesized as a result of a two-stage treatment of natural bentonite, and its structure and morphology were studied. It shows that the two-stage processing of the original bentonite increased the surface area, the total pore volume, and the fraction of smaller pores. The Na-MMT synthesized from natural bentonite was used to obtain ionogels with ionic liquids such as 1-ethyl-3-methylimidazolium bis(trifluoromethylsulfonyl) imide and 1-butyl-3-methylimidazolium bis(trifluoromethylsulfonyl) imide. The structures and morphologies of the obtained composites were studied by SEM, XRD, and FTIR methods. The thermal behaviors of the Na-MMT/IL composites and the corresponding ILs were compared using the DSC and TG methods. It was found that the phase transitions in the studied ionogels depended on the nature of the IL cation. The results obtained in the present work show the possibility of modifying the natural clay mineral with ionic liquids, which will allow the formation of new materials with special properties and potential technical and environmental applications.Conflicts of interest
There are no conflicts to declare.Acknowledgements
This research was funded by the Russian Foundation for Basic Research (grant No. 18-29-12012). FTIR, TG and DSC measurements were performed on the equipment of the Upper Volga Regional Center for Physicochemical Studies Center for Collective Use.References
- S. S. Chee, M. Jawaid, O. Y. Alothman and R. Yahaya, RSC Adv., 2020, 10, 21686–21697 RSC.
- O. V. Alekseeva, A. N. Rodionova, A. V. Noskov and A. V. Agafonov, Clays Clay Miner., 2019, 67, 471–480 CrossRef.
- F. Shirini, M. Seddighi, M. Mazloumi, M. Makhsous and M. Abedini, J. Mol. Liq., 2015, 208, 291–297 CrossRef CAS.
- V. A. Gerasin, E. M. Antipov, V. V. Karbushev, V. G. Kulichikhin, G. P. Karpacheva, R. V. Talroze and Ya. V. Kudryavtsev, Russ. Chem. Rev., 2013, 82, 303–332 CrossRef.
- O. Duman and S. Tunc, Microporous Mesoporous Mater., 2009, 117, 331–338 CrossRef CAS.
- L. Wu, L. Liao, G. Lv, F. Qin and Z. Li, Chem. Eng. J., 2014, 236, 306–313 CrossRef CAS.
- D. F. Montano, H. Casanova, W. I. Cardona and L. F. Giraldo, Mater. Chem. Phys., 2017, 198, 386–392 CrossRef CAS.
- T. Welton, Biophys. Rev., 2018, 10, 691–706 CrossRef CAS.
- M. Freemantle, An Introduction to Ionic Liquids, Royal Society of Chemistry, Cambridge, 2009 Search PubMed.
- A. Vioux, L. Viau, S. Volland and J. L. Bideau, C. R. Chim., 2010, 13, 242–255 CrossRef CAS.
- M. P. Singh, R. K. Singh and S. Chandra, Prog. Mater. Sci., 2014, 64, 73–120 CrossRef CAS.
- D. Ho, C. Zhang, L. W. Hantao and J. L. Anderson, Anal. Chem., 2013, 86, 262–285 CrossRef.
- D. Oyamatsu, T. Fujita, S. Arimoto, H. Munakata, H. Matsumoto and S. Kuwabata, J. Electroanal. Chem., 2008, 615, 110–116 CrossRef CAS.
- L. Wu, C. Yang, L. Mei, F. Qin, L. Liao and G. Lv, Appl. Clay Sci., 2014, 99, 266–274 CrossRef CAS.
- C. Dai, J. Zhang, C. Huang and Z. Lei, Chem. Rev., 2017, 117, 6929–6983 CrossRef CAS.
- E. Thomas, K. P. Vijayalakshmi and B. K. George, J. Mol. Liq., 2019, 276, 721–727 CrossRef CAS.
- L. M. Ramenskaya, E. P. Grishina and N. O. Kudryakova, J. Mol. Liq., 2018, 272, 759–765 CrossRef CAS.
- A. Balducci, U. Bardi, S. Caporali, M. Mastragostino and F. Soavi, Electrochem. Commun., 2004, 6, 566–570 CrossRef CAS.
- B. Makhoukhia, D. Villemin and M. A. Didia, J. Taibah Univ. Sci., 2016, 10, 168–180 CrossRef.
- Y. Xi, R. L. Frost, H. He, T. Kloprogge and T. Bostrom, Langmuir, 2005, 21, 8675–8680 CrossRef CAS.
- O. Alekseeva, A. Noskov, E. Grishina, L. Ramenskaya, N. Kudryakova, V. Ivanov and A. Agafonov, Materials, 2019, 12, 2578 CrossRef CAS.
- E. P. Grishina, L. M. Ramenskaya, N. O. Kudryakova, K. V. Vagin, A. S. Kraev and A. V. Agafonov, J. Mater. Res. Technol., 2019, 8, 4387–4398 CrossRef CAS.
- N. H. Kim, S. V. Malhotra and M. Xanthos, Microporous Mesoporous Mater., 2006, 96, 29–35 CrossRef CAS.
- L. Reinert, K. Batouche, J.-M. Leveque, F. Muller, J.-M. Beny and B. Kebabi, Chem. Eng. J., 2012, 209, 13–19 CrossRef CAS.
- A. Naderia, M. A. Delavar, Y. Ghorbani, B. Kaboudin and M. Hosseini, Appl. Clay Sci., 2018, 158, 236–245 CrossRef.
- A. Lawal and B. Moodley, RSC Adv., 2015, 5, 61913–61924 RSC.
- A. Fiscal-Ladino, M. Obando-Ceballos, M. Rosero-Moreano, D. F. Montano, W. Cardona, L. F. Giraldo and P. Richter, Anal. Chim. Acta, 2017, 953, 23–31 CrossRef.
- Z. Li, W. T. Jiang, P. H. Chang, G. Lv and S. Xu, J. Hazard. Mater., 2014, 270, 169–175 CrossRef CAS.
- G. K. Dedzo and C. Detellier, Adv. Funct. Mater., 2018, 28, 1703845 CrossRef.
- F. Ilie and C. Covaliu, Lubricants, 2016, 4, 12 CrossRef.
- Y. Zhou and J. Qu, ACS Appl. Mater. Interfaces, 2017, 9, 3209–3222 CrossRef CAS.
- A. Agafonov and E. Grishina, Russ. J. Inorg. Chem., 2019, 64, 1641–1648 CrossRef CAS.
- D. R. MacFarlane, M. Forsyth, P. C. Howlett, J. M. Pringle, J. Sun, G. Annat, W. Neil and E. I. Izgorodina, Acc. Chem. Res., 2007, 40, 1165–1173 CrossRef CAS.
- M. Caine, G. Dyer, J. V. Holder, B. N. Osborne, W. A. Matear, R. W. McCabe, D. Mobbs, S. Richardson and L. Wang, in Natural Microporous Materials in Environmental Technology. NATO Science Series (Series E: Applied Sciences), ed. P. Misaelides, F. Macášek, T. J. Pinnavaia and C. Colella, Springer, Dordrecht, 1999, vol. 362, pp. 49–62 Search PubMed.
- G. Morais, I. A. Silva, B. M. A. B. Buriti, J. V. Fernandes, D. S. Silva, G. A. Neves and H. S. Ferreira, Ceramica, 2020, 66, 81–87 CrossRef.
- M. T. Caccamo, G. Mavilia, L. Mavilia, D. Lombardo and S. Magazù, Materials, 2020, 13, 1100 CrossRef CAS.
- Z. A. ALOthman, Materials, 2012, 5, 2874–2902 CrossRef CAS.
- P. J. Pomonis and E. T. Tsaousi, Langmuir, 2009, 25, 9986–9994 CrossRef CAS.
- A. Takahashi, T. Shirai, Y. Hayashi and M. Fuji, Solid State Ionics, 2013, 241, 53–61 CrossRef.
- T. Wan, H. Xu, Y. Yuan and W. He, J. Wuhan Univ. Technol., Mater. Sci. Ed., 2007, 22, 466–469 CrossRef CAS.
- H. Tokuda, K. Hayamizu, K. Ishii, M. A. B. H. Susan and M. Watanabe, J. Phys. Chem., 2006, 110, 2833–2839 CrossRef CAS.
- S. V. Dzyuba and R. A. Bartsch, Chem. Commun., 2002, 3, 161–166 CAS.
- L. M. Ramenskaya, E. P. Grishina and N. O. Kudryakova, Russ. J. Phys. Chem., 2018, 92, 24–28 CrossRef CAS.
- A. Ahmed, Y. Chaker, E. H. Belarbi, O. Abbas, J.-N. Chotard, H. B. Abassi, A. N. V. Nhien, M. S. E. Hadri and S. Bresson, J. Mol. Struct., 2018, 1173, 653–664 CrossRef CAS.
| This journal is © The Royal Society of Chemistry 2020 |