
 Open Access Article
 This Open Access Article is licensed under a Creative Commons Attribution-Non Commercial 3.0 Unported Licence
Analysis of sequence-defined oligomers through Advanced Polymer Chromatography™ – mass spectrometry hyphenation†
Marie-Theres Berga,
Chiel Mertensb,
Filip Du Prez b,
Thomas D. Kühnea,
Artjom Herberga and
Dirk Kuckling*a
b,
Thomas D. Kühnea,
Artjom Herberga and
Dirk Kuckling*a
aPaderborn University, Faculty of Science, Department of Chemistry, Warburger Straße 100, 33098 Paderborn, NRW, Germany. E-mail: dirk.kuckling@uni-paderborn.de
bGhent University, Centre of Macromolecular Research (CMaC), Polymer Chemistry Research Group, Department of Organic and Macromolecular Chemistry, Krijgslaan 281, S4bis, B-9000 Ghent, Belgium
First published on 23rd September 2020
Abstract
In recent years, sequence-defined oligomers have attracted increasing interest in the polymer community and the number of new applications such as macromolecular data storage and encryption is increasing. However, techniques allowing sequence differentiation are still lacking. In this study, the focus is put towards a new strategy allowing structural distinction between sequence-defined oligomers with identical molecular weight and composition, but bearing different sequences. This technique relies on the hyphenation of size exclusion chromatography and mass spectrometry, coupled with ion mobility separation. This approach allows for a quick and easy separation and identification of oligomers with different length and/or sequence.
Introduction
During the last decade, the synthesis of sequence-defined oligomers has become a rapidly expanding research area in polymer chemistry.1–3 The desire to synthesize macromolecules with defined chain length, monomer order and topology is motivated by the unique structure–property relationships of biopolymers.4,5 For example, peptides are able to perform very diverse and complex biological functions such as molecular recognition or catalysis. Although recent advances at the interface between organic and polymer chemistry offer synthetic routes towards non-natural sequence-defined macromolecules with very diverse backbone compositions, these structures do not yet reach the same potential as natural counterparts.5One of the most widespread strategies for the synthesis of sequence-defined oligomers involves the iterative coupling of different building blocks.2,3 These reactions can be performed in solution, however, a solid-support, where the chain is assembled on a crosslinked polymeric resin, is often used. This strategy not only limits the work-up to a simple wash- and filtration-step, but it also enables automation by making use of a liquid handling robot.3,6 Moreover, at the end of this step-by-step approach, the product can be isolated from the resin by means of a cleavable bond. For biological and bioinspired macromolecules (semi)automated procedures are already well established. They can be used to synthesize, for example, oligonucleotides7 and oligopept(o)ides8,9 with defined monomer sequences. As a result of efficient so-called submonomer strategies, the automatization could be further improved for oligopeptoids to work without protecting groups, as first reported by Zuckermann et al. in 1992.9,10 Other sequence-defined oligomers can also be synthesized without the use of protecting groups nowadays by making use of highly efficient and orthogonal reactions.2,6,11
Recently thiolactone chemistry was utilised to synthesize multi-functional sequence-defined oligomers in a robust and versatile two-step approach.12,13 A thiolactone is a cyclic thioester that functions as a latent thiol, which can be released by aminolysis. In this approach, an immobilised thiolactone was first selectively ring-opened with the amine moiety of ethanolamine. In this way, a thiol is released in situ, which can then react with an acrylate present in the same reaction mixture. Different side chain functionalities could be introduced by making use of the vast library of acrylic compounds. During the second step, a thiolactone group is reintroduced by reaction of the residual alcohol with α-isocyanato-γ-thiolactone.13
The thiolactone protocol was successfully automated and was used to synthesise the oligomers used in this work.13 Such a control over the sequences of polymers also grants increased control over the macromolecular properties at various scales.14 At the nanolevel, sequence-defined macromolecules allow interesting approaches to the design of materials with advanced properties compared to the block copolymers used so far.15 For example, the control over sequences enables fine-tuning of material degradation properties, which could be of great importance for biomedical applications such as sustained drug delivery or tissue engineering.16
In another context, sequence-defined macromolecules offer promising approaches to data storage through the use of monomer units as bits.17 For example, with two comonomers defined as 0 and 1, binary information can be written.18 Depending on the type of polymer backbone, the size of individual monomeric units varies between 2 to 10 Å, which result in higher information density compared to conventional storage media used today.14 Nevertheless, it is not necessary to store the information in binary form. By extending the ‘monomer alphabet’, larger storage densities are achievable.19 In order to use sequence-defined macromolecules for such advanced applications, suitable characterization methods are mandatory. Standard analytical methods for homopolymers and simple copolymers are often not sufficient for the differentiation of sequence-defined microstructures. Diblock copolymers are usually analysed by a combination of size exclusion chromatography (SEC) and nuclear magnetic resonance spectroscopy (NMR), which is not qualified for more complex sequences. The most applied method nowadays to read sequences of non-natural oligomers is tandem-mass spectrometry (MS/MS), in which macromolecules are purposefully fragmented by collision-induced dissociation (CID). The monomer sequence can be read out afterwards due to the mass difference between the fragments. Hence, MS/MS has been established as a practical method to decode a broad range of polymers.20 Unfortunately, this kind of experiment requires a high degree of understanding of the sample and time to evaluate the complex fragmentation patterns.
IMS-MS has already been proven to be a powerful tool to analyse, separate and identify protein structures, carbohydrate isomers and structural isomers as well as conformers of different polymers.21 This method allows the separation of analytes according to their charge states, molecular masses and rotational-average collision cross section (CCS).22 Lutz et al. recently used this technique to decrypt information encoded in polyoligo(alkoxyamine phosphodiester)s with the same masses, but different architectures. To read out the information, the oligomers were fragmented, and the fragments were analysed by IMS-MS. The information of the drift time measurements provided the rules for the decryption.23
Hence, in the current approach, oligomer identification was performed by the hyphenation of a rapid size exclusion chromatography system and mass spectrometry, coupled with ion mobility separation (IMS). This allowed a quick and easy separation and identification of oligomers up to structural isomers (i.e., oligomers with the same composition but different monomer sequence). The used SEC system is the Advanced Polymer Chromatography™ (APC) of Waters. The APC allows a pre-separation of oligomer mixtures according to their hydrodynamic volume in an adjustable mass range. Depending on the choice of columns different mass ranges are separated during the measurement. Through the combination of mass (m/z) and size (drift time) separation, the differentiation of architecturally diverse isomers is possible. The hyphenation of all three systems could enable a separation and characterization of a complex mixture of oligomers with different degree of polymerization, composition and sequences, as illustrated in Scheme 1.
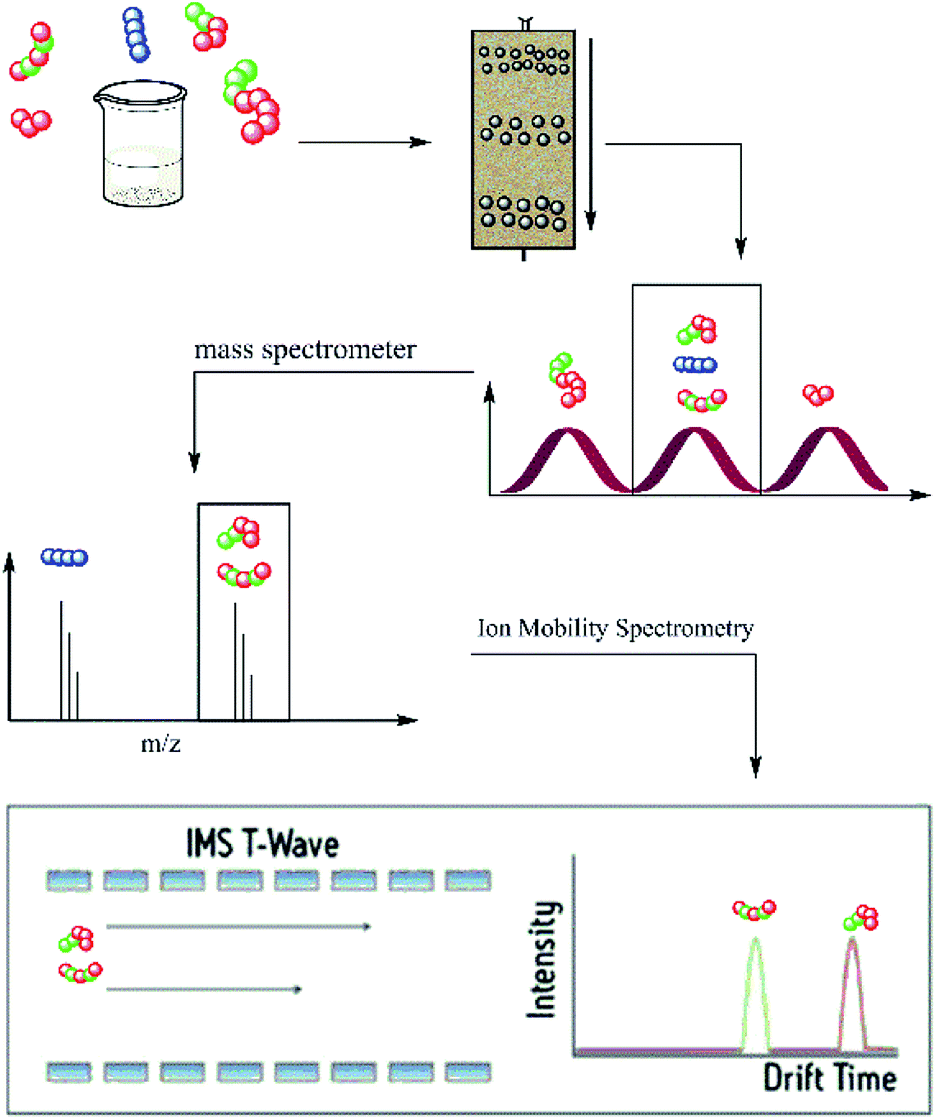 | ||
| Scheme 1 Scheme of oligomer separation in APC-MS-IMS measurements. | ||
More recent developments in the SEC area resulted in the methods of ultra high performance liquid chromatography (UHPLC). Separations were done with the aid of high-strength chromatography media and a higher pore volume. The column packings have particle sizes below 3 μm and allow measurements at very high pressures.24 One of the commercially available UHPLC systems is the Waters APC system specially adapted for polymer separation. APC is a powerful instrument that enables separation of macromolecules in size exclusion mode with much shorter measurement time than regular SEC systems. The column material is resistant to high back pressures and allows a change of solvent without a loss of performance.25 Within the APC, the sample mixture was separated according to the hydrodynamic volume of the components, followed by a mass-to-charge ratio separation in the MS. At this point, an identification of the composition and chain length of the oligomers in the mixture was possible. Nevertheless, with these two methods a differentiation between different monomer sequences remained impossible. Therefore, the additional ion mobility separation was used. Assuming that the differences in monomer sequence result in conformational changes of the oligomers, the consequence would be a difference in CCS, which can be detected in the IMS experiment.
In the current work, the APC-IMS-MS system is mainly tested for the analysis of two sequence-defined hexamers composed of two different monomers additionally a tetramer and an octamer where analysed. These hexamers have the same composition but differ in the order of the monomers. While one of the analytes exhibited a block-wise sequence, the other one had an alternating monomer sequence (Fig. 1a and b).
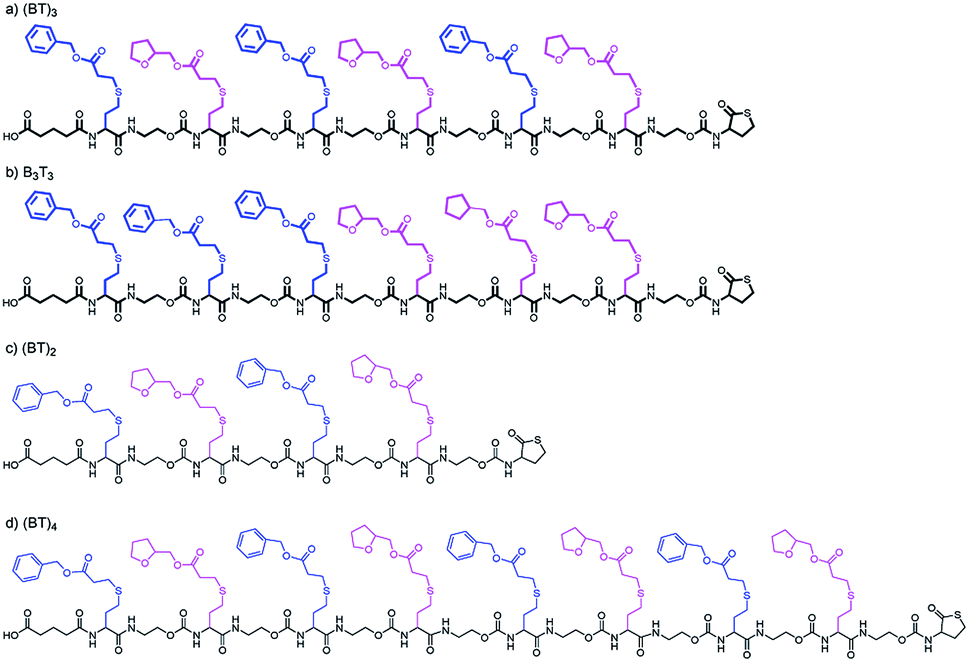 | ||
| Fig. 1 Structures of the two hexamers with benzyl (B) and tetrahydrofurfuryl (T) side chains in alternating (BT)3 (a) and block-wise B3T3 (b) order, the tetramer (BT)2 (c) and the octamer (BT)4 (d) both with alternating order. | ||
Experimental
Tetrahydrofuran was purchased from VWR in HPLC quality, acetonitrile was purchased from Carl Roth with LC-MS grade (99.95%).The oligomers were synthesised according to a previously reported protecting group-free two step iterative protocol.13
The size exclusion experiments were performed with the Waters Advanced Polymer Chromatography™ (APC) system equipped with a refractive index (RI) detector and two Acquity APC XT 45 Å column (7.5 cm and 15 cm long).
The mass spectrometric experiments were performed with a Waters SYNAPT™ G2 mass spectrometer with an electrospray ionisation (ESI) source. This instrument contains a travelling wave-IMS cell, which is used for the IMS investigations.
For the SEC experiments and the hyphenated ones the samples were dissolved with a concentration of 2 mg mL−1 in tetrahydrofuran/acetonitrile (v/v 7/3) with an addition of 10 mg L−1 of sodium iodide. Column oven and RI detector of the APC were operated at a temperature of 30 °C. The flow rate at the APC was set to 0.7 mL min−1 and in the hyphenated measurements later divided with a split ration of 1/10.5 (ESI-source/RI-detector). Therefore, the systems were hyphenated by a T-type splitter and a PEEK-SIL capillary with an inner diameter of 50 μm and a length of 50 cm.
Stand-alone measurements of ESI-IMS-MS took place with a further diluted sample (900/50/50, solvent/sample solution/salt-solution). Lithium iodide, sodium iodide, potassium iodide and caesium iodide were each dissolved with a concentration of 2 mg mL−1 in the solvent mixture. The solution was infused with a syringe pump and a PEEK-SIL capillary by-passing the infusion system of the SYNAPT™. The flow rate was set to 20 μL min−1. The ESI source was operated in positive ion mode.
The analytes were ionized with a capillary voltage of 2.0 kV, a sampling cone voltage of 80 V and an extraction cone voltage of 0.5 V. All IMS measurements were performed with a wave height of 40 V and with varying wave velocities. The calibration of the IMS system was performed with a polyalanine in a solution of acetonitrile and water with acetic acid (v/v/v 49.5/49.5/1) and a concentration of 2 mg mL−1. The calibration was performed with a wave velocity of 500 m s−1.
Theoretical calculations were performed by dynamical simulated annealing followed by geometry optimization performed with cp2k based on density functional theory26 and calculations of theoretical CCS values with mobcal.27 The calculations were performed using a periodic supercell with a cell size of 150 Å. Annealing was started at a temperature of 1500 K and cooled down to about 700 K in about 1![[thin space (1/6-em)]](https://www.rsc.org/images/entities/char_2009.gif) 000000 steps, which corresponds to 500 ps. This is followed by a second geometry optimization. The resulting atoms coordinates were used to perform the calculations with mobcal.
000000 steps, which corresponds to 500 ps. This is followed by a second geometry optimization. The resulting atoms coordinates were used to perform the calculations with mobcal.
Results and discussion
APC separation
As the first separation method of the oligomer mixtures, SEC was selected. The high-pressure tolerance of the ultra-performance liquid chromatography columns enables short measurement times of 4 minutes in single APC measurements and 6 minutes in hyphenated measurements.Fig. 2 shows the elution profiles of two different sample mixtures. The mixture of the two hexamers (red line in Fig. 2) showed one monomodal peak. From the elution profile only, it was impossible to determine the number of analytes in this mixture, nor to identify them. The second mixture (black line in Fig. 2) was composed of three oligomers with different chain length. All of them were synthesized using the same monomer units as displayed in Fig. 1. The chain length differed from four to eight monomer units per chain, while all of them showed an alternating order of monomers. The mixture was prepared with the same mass concentration of all components. While the peaks cannot be baseline separated, the measurement clearly shows all three components of the mixture. The current column combination has a plate number of 11500 under the current conditions. With an adjustment of the flow rate, higher plate numbers could be achieved with the cost of longer measurement times (Fig. S1 and S2†). This experiment demonstrated the ability of APC to separate the oligomers with different chain lengths, however mixtures of oligomers with the same size cannot be resolved with this technique.
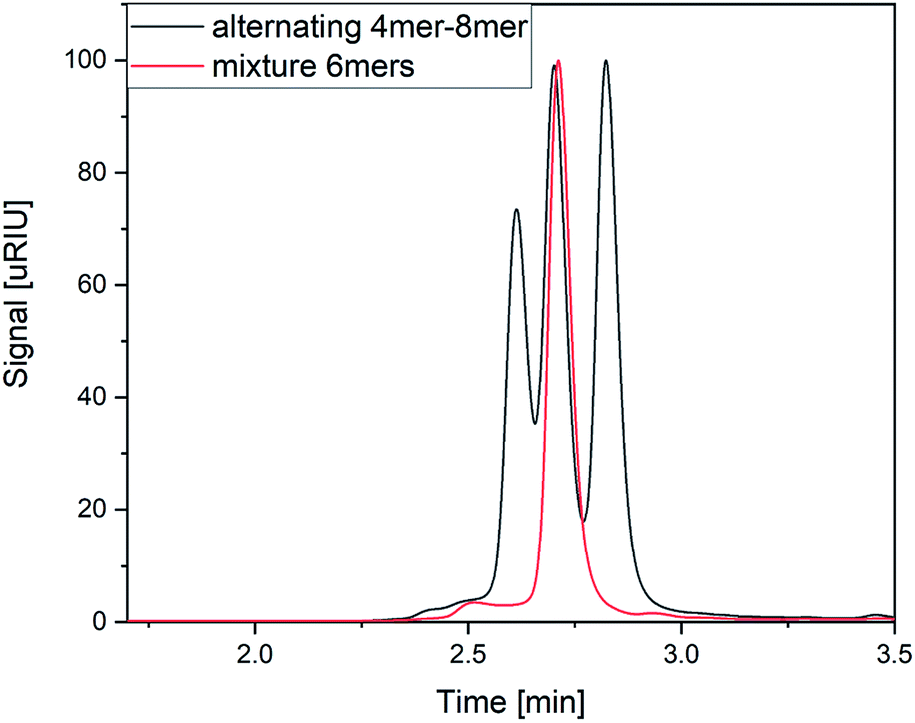 | ||
| Fig. 2 APC elution profiles of two sample mixtures all containing oligomers with benzyl and tetrahydrofurfuryl side chains. Mixture of the two hexamers ((BT)3 and B3T3; red line) and a mixture composing a tetramer, a hexamer and an octamer with an alternating sequence ((BT)2, (BT)3 and (BT)4; black line). | ||
Theoretical calculations
In order to prove whether the two different hexamers were accessible to size separation by their CCS, their structures were computed under certain conditions (see Experimental section). Both hexamers were investigated by theoretical calculations. Therefore, their structures were optimized using simulated annealing and geometry optimization. Calculations were performed with four different adducts, as well as two different charge states. After the optimization steps, the resulting collision cross section was calculated. Respective values are summarized in Fig. 3.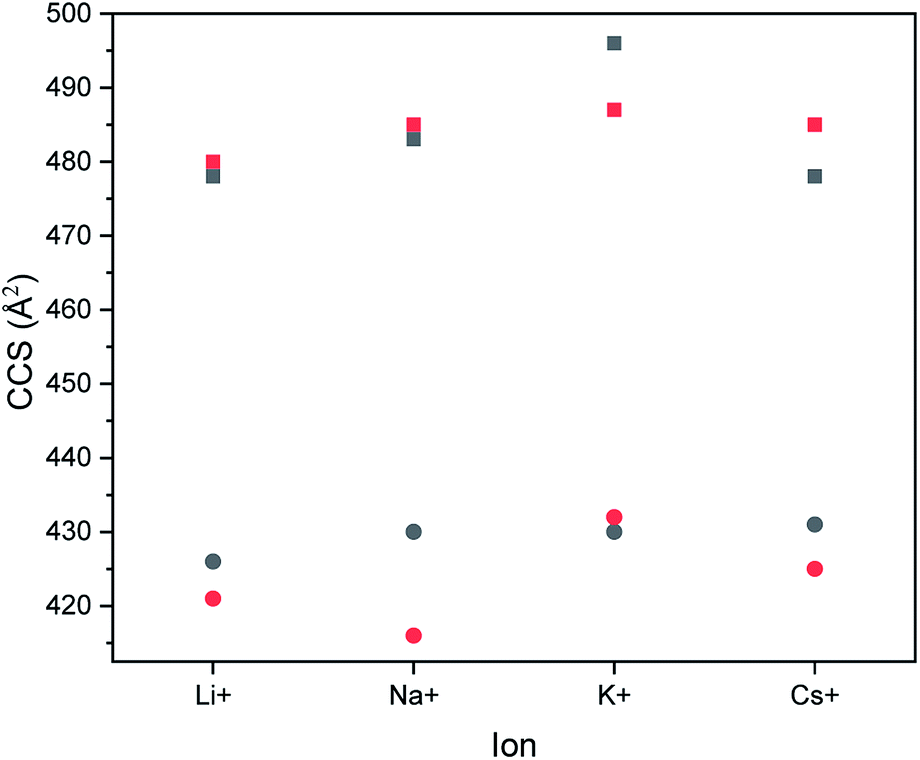 | ||
| Fig. 3 Calculated CCS of the hexamers with different adducts. Singly charged states (black symbols) and doubly charged states (red symbols) are shown for the B3T3 structures (squares) and (BT)3 structures (dots). | ||
All calculations showed that the difference in CCS between the two structural isomers stayed nearly the same with changing size of adducts. Also, the charge state seems to have only a small influence on the cross section of the structures. While the block-wise oligomer increased slightly in size with increasing charge state, the size of the alternating oligomer decreased. This indicates that it is advisable to use the doubly charged states to identify the isomers in the experiments as would be expected for polymer from literature.28 The double charged sodium adducts showed the highest difference in CCS values, but a difference of more than 50 Å was observed for all ionization agents. Therefore, this difference is negligible and changing the ionization agents seems to be irrelevant.
It is observed that in every case the block-wise structure resulted in bigger cross sections in the charged states, which might be a result of the differences in the polarity of the two side chains moieties (Fig. 3). The calculations indicate that the adduct ions were located around the more polar tetrahydrofurfuryl group, which could also explain the increase in size, with increasing charge state for the block-wise structure charge repulsion within the oligomer. An example of this is visible in the structures in Fig. 4. The absolute values of the drift times, as well as all optimized structures are shown in the ESI.†
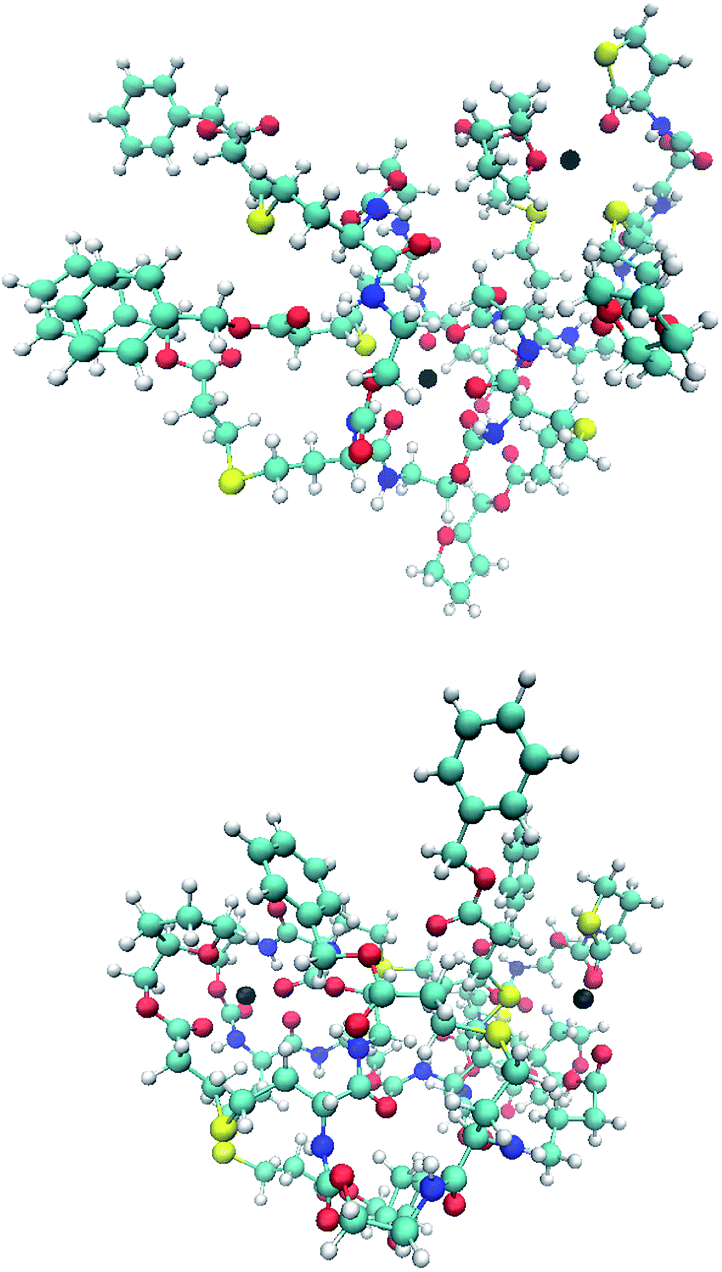 | ||
| Fig. 4 Optimized structures of the doubly charged isomers B3T3 (upper) and (BT)3 (lower) with the sodium ions indicated as a black ball. | ||
MS experiments
Stimulated by the encouraging results from the theoretical calculations, different approaches were tested to find the optimal conditions for the identification of the two structural isomers in the IMS experiments. Similar to the theoretical calculations, different ionization agents were tested. In addition, the settings of the electric field were varied within the ion mobility device, to maximize the difference in the drift times between both isomers.In this work the wave velocity was varied between 300 m s−1 and 1500 m s−1, while the wave height stayed at 40 V. In accordance to the principle of traveling wave ion mobility separation,29 an increasing wave velocity should lead to an increase of the absolute drift time. As a result, the difference in drift time is increased and a better separation of two species would be expected, which is emphasized by eqn (1) and (2).
 | (1) |
 | (2) |
Further evaluations refer to the doubly charged species since the intensity of the singly charged ions in the spectra was too low. All measurements were repeated three times. The difference between both drift times was larger than the error of the measurements in all cases. In general, it was observed that the differences in drift time of the two isomers increased with increasing wave velocity, until a plateau was reached. At higher velocities, the difference decreased again. This was visible for all used adducts. The sodium and potassium adducts had the smallest deviations for all tested wave velocities, while for all adducts all deviations were smaller than the achieved drift time differences (Fig. 5).
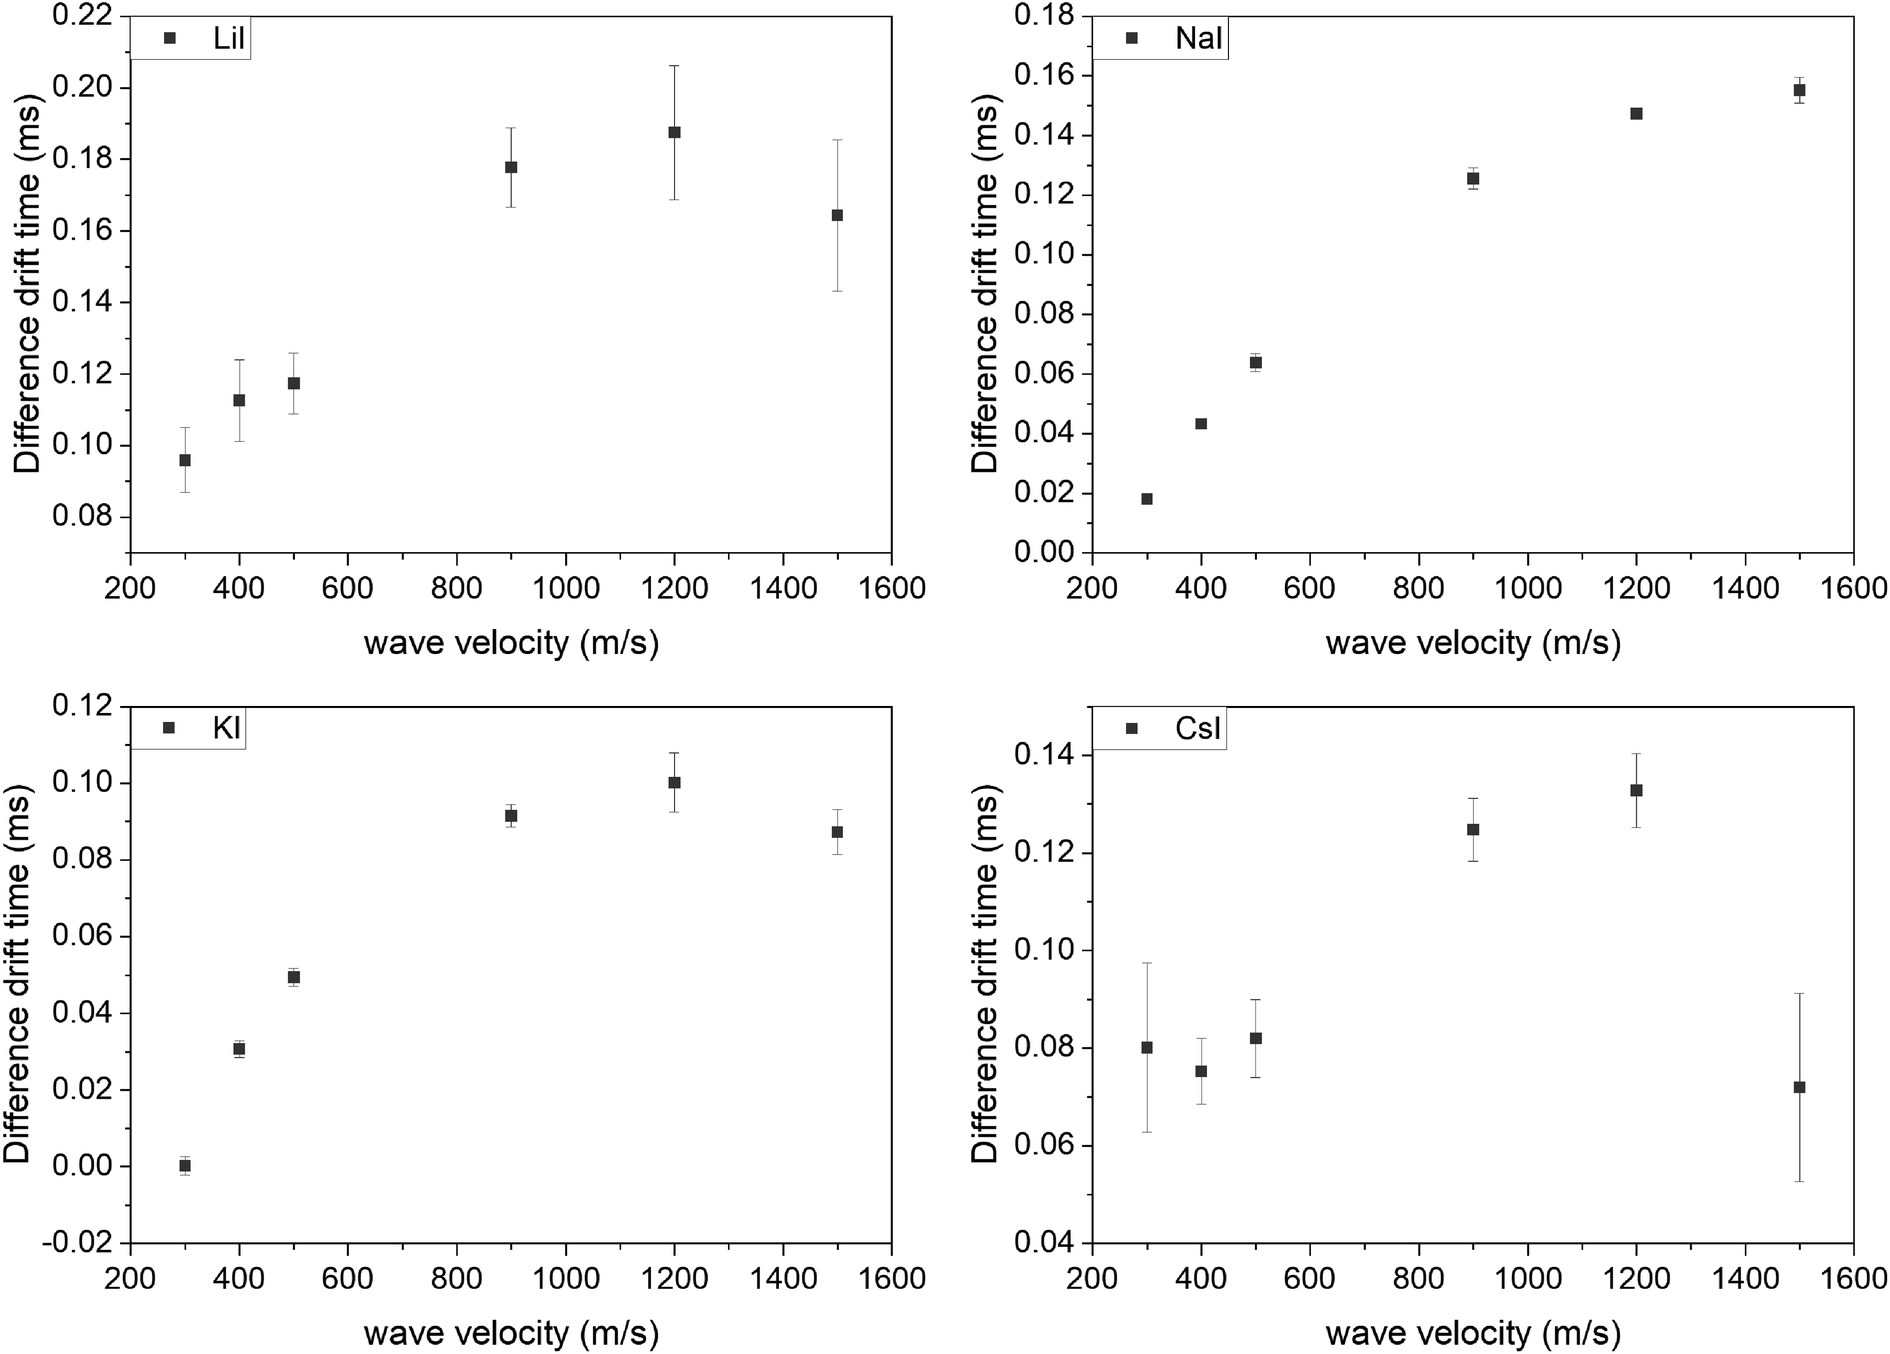 | ||
| Fig. 5 Difference in drift time of the hexamers (B3T3 and (BT)3) with different wave velocities and ionization adducts. | ||
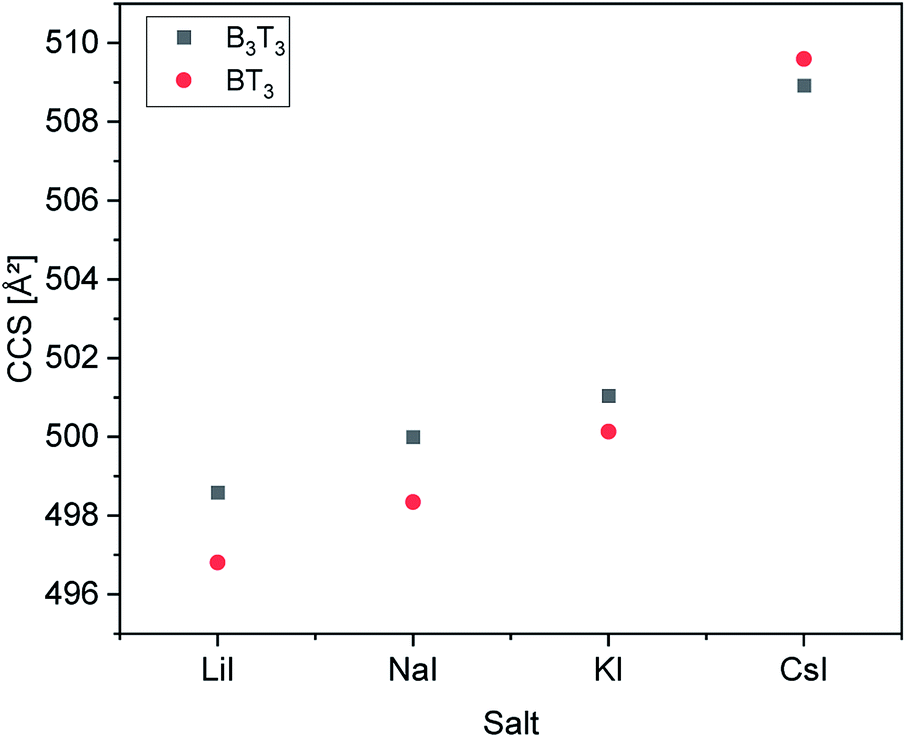
With the use of a calibration function the CCS values were calculated for every adduct system (Fig. 6). The calibration was done with doubly charged polyalanine under the same conditions as the oligomer measurements. It can be observed that the difference between the CCS values decreased with an increasing size of ionization agent. The use of caesium iodide even inverted the size relation between both samples.
 | ||
| Fig. 6 Resulting CCS calculated for different ionization adducts at a wave velocity of 500 m s−1. | ||
An increase of the CCS with increasing size of the added salt can be explained by the charge repulsion of the ions within the chain, resulting in a less compact structure. The differences in the CCS of the IMS measurements vary varies between 0.7 to 1.8 Å2. This is significantly smaller than the values obtained from the theoretical calculations (Fig. 3).
The calculated structures cannot accurately represent the real structures, since the calculations took place with certain assumptions. The final temperature of the simulated annealing was set to 350 K, which should match the temperature within the IMS chamber. Nevertheless, each molecule was optimized without considering interactions between multiple molecules. Furthermore, it is possible that the choice of solvent within the ionization process influences the resulting shape of the structure. This was already proved for peptides.30
Hyphenation
In the final experiment, the APC was hyphenated to the MS instrument to demonstrate the feasibility of this method. Fig. 7 shows the retention time in the SEC experiment and the drift time distributions of both isomers. The retention time distributions of both hexamers each showed a monomodal peak with quite similar retention times and peak width. The elugram is very well correlated to the first measurements of the mixture of both hexamers in the single APC measurement (Fig. 7A). The total ion current (TIC) of the samples showed differences between both isomers. Similar to the RI signal the peak maximum of both isomers is slightly different and the block isomer shows a more pronounced shoulder. The mixture of both isomers shows a TIC very similar to the measurement of the block isomer (Fig. 7B).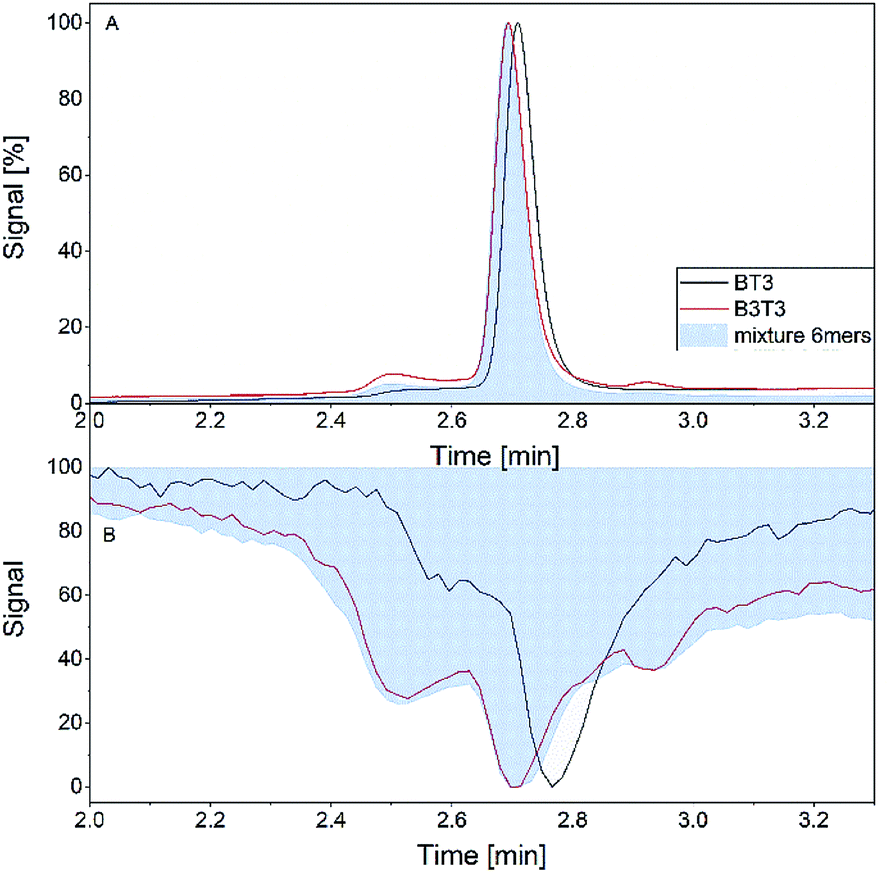 | ||
| Fig. 7 Retention time of RI detector (A) and total ion current (B) of the individual hexamers (B3T3 and (BT)3) and their mixture within the hyphenated measurement. | ||
The drift time distributions showed a similar difference as the stand-alone measurements. The exact values of the drift times differed between the stand-alone measurements and the hyphenated system in a range of 0.2 ms (Fig. 8).
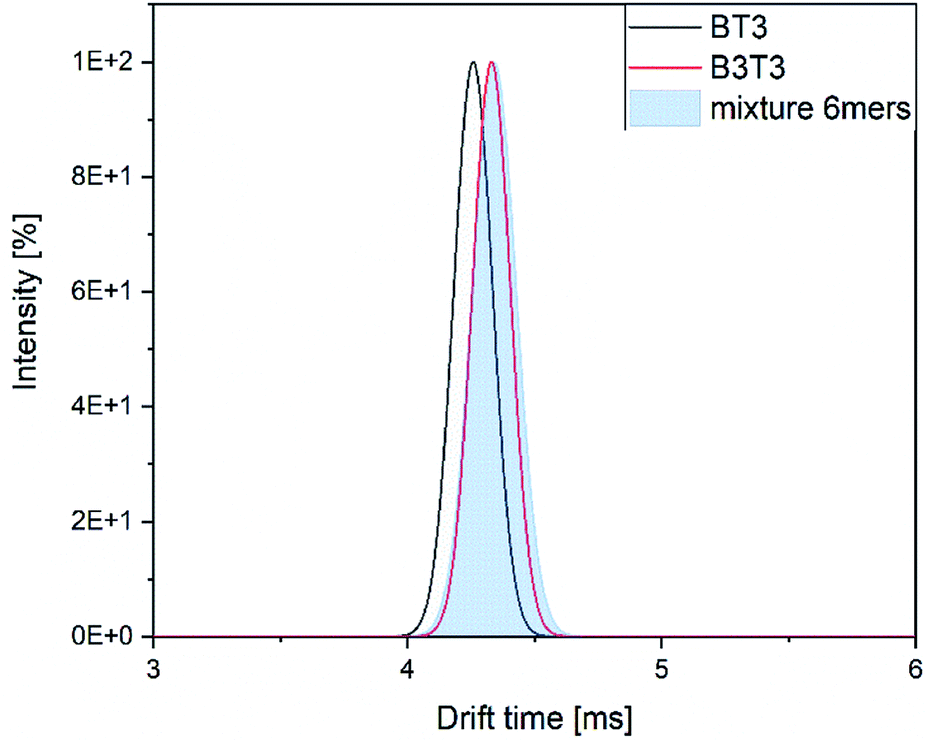 | ||
| Fig. 8 Drift time distribution of the two isomers and their mixture within the hyphenated measurement. | ||
The difference between both of the isomers can be seen, but the mixture of them show again a great similarity to the block isomer. We assume this might be a result of selective ionization of the block isomer within the mixture. To confirm this assumption further investigations are needed.
Additionally, the mixture of the alternating oligomers with three different chain length is measured using the hyphenated system. The RI signal showed again clear signals for all three compounds, which is also observed within the TIC (Fig. 9A and B).
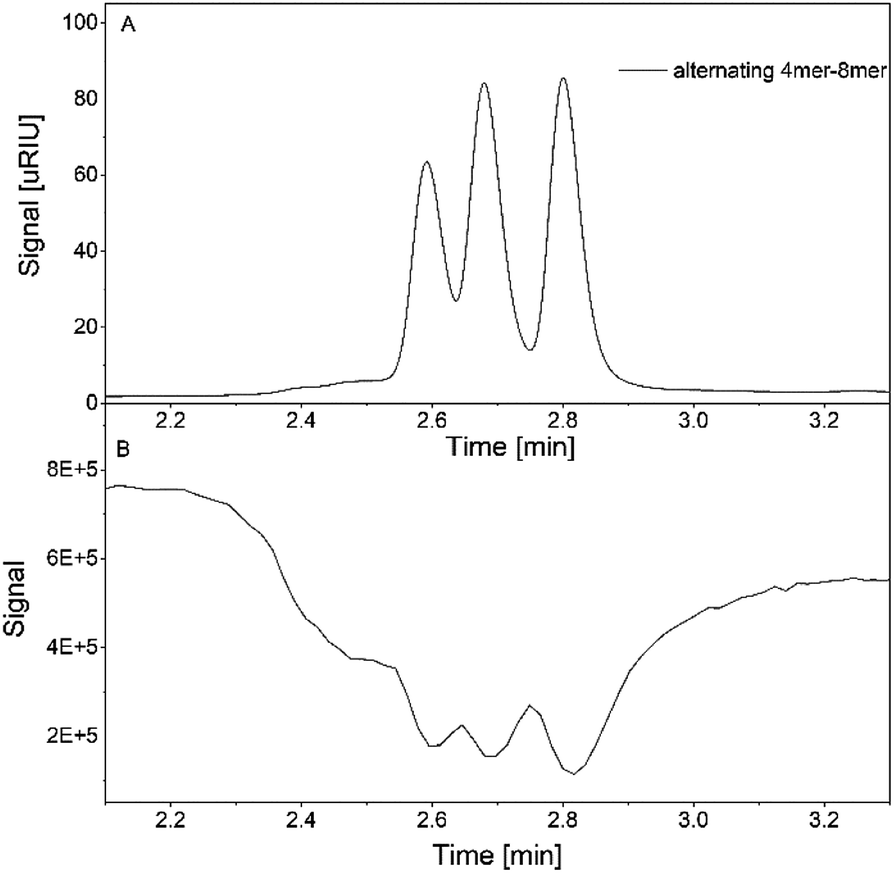 | ||
| Fig. 9 Retention time of RI detector (A) and total ion current (B) of the mixture of alternating oligomers with 4, 6 and 8 monomer units ((BT)2, (BT)3 and (BT)4). | ||
The drift time of all components differ greatly and can be used to identify the isomers in combination with their detected mass (Fig. 10).
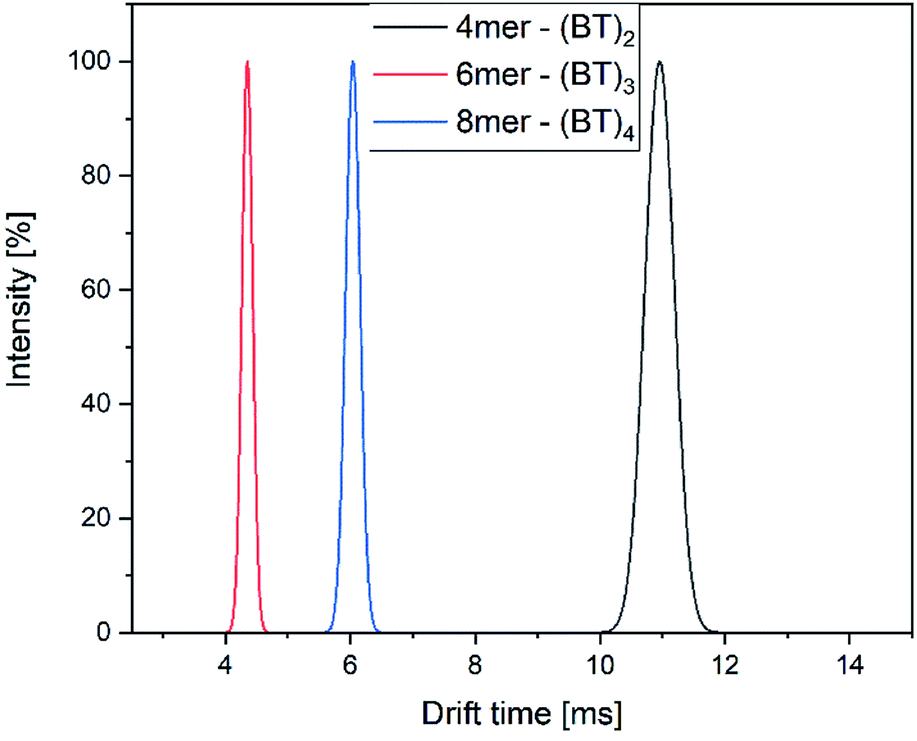 | ||
| Fig. 10 Drift time distribution of the components of the mixture of alternating oligomers with 4, 6 and 8 monomer units. | ||
Conclusion
The hyphenation of the Advanced Polymer Chromatography™ and mass spectrometer equipped with ion mobility device provides an easy and fast method to separate oligomers with the same exact mass, but a different sequence and allow to identify them without the need for MS/MS experiments. Therefore, a library of the drift times or CCS of the examined oligomers will be required.The differences in drift times of both structural isomers varied between 0.02 ms and 0.19 ms with the separation range of 20 ms of the IMS tube. We could show that for our approach the measurement error is significant smaller than the drift time differences of the isomers, therefore it allows us to differentiate between different sequences. When the two structural isomers were combined in a single mixture the difference in drift time was not sufficient to differ between them. Nevertheless, an increase of the difference in drift time would be possible with further improved systems. Longer drift tubes would increase the differences proportional as indicated by eqn (1). Unfortunately, with the current system further improved drift time differences cannot be achieved.
Theoretical calculations confirmed the difference in shape of both isomers in the presence of adduct ions. The significant differences in the calculated and measured CCS values indicate that the results of the calculations can only be used to make qualitative statements about the separability at the moment.
Finally, it could be shown that the drift time difference can be maintained in the hyphenated system. In the future, it will be possible to first separate oligomers with different hydrodynamic volume by APC and secondly identify different isomers by IMS in a single experiment.
Conflicts of interest
There are no conflicts to declare.Acknowledgements
We thank Waters for providing us with the APC system and Eleanor Riches for her help and support regarding problems and her expert knowledge to the Waters systems. We thank Vanessa Latzke for the first computational calculations of the hexamers. FDP thanks support from the FWO under EOS-project 30650939.References
- (a) J.-F. Lutz, Sequence-Controlled Polymers, Wiley-VCH Verlag GmbH & Co. KGaA, Weinheim, Germany, 2018 Search PubMed; (b) N. Badi and J.-F. Lutz, Chem. Soc. Rev., 2009, 38, 3383–3390 RSC; (c) J. de Neve, J. J. Haven, L. Maes and T. Junkers, Polymer Chemistry, 2018, 9, 4692–4705 RSC.
- S. Martens, J. O. Holloway and F. E. Du Prez, Macromol. Rapid Commun., 2017, 38, 1700469 CrossRef.
- S. C. Solleder, R. V. Schneider, K. S. Wetzel, A. C. Boukis and M. A. R. Meier, Macromol. Rapid Commun., 2017, 38, 1600711 CrossRef.
- M. A. R. Meier and C. Barner-Kowollik, Adv. Mater., 2019, 31, 1806027 CrossRef.
- J.-F. Lutz, M. Ouchi, D. R. Liu and M. Sawamoto, Science, 2013, 341, 1238149 CrossRef.
- J. O. Holloway, K. S. Wetzel, S. Martens, F. E. Du Prez and M. A. R. Meier, Polymer Chemistry, 2019, 10, 3859–3867 RSC.
- V. T. Ravikumar, T. K. Wyrzykiewicz and D. L. Cole, Tetrahedron, 1994, 50, 9255–9266 CrossRef CAS.
- R. B. Merrifield, J. Am. Chem. Soc., 1963, 85, 2149–2154 CrossRef CAS.
- A. S. Knight, E. Y. Zhou, M. B. Francis and R. N. Zuckermann, Adv. Mater., 2015, 27, 5665–5691 CrossRef CAS.
- R. N. Zuckermann, J. M. Kerr, S. B. H. Kent and W. H. Moos, J. Am. Chem. Soc., 1992, 114, 10646–10647 CrossRef CAS.
- (a) J. C. Barnes, D. J. C. Ehrlich, A. X. Gao, F. A. Leibfarth, Y. Jiang, E. Zhou, T. F. Jamison and J. A. Johnson, Nat. Chem., 2015, 7, 810–815 CrossRef CAS; (b) W. Konrad, C. Fengler, S. Putwa and C. Barner-Kowollik, Angew. Chem., Int. Ed., 2019, 58, 7133–7137 CrossRef CAS; (c) M. Porel and C. A. Alabi, J. Am. Chem. Soc., 2014, 136, 13162–13165 CrossRef CAS; (d) S. C. Solleder and M. A. R. Meier, Angew. Chem., Int. Ed., 2014, 53, 711–714 CrossRef CAS.
- (a) P. Espeel, L. L. G. Carrette, K. Bury, S. Capenberghs, J. C. Martins, F. E. Du Prez and A. Madder, Angew. Chem., Int. Ed., 2013, 52, 13261–13264 CrossRef CAS; (b) P. Espeel and F. E. Du Prez, Eur. Polym. J., 2015, 62, 247–272 CrossRef CAS; (c) J. O. Holloway, C. Mertens, F. E. Du Prez and N. Badi, Macromol. Rapid Commun., 2019, 40, e1800685 CrossRef; (d) J. O. Holloway, S. Aksakal, F. E. Du Prez and C. R. Becer, Macromol. Rapid Commun., 2017, 38, 1700500 CrossRef.
- S. Martens, J. van den Begin, A. Madder, F. E. Du Prez and P. Espeel, J. Am. Chem. Soc., 2016, 138, 14182–14185 CrossRef CAS.
- J.-F. Lutz, Macromol. Rapid Commun., 2017, 38, 1700582 CrossRef.
- (a) F. S. Bates, Science, 1991, 251, 898–905 CrossRef CAS; (b) Z. Li, E. Kesselman, Y. Talmon, M. A. Hillmyer and T. P. Lodge, Science, 2004, 306, 98–101 CrossRef CAS; (c) H. Qiu, Z. M. Hudson, M. A. Winnik and I. Manners, Science, 2015, 347, 1329–1332 CrossRef CAS.
- M. A. Washington, D. J. Swiner, K. R. Bell, M. V. Fedorchak, S. R. Little and T. Y. Meyer, Biomaterials, 2017, 117, 66–76 CrossRef CAS.
- J. Steinkoenig, R. Aksakal and F. Du Prez, Eur. Polym. J., 2019, 120, 109260 CrossRef CAS.
- (a) J.-F. Lutz, Macromolecules, 2015, 48, 4759–4767 CrossRef CAS; (b) H. Colquhoun and J.-F. Lutz, Nat. Chem., 2014, 6, 455–456 CrossRef CAS.
- (a) S. Martens, A. Landuyt, P. Espeel, B. Devreese, P. Dawyndt and F. Du Prez, Nat. Commun., 2018, 9, 4451 CrossRef; (b) A. C. Boukis and M. A. R. Meier, Eur. Polym. J., 2018, 104, 32–38 CrossRef CAS.
- (a) U. S. Gunay, B. E. Petit, D. Karamessini, A. Al Ouahabi, J.-A. Amalian, C. Chendo, M. Bouquey, D. Gigmes, L. Charles and J.-F. Lutz, Chem, 2016, 1, 114–126 CrossRef CAS; (b) L. Charles, C. Laure, J.-F. Lutz and R. K. Roy, Rapid Commun. Mass Spectrom., 2016, 30, 22–28 CrossRef CAS; (c) L. Charles, C. Laure, J.-F. Lutz and R. K. Roy, Macromolecules, 2015, 48, 4319–4328 CrossRef CAS; (d) J.-A. Amalian, T. T. Trinh, J.-F. Lutz and L. Charles, Anal. Chem., 2016, 88, 3715–3722 CrossRef CAS.
- (a) J. N. Hoskins, S. Trimpin and S. M. Grayson, Macromolecules, 2011, 44, 6915–6918 CrossRef CAS; (b) J. Hofmann, H. S. Hahm, P. H. Seeberger and K. Pagel, Nature, 2015, 526, 241–244 CrossRef CAS; (c) C. Bleiholder, N. F. Dupuis, T. Wyttenbach and M. T. Bowers, Nat. Chem., 2011, 3, 172–177 CrossRef CAS; (d) M. D. Plasencia, D. Isailovic, S. I. Merenbloom, Y. Mechref, M. V. Novotny and D. E. Clemmer, J. Am. Soc. Mass Spectrom., 2008, 19, 1706–1715 CrossRef CAS; (e) M. Zhu, B. Bendiak, B. Clowers and H. H. Hill, Anal. Bioanal. Chem., 2009, 394, 1853–1867 CrossRef CAS; (f) J. P. Williams, M. Grabenauer, R. J. Holland, C. J. Carpenter, M. R. Wormald, K. Giles, D. J. Harvey, R. H. Bateman, J. H. Scrivens and M. T. Bowers, Int. J. Mass Spectrom., 2010, 298, 119–127 CrossRef CAS; (g) N. E. Alexander, J. P. Swanson, A. Joy and C. Wesdemiotis, Int. J. Mass Spectrom., 2018, 429, 151–157 CrossRef CAS; (h) M. Atakay, F. Aksakal, U. Bozkaya, B. Salih and C. Wesdemiotis, J. Am. Soc. Mass Spectrom., 2020, 31, 441–449 CrossRef CAS; (i) Q. Duez, H. Metwally, S. Hoyas, V. Lemaur, J. Cornil, J. de Winter, L. Konermann and P. Gerbaux, Phys. Chem. Chem. Phys., 2020, 22, 4193–4204 RSC.
- E. D. Inutan and S. Trimpin, J. Proteome Res., 2010, 9, 6077–6081 CrossRef CAS.
- J.-A. Amalian, G. Cavallo, A. Al Ouahabi, J.-F. Lutz and L. Charles, Anal. Chem., 2019, 91, 7266–7272 CrossRef CAS.
- E. S. P. Bouvier and S. M. Koza, TrAC, Trends Anal. Chem., 2014, 63, 85–94 CrossRef CAS.
- M. Summers, J. Shia and K. J. Fountain, Solvent Flexibility for Size-Based Polymer Analysis Using the Advanced Polymer Chromatography, 2013 Search PubMed.
- T. D. Kühne, M. Krack, F. R. Mohamed and M. Parrinello, Phys. Rev. Lett., 2007, 98, 66401 CrossRef.
- K. Takaya, T. Kaneko, H. Tanuma, T. Nishide, H. Sugiyama, N. Nakano, H. Nagashima and Y. Seto, Int. J. Ion Mobility Spectrom., 2016, 19, 227–232 CrossRef CAS.
- (a) J. R. N. Haler, D. Morsa, P. Lecomte, C. Jérôme, J. Far and E. de Pauw, Methods, 2018, 144, 125–133 CrossRef CAS; (b) D. Morsa, T. Defize, D. Dehareng, C. Jérôme and E. de Pauw, Anal. Chem., 2014, 86, 9693–9700 CrossRef CAS.
- A. A. Shvartsburg and R. D. Smith, Anal. Chem., 2008, 80, 9689–9699 CrossRef CAS.
- T. Wyttenbach and M. T. Bowers, J. Phys. Chem. B, 2011, 115, 12266–12275 CrossRef CAS.
Footnote |
| † Electronic supplementary information (ESI) available. See DOI: 10.1039/d0ra06419j |
| This journal is © The Royal Society of Chemistry 2020 |