 Open Access Article
Engineering of NIR fluorescent PEGylated poly(RGD) proteinoid polymers and nanoparticles for drug delivery applications in chicken embryo and mouse models†
Elad Hadada,
Safra Rudnick-Glicka,
Igor Grinberga,
Ronen Yehudab and
Shlomo Margel *a
*a
aDepartment of Chemistry, Institute of Nanotechnology & Advanced Materials, Bar Ilan University, Ramat-Gan, Israel. E-mail: shlomo.margel@biu.ac.il
bDepartment of Life Science, Bar Ilan University, Ramat-Gan, Israel
First published on 16th September 2020
Abstract
Proteinoids are non-toxic biodegradable polymers based on thermal step-growth polymerization of natural or synthetic amino acids. Hollow proteinoid nanoparticles (NPs) may then be formed via a self-assembly process of the proteinoid polymers in an aqueous solution. In the present article polymers and NPs based on D-arginine, glycine and L-aspartic acid, poly(RDGD), were synthesized for tumor targeting, particularly due to the high affinity of the RGD motif to areas of angiogenesis. Near IR fluorescent P(RDGD) NPs were prepared by encapsulating the fluorescent NIR dye indocyanine green (ICG) within the formed P(RDGD) NPs. Here, we investigate the effect of the covalent conjugation of polyethylene glycol (PEG), with different molecular weights, to the surface of the near IR encapsulated P(RDGD) NPs on the release of the dye to human serum due to bio-degradation of the proteinoid NPs and on the uptake by tumors. This work illustrates that the release of the encapsulated ICG from the non-PEGylated NPs is significantly faster than for that observed for the PEGylated NPs, and that the higher molecular weight is the bound PEG spacer the slower is the dye release profile. In addition, in a chicken embryo model, the non-PEGylated ICG-encapsulated P(RDGD) NPs exhibited a higher uptake in the tumor region in comparison to the PEGylated ICG-encapsulated P(RDGD) NPs. However, in a tumor xenograft mouse model, which enables a prolonged experiment, the importance of the PEG is clearly noticeable, when a high concentration of PEGylated P(RDGD) NPs was accumulated in the area of the tumor compared to the non-PEGylated P(RDGD). Moreover, the length of the PEG chain plays a major role in the ability to target the tumor. Hence, we can conclude that selectivity towards the tumor area of non-PEGylated and the PEGylated ICG-encapsulated P(RDGD) NPs can be utilized for targeting to areas of angiogenesis, such as in the cases of tumors, wounds or cuts, etc.
Introduction
The RGD sequence is a tripeptide composed of three amino acids: arginine (R), glycine (G) and aspartic acid (D). The sequence was initially discovered in 1985 by Pierschbacher and Ruoslahti, to be the active component in fibronectin protein.1 It has been reported that many cancer cells overexpress the αvβ3 integrin. This integrin is also highly up-regulated on the surfaces of growing tumor blood vessels. The RGD peptide has a high affinity to the integrin αvβ3 and is attracted to areas of angiogenesis.2–4 These properties of the RGD motif have led to the development of integrin-targeted nano-drugs for imaging and treatment of tumors. Today, there are two accepted ways for conjugating RGD peptides to nanoparticles (NPs) for targeted drug delivery applications; linear RGD or cyclic RGD peptide.5Amino acids are categorized by L or D configurations which correspond to the ability to rotate polarized light to the left (L) or right (D) directions. It has been reported that the configuration of the amino acids directly influences the RGD peptide activity, which can be reflected in the cell attachment. For example, when the L-aspartic acid is replaced with the D-isomer, the RGD peptide is inactive, however when the L-arginine is replaced by the D-isomer, the binding efficiency increases by a factor of ten.6,7
In this research, proteinoid composed of D-arginine (R), glycine (G), and L-aspartic acid (D) was synthesized, with the intention of randomly achieving the RGD sequence as a part of the proteinoid backbone.
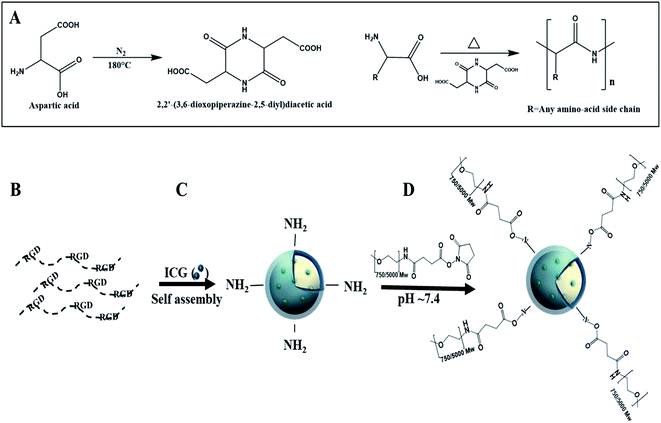
Proteinoids are polymers based on thermal step-growth polymerization which consist of natural or synthetic amino acids. The special procedure was discovered by Fox and Harada.8–14 The formation of proteinoids is carried out in the absence of a catalyst or solvent through heating of certain amino acids in an inert atmosphere.14–16 The suggested explanation for the polymerization process is that aspartic acid serves as a solvent for the other amino acid monomers, as it is condensed through cyclization upon heating into 2,2′-(3,6-dioxopiperazine-2,5-diyl)diacetic acid, which initiates the polymerization with the rest of the present amino acids, and the proteinoid is formed, as shown in Fig. 1A.17
The proteinoids are considered to be non-immunogenic (as illustrated in our previous work by cytokines induction assay), biodegradable, and non-toxic.17,18 Hence, they serve as a delivery carrier in the human body.
Hollow NPs can be produced by a self-assembly process of the proteinoids in an aqueous solution. The self-assembly process of the proteinoid occurs due to the many functional groups, which are part of the random polymer backbone. When proteinoids precipitate to form particles in an aqueous solution, the hydrophobic residues (e.g., phenyl groups) form a hydrophobic core inside the particle, in order to minimize their contact with water. While the carboxylic groups (or ammonium ions when dealing with a lysine-rich proteinoid) will form hydrogen bonds and reside on the particle surface.
We propose a novel RDGD based proteinoid NPs, where there RDGD motif is self-incorporated in the proteinoids' backbone. The superscript letters correspond to the configuration of the arginine and the aspartic acid in all cases. ICG encapsulation towards these NPs act both as a drug carrier (by encapsulation of a desired drug) cell labeling and as a targeting delivery system. This work offers a fast and cheap method for the synthesis of RDGD based proteinoid NPs which can be suitable for biomedical imaging and diagnostics. In order to improve the bio-stability of the ICG encapsulated NPs, the NPs were PEGylated. The self-assembly and formation of the PEGylated ICG-encapsulated P(RDGD) NPs is demonstrated in Fig. 1B–D.
Although resent studies exhibit that PEGylated drugs can cause the formation of antibodies which specifically recognize and bind to polyethylene glycol (PEG),19 PEGylation to NPs still have a major role in drug delivery systems such as: increase in blood circulation,20 evading phagocytosis,21 enhance serum stability22 which is critical for biological application, and prevents leakage of the dyes or drugs.23
Materials and methods
Materials
The following chemicals were purchased from Sigma and used without further purification: D-arginine, glycine, L-aspartic acid, NaCl, Hoechst (bisbenzimide H33342 trihydrochloride) and indocyanine green (ICG). NHS-PEG, Mw 750. NHS-PEG, Mw 5000. HUVEC cells and their EBM-2 medium were purchased from Lonza. PBS and XTT kit were ordered form Biological Industries.Synthesis of the P(RDGD) proteinoids by step-growth polymerization mechanism
In order to determine if the addition of PEG has a role in the stabilization of the P(RDGD) NPs a mixture of 5 g total of amino acids was heated in a three-neck flask by a heating mantle to 180 °C, under nitrogen atmosphere, until all the solid dissolved. The mixture was stirred by a mechanical stirrer at 250 rpm for 20 min, producing a highly viscous yellowish to brownish paste. The paste was allowed to cool to room temperature and harden to a glassy mass was formed. After cooling, the residue was extracted by 30 ml of distilled water, and lyophilized to yield the crude proteinoid.Proteinoid analysis and characterization
The molecular weight and polydispersity index of the P(RDGD) was determined by Gel Permeation Chromatography (GPC) consisting of a Waters Spectra Series P100 isocratic HPLC pump with ERMA ERC-7510 refractive index detector and Rheodyne injection valve (Cotati, CA) with a 20 μl loop (Waters, MA). The sample was dissolved with super-pure HPLC water (Sigma) through linear BioSep SEC-s3000 column (Phenomenex) at a flow rate of 1 ml min−1. The molecular weight of the proteinoids was determined relative to bovine plasma fibrinogen (340 kDa), and human serum albumin (67 kDa), using Clarity chromatography software.The absorption spectra of the proteinoid was obtained by using a Cary 100 UV-Visible (UV-Vis) spectrophotometer (Agilent Technologies Inc.). All of the measurement was performed in water at 25 °C. Excitation and emission spectra were recorded using a Cary Eclipse spectrophotometer (Agilent Technologies Inc.).
Preparation and characterization of hollow, NIR fluorescent proteinoid P(RDGD) nanoparticles
NIR fluorescent P(RDGD) NPs were prepared by a self-assembly process. Briefly, 50 mg of dried proteinoids were added to 5 ml of 10−5 M NaCl aqueous solution. The mixture was then stirred at 250 rpm and heated to 80 °C until the proteinoid dissolved completely. 0.5 mg of ICG (1% relative to the proteinoid weight) was dissolved in 0.1 ml of 10−5 M NaCl aqueous solution. After 30 min of heating, 0.1 ml of the ICG solution was added to the proteinoid mixture. The mixture was then left to cool slowly to room temperature, in order to form the ICG-encapsulated proteinoid NPs.PEGylation of ICG-encapsulated proteinoid NPs
PEGylated ICG-encapsulated P(RDGD) NPs were prepared by coupling free primary amine groups of the P(RDGD) NPs with the NHS-PEG (Mw 750). Briefly, water (100 μl) and PBS buffer (200 μl) were added to 2 ml of ICG-encapsulated P(RDGD) NPs (10 mg ml−1 in water). NHS-PEG (Mw 750, 1 mg) was dissolved in water (100 μl) and 50 μl of the NHS-PEG solution was added to the ICG-encapsulated P(RDGD) NPs to obtained the PEGylated ICG-encapsulated P(RDGD) NPs. The reaction was stirred for 1 h at room temperature. Then, the obtained PEGylated ICG-encapsulated P(RDGD) NPs were washed from excess of PEG in dialysis cellulose membrane (∼12 kDa MWCO) against super-purified water. NHS-PEG, Mw 5000 was conjugated in a similar manner. The hydrodynamic and the dry diameters and size distribution of the NPs were characterized by DLS (Vasco 2, Cordouan Technologies SAS, France) and high resolution scanning electron microscopy (HR-SEM).We refer to the PEGylated (Mw 750) ICG-encapsulated P(RDGD) and PEGylated (Mw 5000) ICG-encapsulated P(RDGD)RGD NPs as PEGylated (750) ICG-encapsulated P(RDGD) and PEGylated (500) ICG-encapsulated P(RDGD) NPs throughout this manuscript, respectively.
Stability of the P(RDGD) NPs in wet and dry states
Stability of the non-PEGylated and PEGylated ICG-encapsulated P(RDGD) NPs was checked in both wet and dry states. In the wet state, PBS dispersions of the various P(RDGD) NPs (10 mg ml−1) were kept at 4 °C for 1 month while following their diameter. In the dry state, 10 mg of trehalose were added to 1 ml NP aqueous dispersions (10 mg ml−1) followed by lyophilization and then storage at 4 °C. The NP powders were then redispersed in water to their original concentration, then were characterized for their diameter.ICG loading capacity
Calibration curve of free ICG was obtained by measuring the mean excitation peaks intensity of standard solutions (0.5–10 μg ml−1) in water, at wavelength of 700–900 nm. The concentration of the ICG within the fluorescent PEGylated P(RDGD) and the non-PEGylated P(RDGD) NPs was determined by measuring the fluorescence intensity of the excitation peaks of the corresponding absorbance of a 10–0.1 mg ml−1 dispersion of free ICG in water. An estimation of encapsulated material per mg of NPs was determined according to the calibration curve.Photostability of the encapsulated ICG
An aqueous solution of free ICG, ICG encapsulated PEGylated P(RDGD) and the non-PEGylated P(RDGD) NPs in water were prepared to give similar fluorescence intensity. The fluorescence intensities were measured with λex set at 780 nm and λem set at 800 nm for ICG. Each of the samples was illuminated continuously with a xenon lamp, and the fluorescence intensity was measured over a period of 30 min by a Synergy fluorescence spectrophotometer (Agilent Technologies Inc.). Intensity values were normalized for comparison.Drug release model
PEGylated (Mw 750 and 5000) P(RDGD) and non-PEGylated ICG-encapsulated P(RDGD) NPs (500 μl, 10 mg ml−1) were incubated with PBS buffer (4.5 ml) or human serum (500 μl) and PBS buffer (4 ml), at 37 °C, giving a final concentration of 1 mg ml−1 NPs in a total volume of 5 ml. Samples were collected at several periods of time and the released ICG, as a model, was measured by UV spectrophotometer.In vitro XTT cell viability assay
The XTT assay was performed to determine the viability of the mCherry-labeled 4T1 mammary carcinoma cells after treatment with PEGylated and non-PEGylated ICG-encapsulated P(RDGD) NPs. Cells were seeded in a 96 well plate at a density of 104 cells per well in 100 μl culture medium and grown in a humidified 5% CO2 atmosphere at 37 °C. After 48 h at 37 °C, different volumes of the proteinoid NPs dispersed in water were added to the cells, giving final concentrations of 1 mg per ml per well. After incubation for 48 h at 37 °C, 50 μl XTT solution was added to each well according to the kit manufacturer's instructions. Absorbance was read at 490 nm. Cell viability was determined using the formula shown in the manufacturer's protocol.Chicken embryo model
Fertile chicken eggs were incubated in a forced-draft incubator at a temperature of 37 °C and humidified about 60% for 8 days, as described in the literature.24,25 Chorioallantoic membrane (CAM) was exposed, as a window was opened in the egg-shell after 8 days of incubation. 30 μl Matrigel was mixed with 5 × 10⁶ 4T1-RFP cells and implanted in the egg's CAM on a plastic ring. After 13 days, 100 μl of 0.1 mg ml−1 of the 3 different aqueous dispersed particles: PEGylated (5000) ICG-encapsulated P(RDGD), PEGylated (750) ICG-encapsulated P(RDGD) and non-PEGylated ICG-encapsulated P(RDGD) NPs were injected Intravenously (IV) into the largest blood vessels of each egg. After the injection, the window in the shell was sealed with transparent sellotape, and the chicken embryos were incubated and sacrificed after 4 h and 24 h post injection. Each experiment group contained 6 chicken embryos. The tumors of each embryo was examined in the MAESTRO fluorescence in vivo imaging system. Comparison of the tumors was performed by scanning the tumors at two wavelengths (fluorescent intensity of particles relative to fluorescent intensity of cancer cells).Non-PEGylated and PEGylated P(RDGD) NPs performance towards mCherry-labeled 4T1 breast tumors in Balb/c mouse model
Female Balb/c mice (8 week old, Harlan Laboratories, Inc. Israel) were injected intra-flank with 5 × 10⁵ mCherry-labeled 4T1 cells suspended in Matrigel. One week post injection the tumor appeared, and the mice were divided into 4 groups (n = 4) and were IV injected into the tail vein with 100 μl of free ICG (0.1 mg ml−1), PEGylated (750) ICG-encapsulated P(RDGD) NPs, PEGylated (5000) ICG-encapsulated P(RDGD) NPs and non-PEGylated ICG-encapsulated P(RDGD) NPs. The mice were sacrificed and their organs were scanned after 1, 2 and 5 days post treatment, using Maestro in vivo imaging system. Cy7 filter: λex 710–760 nm, λem > 800 nm was used to image the ICG and Cy5 filter was used to image the mCherry expressing tumor filter for the NPs. This experiment was repeated 3 times, while each experiment consisted of 4 mice per group.Animal experiments
All animal procedures were performed in accordance with the Guidelines for Care and Use of Laboratory Animals of Bar-Ilan University and approved by the Animal Ethics Committee of Bar Ilan University.Results and discussion
Synthesis and characterization of the RDGD proteinoid
The RGD proteinoid was synthesized while the aspartic acid serves as part of the RGD building blocks as well as a solvent and linker which helps to reduce the polymerization energy.16 Commonly, in our previous preparations a glassy mass was formed following proteinoid polymerization synthesis, and the water-soluble proteinoid polymer was separated from the insoluble cross-linked proteinoid polymer mass. In comparison to previously published proteinoids, no cross-linked proteinoid was obtained and the water-soluble P(RGD) yield was 100%. Table 1 exhibits the molecular weight and polydispersity indices (PDI) of the obtained P(RDGD). The relative high molecular weights (67![[thin space (1/6-em)]](https://www.rsc.org/images/entities/char_2009.gif) 660 Da) and very narrow molecular weight monodispersity is not expected but fits to our previous publications,17,26,27 since commonly step-growth polymerization processes result in low molecular weight polymers with broad molecular weight polydispersity.28
660 Da) and very narrow molecular weight monodispersity is not expected but fits to our previous publications,17,26,27 since commonly step-growth polymerization processes result in low molecular weight polymers with broad molecular weight polydispersity.28
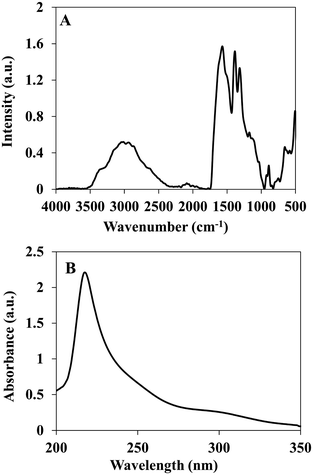
The P(RDGD) proteinoid was characterized by FTIR spectrometer and UV-Vis spectroscopy. This proteinoid showed similar peaks of NH stretching at 3356 and 2951 cm−l, amide CO stretching at 1570 cm−1, an amide NH bending band at 1490 cm−1 and CO bending at 500–660 cm−1, as shown in Fig. 2A. A characteristic absorbance peak was observed for the P(RDGD) proteinoid at 218 nm reflecting the absorbance of the peptide bonds, as shown in Fig. 2B.29
The P(RDGD) polymer contains one primary amine group, through which the NHS-PEG was bound (Fig. 1), at the terminal of each polymeric chain. Since the molecular weight of this polymer is 67![[thin space (1/6-em)]](https://www.rsc.org/images/entities/char_2009.gif) 600 g mol−1 we may calculate the concentration of the primary amine groups to be approximately 10−2 mmol g−1 proteinoid.
600 g mol−1 we may calculate the concentration of the primary amine groups to be approximately 10−2 mmol g−1 proteinoid.
Non-PEGylated and PEGylated ICG-encapsulated P(RDGD) NPs characterization
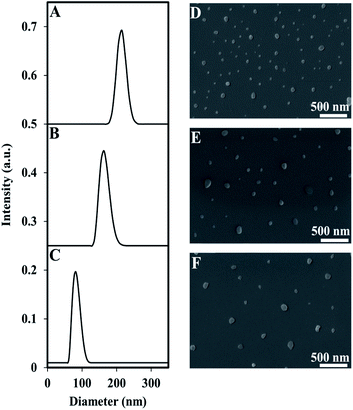
Encapsulation of the near IR dye, ICG, within P(RDGD) NPs was produced during the self-assembly process of the proteinoid NPs. The dry diameter of the ICG encapsulated NPs compared to the hollow NPs increased to 95 ± 13 nm from 47 ± 9, respectively, indicating a successful encapsulation of ICG.30The hydrodynamic size of the ICG-encapsulated NPs was 93 ± 20 nm. Following PEGylation of the ICG-encapsulated P(RDGD) NPs with NHS-PEG, Mw 750 or 5000, the hydrodynamic diameter increased to 177 ± 30 and 216 ± 25, respectively (Fig. 3).
In contrast, the dry diameter did not change significantly (Table 2). Rahme, K. et al. reported that the differences in layer thickness in the range of PEG (Mw 750–5000) is ∼0.42 nm, hence no great change in NPs diameter is noticed.31
| NPs series | Dry diametera (nm) | Hydrodynamic diameterb (nm) | Zeta potentialc (mV) |
|---|---|---|---|
| a Dry diameters (nm) were analyzed by using ImageJ software, an open source Java image processing program, as described in the Materials and methods section.b Wet diameters (nm) were measured by DLS.c Zeta potentials were measured by zetasizer zeta potential analyzer. | |||
| ICG-encapsulated P(RDGD) | 95 ± 13 | 93 ± 20 | −30 ± 7 |
| PEGylated (750) ICG-encapsulated P(RDGD) | 93 ± 15 | 177 ± 30 | 5 ± 3 |
| PEGylated (5000) ICG-encapsulated P(RDGD) | 95 ± 15 | 216 ± 25 | 3 ± 1 |
Zeta potential (ζ-potential) measurement at pH 11 demonstrated a change from −30 mV for the ICG-encapsulated P(RDGD) NPs to 5 and 3 mV for the PEGylated P(RDGD) NPs with the Mw 750 or 5000, respectively. The negative charge measured was due to the carboxyl residue on the particles surface. The decrease in the ζ-potential may indicates a successful conjugation of the PEG chains to the surface residues of the P(RDGD) NPs.31,32
The concentration of the encapsulated ICG was determined according to the calibration curve of the free ICG in water, at wavelength of 700–900 nm. The concentration of the encapsulated ICG was calculated to be 0.1 mg ml−1 per 10 mg NPs (1% w/w ICG relative to the proteinoid NPs). The stability of the dispersed NPs in an aqueous phase (10 mg ml−1, stored at 4 °C) against agglomeration was evaluated over a period of 1 month. No change in the non-PEGylated and PEGylated ICG-encapsulated P(RDGD) NPs diameter was observed (see Fig. S1 and Table S1†). The stability of these NPs in the dry state was investigated by adding 10 mg of trehalose (a well-known cryoprotectant routinely used for this purpose)33 to 1 ml NP aqueous dispersion (10 mg ml−1) followed by lyophilization and then storage at 4 °C for 1 month. The NP powders were then redispersed in water to their original concentration, and found to have the same diameter and size distribution, indicating their stability against agglomeration.
Photostability of the encapsulate ICG
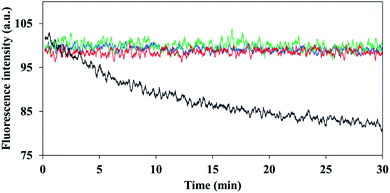
It has been reported that encapsulation of a fluorophore can increase the photostability of dye fluorescence degradation.34 Illumination was performed continuously at 780 nm for a period of 30 minutes, for the non-PEGylated and PEGylated ICG-encapsulated P(RDGD) NPs and were compared to the photostability of the free ICG. While the fluorescence intensity of the non-PEGylated and PEGylated ICG-encapsulated P(RDGD) NPs was not affected by the continuous illumination, the free ICG fluorescence decreased by 20%, as shown in Fig. 4. This indicates that ICG is encapsulated within the NPs and thus is protected against oxidation, reducing agents, heat, illumination levels or exposure time which may decrease the fluorescence intensity.35,36Controlled release of ICG from the non-PEGylated and PEGylated ICG-encapsulated P(RDGD) NPs in PBS and human serum
A common method for studying the in vitro drug release is by incubation in human serum or PBS.37 In order to evaluate the ICG (a drug model) release from the non-PEGylated and PEGylated ICG-encapsulated P(RDGD) NPs in different physiological conditions, the NPs were incubated in PBS or human serum for 2.5 h at 37 °C. Fig. 5 demonstrates the UV absorbance intensities of ICG from the non-PEGylated and PEGylated ICG-encapsulated P(RDGD) NPs following treatment in human serum (Fig. 5A) or PBS (Fig. 5B). The sustained release of the ICG from the non-PEGylated and PEGylated ICG-encapsulated P(RDGD) NPs in human serum is probably due to the degradation of the P(RDGD) NPs which are biodegradables by proteolytic enzymes in the serum.16 It is clearly evident that following 2.5 h incubation in human serum, the non-PEGylated ICG-encapsulated P(RDGD) NPs absorbance significantly decreases by 40%. On the other hand, there is a significantly less decrease by 10 and 20% in the absorbance of the Mw 5000 and 750 PEGylated ICG-encapsulated P(RDGD) NPs, respectively. The difference in the ICG degradation of the NPs could be explained by the presence of the PEG chains and the importance of the chains length in preventing the NPs biodegradation.38 Hence, it can be deduced that the longer the PEG chain, the stability of the ICG within the NPs increases. On the other hand, following incubation with PBS, a slight, but not significate, decrease of 5% in UV absorbance is noticeable in all samples. To summarize, the results indicated a successful PEG conjugation, and it clearly demonstrates that PEGylation has major influence on the release rate of the ICG from the P(RDGD) NPs to the continuous phase.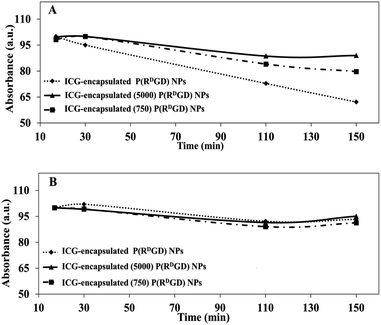 | ||
| Fig. 5 Relative absorbance of non-PEGylated and PEGylated ICG-encapsulated P(RDGD) NPs in various physiological solutions: human serum (A) and PBS (B) over 2.5 h incubated at 37 °C. | ||
Cytotoxicity of the P(RDGD) NPs for 4T1 mammary carcinoma cells
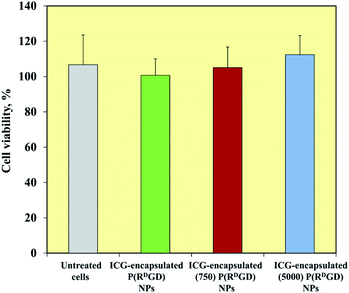
mCherry-labeled 4T1 mammary carcinoma cells were treated for 48 h with ICG-encapsulated non-PEGylated and PEGylated ICG-encapsulated P(RDGD) NPs (1 mg ml−1). Fig. 6 exhibits the cell viability levels post treatment. Cells treated with non-PEGylated and the PEGylated P(RDGD) did not exhibit any decrease in the cell viability after 48 h of treatment. It should be noted that the cell viability increases (above 100%) after 48 hours of treatment, this could be explained by the uptake of the P(RGD) NPs as a nutrient (e.g., glucose, amino acids etc.).39 In conclusion, both the non-PEGylated and PEGylated ICG-encapsulated P(RDGD) NPs do not exhibit any toxic effect towards the cells.Non-PEGylated and PEGylated ICG-encapsulated P(RDGD) NPs targeting of mCherry-labeled 4T1 tumor in a CAM model
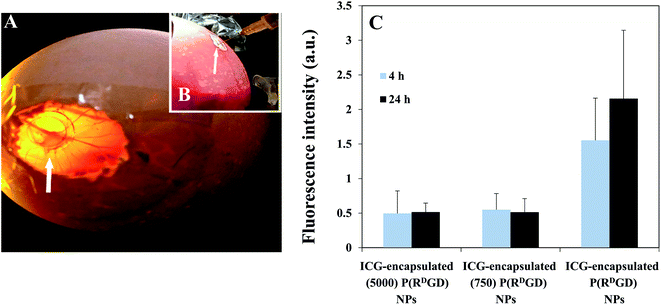
The chick chorioallantoic membrane (CAM) experiment is a well-known model, simple and of low cost in comparison to other animal models. The advantage of this model is reduction of unnecessary animal suffering since the procedure is carried out on the embryonic tissue. In addition, the membrane located around the chicken embryo can be utilized to graft tumor explants as its highly vascularized,24,40 and thus it enables to carry out in vivo studies of tumors in a short period of time and reduce the number of mice in further experiments. The fertile chicken eggs were incubated in a forced-draft incubator and a chorioallantoic membrane (CAM) was exposed, as a window and 4T1-RFP cells that were implanted begin to grow into a solid tumor on a plastic ring as shown in Fig. 7A. The PEGylated (750 or 5000) ICG-encapsulated P(RDGD) and the ICG-encapsulated P(RDGD) NPs were injected Intravenously (IV) into the largest blood vessels of each egg, as demonstrated in Fig. 7B. Fig. 7C demonstrates 4T1 mammary carcinoma tumors explants on the CAM following treatment with non-PEGylated and PEGylated ICG-encapsulated P(RDGD) NPs after 4 and 24 h. Both the P(RDGD) NPs, the PEGylated and the non-PEGylated, reached to the tumor. The fluorescence intensity of non-PEGylated ICG-encapsulated P(RDGD) NPs was significance higher in comparison to the PEGylated ICG-encapsulated NPs. Indicating that non-PEGylated ICG-encapsulated P(RDGD) NPs accumulated with higher concentration after 4 and 24 h compared to the PEGylated ICG-encapsulated P(RDGD) NPs. This fact can be explained due to the PEGylation of the P(RDGD) NPs that yields an improved packing with lesser bio-degradable bonds which prevent a quick disassembly of the PEGylated P(RDGD) NPs at the tumor site, resulting a decrease rate of ICG release.Non-PEGylated and PEGylated ICG-encapsulated P(RDGD) NPs targeting in a mice model treated with mCherry-labeled 4T1 mammary carcinoma cells
In order to evaluate the performance of the PEGylated and the non-PEGylated ICG-encapsulated P(RDGD) NPs towards tumor for prolonged time, more than 24 h, an experiment in in vivo xenograph mouse model was performed. Mice cancer 4T1 mammary carcinoma cells were injected subcutaneously into Balb/c mice to induce a xenograft. Two weeks after the tumor injection the mice were treated with free ICG 0.1 μg ml−1 or 100 μl of 0.1 mg ml−1 of either non-PEGylated or PEGylated ICG-encapsulated P(RDGD) NPs via IV injection into the tail vein. The fluorescence intensity measurements prior injection of the free ICG and the non-PEGylated or PEGylated ICG-encapsulated P(RDGD) NPs were all equal. Analysis of the fluorescence intensity images of tumors which were harvested after 24, 48, and 120 h post injection is demonstrated in Fig. 8. It is clearly noticeable that, as time progresses the fluorescence of the PEGylated and the non-PEGylated ICG-encapsulated P(RDGD) NPs and still remains visible. These results clearly indicated that PEGylated and non-PEGylated ICG-encapsulated P(RDGD) NPs accumulate in the area of the tumor as time passes after 24, 48 and 120 h indicating a targeted delivery of the NPs to the tumor and not a passive uptake as demonstrated in Fig. 8A–C. The fluorescence intensities of the free ICG a decreased rapidly and didn't present after 24 and 48 h in the tumor areas as shown in Fig. 8D, respectively. Furthermore, unlike the PEGylated ICG-encapsulated P(RDGD) NPs which the fluorescence increased with time, the ICG-encapsulated P(RDGD) NPs did not change significantly and remained relatively stable (Fig. 8E). Hence it can be concluded that the addition of the PEG has a major role in the stabilization of the particle. In addition, the results also indicate that the length of the PEG chain has an effect on the targeting ability of the NPS. The elongation of the PEG from Mw 750 to 5000 directly reduces the PEGylated ICG-encapsulated P(RDGD) NPs migration towards the tumors, indicating enhanced PEG shielding.41 After 120 h the ICG-encapsulated (750) P(RDGD) NPs exhibited to be the most efficient compared to the other particles. Recent studies42,43 suggested that NPs which are not charged and have a small hydrodynamic diameter, can be an ideal candidate for targeted cancer delivery, due to reduced cellular interactions such as, interactions with healthy human cells. The ICG-encapsulated (750) P(RDGD) NPs (177 ± 30 nm) confirmed this study, as on the one hand they are not as large as the ICG-encapsulated (5000) P(RDGD) NPs (216 ± 25 nm) and on the other hand they are not significantly charged (5 ± 3 mV) as the ICG-encapsulated P(RDGD) NPs (−30 ± 7 mV).Summary and conclusions
In this study, we present low cost and simple proteinoids nano-particles based on amino acid arginine (D), glycine and aspartic acid as building block. The self-assembly of the P(RDGD) proteinoid to in the presence of ICG yielded ICG-encapsulated P(RDGD) NPs. PEGylation of ICG-encapsulated P(RDGD) NPs were produced with conjugating NHS-PEG, with different PEG lengths (Mw 750 and 5000), yielding ICG-encapsulated (750 or 5000) P(RDGD) NPs. All the PEGylated and the non-PEGylated ICG-encapsulated P(RDGD) NPs prove to be a successful encapsulation for ICG. Photostability tests demonstrated that following ICG encapsulation and PEGylation of the P(RDGD) NPs, the fluorescence of the encapsulated-ICG was stable in comparison to the free ICG. The PEGylated and the non-PEGylated ICG-encapsulated P(RDGD) NPs exhibited similar dry diameter of ∼95 nm. However, the hydrodynamic size was different 93 ± 20 nm for the non-PEGylated ICG-encapsulated P(RDGD) NPs and 177 ± 30 and 216 ± 25 nm for the PEGylated ICG-encapsulated P(RDGD) NPs (750 or 5000). All of the P(RDGD) NPs exhibit no cytotoxicity towards 4T1 mammary carcinoma cells. In human serum stability tests the P(RDGD) with the longer PEG chain (Mw 5000) demonstrated better stability than the shorter PEG chain (Mw 750) or the non-PEGylated. In CAM model, the ICG-encapsulated P(RDGD) NPs exhibited a higher uptake in the tumors region in comparison to the PEGylated ICG-encapsulated P(RDGD) NPs. However, in tumor xenograft mouse model, which enables to prolonging of the experiment, it is clearly noticeable the importance of the PEG due to the high accumulation with time of both the PEGylated P(RDGD) NPs compared to the non-PEGylated P(RDGD). Moreover, the length of the PEG chain plays a major role in the ability to target the tumor. The longer the PEG chain, the NPs the RGD residues on the NPs are more shielded and the targeted ability of the NPs are reduced. Hence, we can conclude that selectivity towards the tumors area of PEGylated and the non-PEGylated ICG-encapsulated P(RDGD) NPs can be utilized for targeting to areas of angiogenesis, such as in the cases of tumors, wounds or cuts, etc.Our future plans include investigating the ability of P(RDGD) NPs as a targeted drug carrier by encapsulating and conjugating various chemotherapeutics such as doxorubicin or paclitaxel or other proteins to the RDGD proteinoid NPs.
Funding
This research did not receive any specific grant from funding agencies in the public, commercial, or not-for-profit sectors.Conflicts of interest
There are no conflicts to declare.References
- M. D. Pierschbacher and E. Ruoslahti, Nature, 1984, 309, 30–33 CrossRef CAS.
- P. K. Dubey, V. Mishra, S. Jain, S. Mahor and S. P. Vyas, J. Drug Targeting, 2004, 12, 257–264 CrossRef CAS.
- S. M. Weis and D. A. Cheresh, Nat. Med., 2011, 17, 1359–1370 CrossRef CAS.
- X. Fu, Y. Yang, X. Li, H. Lai, Y. Huang, L. He, W. Zheng and T. Chen, Nanomedicine, 2016, 12, 1627–1639 CrossRef CAS.
- H. Q. Yin, D. S. Mai, F. Gan and X. J. Chen, RSC Adv., 2014, 4, 9078–9085 RSC.
- E. Ruoslahti, Annu. Rev. Cell Dev. Biol., 1996, 12, 697–715 CrossRef CAS.
- B. Kieffer, G. Mer, A. Mann and J.-F. Lefèvre, Int. J. Pept. Protein Res., 2009, 44, 70–79 Search PubMed.
- S. W. Fox, Science, 1960, 132, 200–208 CAS.
- S. W. Fox, Am. Biol. Teach., 1974, 36, 161–172 CrossRef.
- S. W. Fox, Geochim. Cosmochim. Acta, 1995, 59, 1213–1214 CrossRef CAS.
- S. W. Fox, J. R. Jungck and T. Nakashima, Origins Life, 1974, 5, 227–237 CrossRef CAS.
- P. O. Montgome, S. W. Fox, R. J. Mccauley, T. Fukushim and C. R. Windsor, Fed. Proc., 1967, 26, 749 Search PubMed.
- R. M. Syren, S. W. Fox, T. Nakashima and A. Przybylski, Int. J. Nanomed., 1982, 22, 195–204 Search PubMed.
- S. W. Fox and K. Harada, US Pat., 3052655, 1962.
- K. Harada and M. Matsuyama, BioSystems, 1979, 11, 47–53 CrossRef CAS.
- M. Kolitz-Domb and S. Margel, Isr. J. Chem., 2018, 58, 1277–1285 CrossRef CAS.
- S. M. S. Kile, M. Kolitz-Domb and E. Corem-Salkmon, International Journal of Nanotechnology and Nanomedicine, 2017, 2, 1–11 Search PubMed.
- A. Madhan Kumar and K. Panduranga Rao, Biomaterials, 1998, 19, 725–732 CrossRef CAS.
- T. T. H. Thi, E. H. Pilkington, D. H. Nguyen, J. S. Lee, K. D. Park and N. P. Truong, Polymers, 2020, 12(2), 298–319 CrossRef CAS.
- K. Kazunori, S. K. Glenn, Y. Masayuki, O. Teruo and S. Yasuhisa, J. Controlled Release, 1993, 24, 119–132 CrossRef.
- P. Aggarwal, J. B. Hall, C. B. McLeland, M. A. Dobrovolskaia and S. E. McNeil, Adv. Drug Delivery Rev., 2009, 61, 428–437 CrossRef CAS.
- C. Peng, L. Zheng, Q. Chen, M. Shen, R. Guo, H. Wang, X. Cao, G. Zhang and X. Shi, Biomaterials, 2012, 33, 1107–1119 CrossRef CAS.
- A. Gabizon and F. Martin, Drugs, 1997, 54(suppl. 4), 15–21 CrossRef CAS.
- A. Vargas, M. Zeisser-Labouèbe, N. Lange, R. Gurny and F. Delie, Adv. Drug Delivery Rev., 2007, 59, 1162–1176 CrossRef CAS.
- N. A. Lokman, A. S. F. Elder, C. Ricciardelli and M. K. Oehler, Int. J. Mol. Sci., 2012, 13, 9959–9970 CrossRef CAS.
- E. Sason, M. Kolitz-Domb, J. H. Chill and S. Margel, ACS Omega, 2019, 4, 9352–9360 CrossRef CAS.
- M. Kolitz-Domb and S. Margel, Isr. J. Chem., 2018, 58, 1277–1285 CrossRef CAS.
- A. Yokoyama and T. Yokozawa, Macromolecules, 2007, 40, 4093–4101 CrossRef CAS.
- J. M. Walker, The Protein Protocols Handbook, 1996 Search PubMed.
- S.-J. J. Kim, P. K. Bae and B. H. Chung, Chem. Commun., 2015, 51, 107–110 RSC.
- K. Rahme, L. Chen, R. G. Hobbs, M. A. Morris, C. O'Driscoll and J. D. Holmes, RSC Adv., 2013, 3, 6085–6094 RSC.
- B. Pelaz, P. Del Pino, P. Maffre, R. Hartmann, M. Gallego, S. Rivera-Fernández, J. M. De La Fuente, G. U. Nienhaus and W. J. Parak, ACS Nano, 2015, 9, 6996–7008 CrossRef CAS.
- Y. Gokce, B. Cengiz, N. Yildiz, A. Calimli and Z. Aktas, Colloids Surf., A, 2014, 462, 75–81 CrossRef CAS.
- S. Cohen, M. Pellach, Y. Kam, I. Grinberg, E. Corem-Salkmon, A. Rubinstein and S. Margel, Mater. Sci. Eng., C, 2013, 33, 923–931 CrossRef CAS.
- P. Sharma, S. Brown, G. Walter, S. Santra and B. Moudgil, Adv. Colloid Interface Sci., 2006, 123–126, 471–485 CrossRef CAS.
- E. I. Altinoǧlu and J. H. Adair, Wiley Interdiscip. Rev.: Nanomed. Nanobiotechnol., 2010, 2, 461–477 Search PubMed.
- T. H. Kim, Y. Chen, C. W. Mount, W. R. Gombotz, X. Li and S. H. Pun, Pharm. Res., 2010, 27, 1900–1913 CAS.
- S. T. Proulx, P. Luciani, S. Derzsi, M. Rinderknecht, V. Mumprecht, J. C. Leroux and M. Detmar, Cancer Res., 2010, 70, 7053–7062 CrossRef CAS.
- M. G. Vander Heiden, L. C. Cantley, C. B. Thompson, P. Mammalian, C. Exhibit and A. Metabolism, Sci. 80, 2009, 324, 1029 CrossRef CAS.
- F. Durupt, D. Koppers-Lalic, B. Balme, L. Budel, O. Terrier, B. Lina, L. Thomas, R. C. Hoeben and M. Rosa-Calatrava, Cancer Gene Ther., 2012, 19, 58–68 CrossRef CAS.
- Z. Ge, Q. Chen, K. Osada, X. Liu, T. A. Tockary, S. Uchida, A. Dirisala, T. Ishii, T. Nomoto, K. Toh, Y. Matsumoto, M. Oba, M. R. Kano, K. Itaka and K. Kataoka, Biomaterials, 2014, 35, 3416–3426 CrossRef CAS.
- S. Y. Khor, M. N. Vu, E. H. Pilkington, A. P. R. Johnston, M. R. Whittaker, J. F. Quinn, N. P. Truong and T. P. Davis, Small, 2018, 14, 1–13 CrossRef.
- M. N. Vu, H. G. Kelly, A. K. Wheatley, S. Peng, E. H. Pilkington, N. A. Veldhuis, T. P. Davis, S. J. Kent and N. P. Truong, Small, 2020, 2002861 CrossRef CAS.
Footnote |
| † Electronic supplementary information (ESI) available. See DOI: 10.1039/d0ra06069k |
| This journal is © The Royal Society of Chemistry 2020 |

