
 Open Access Article
 This Open Access Article is licensed under a Creative Commons Attribution-Non Commercial 3.0 Unported Licence
Correlation between microstructure and properties of graphene oxide/waterborne polyurethane composites investigated by positron annihilation spectroscopy
Xiaobing Han,
Jie Gao *,
Zhiyuan Chen,
Xiuqin Tang,
Yuan Zhao and
Tao Chen*
*,
Zhiyuan Chen,
Xiuqin Tang,
Yuan Zhao and
Tao Chen*
Hubei Key Laboratory of Radiation Chemistry and Functional Materials, Hubei Collaboration Innovative Center for Nonpower Nuclear Technology, School of Nuclear Technology and Chemistry & Biology, Hubei University of Science and Technology, Xianning 437100, China. E-mail: gaojie2019@hbust.edu.cn; taochen518@163.com
First published on 1st September 2020
Abstract
A quantitative description of microstructure is highly desirable for the precise construction of high performance graphene based polymer composites. In this paper, the effects of doping graphene oxide (GO) on the microstructure, thermal and mechanical properties of the obtained graphene oxide/waterborne polyurethane (GO/WPU) composites were systematically investigated. In order to give a deep insight into the microstructure of GO/WPU composites, especially for the relative free volume fraction (fr) and interfacial interaction intensity (β), positron annihilation lifetime spectroscopy (PALS) was employed for its quantitative characterization. With the increase of GO content, the fr decreased first and then increased, the lowest value was observed for the composites containing 0.5 wt% GO. This can be ascribed to the change in the dispersed state of GO and interfacial interactions, which agree well with the results of SEM. The correlation between microstructure and properties was established with the PALS results, the values of fr and β give a good explanation of the variation in glass transition temperature and tensile strength, respectively.
Introduction
Much attention has been focused on waterborne polyurethane (WPU) materials, because of their nontoxic, excellent elasticity, flexibility, abrasion resistance, and non-flammable properties and anticorrosion performance.1 However, WPU possesses inferior mechanical properties, thermal stability, and barrier properties, compared to solvent-based polyurethane.2 To overcome these problems, many kinds of nanofillers (such as silica, metal oxides, carbon nanotube, graphene, graphene oxide, etc.) have been incorporated within WPU matrices.3 As an important derivative of graphene, graphene oxide (GO) possesses excellent water dispersibility, relatively good barrier properties and mechanical properties, and has been widly used in the construction of GO/WPU nanocomposites.4One of the most important factors that influence the properties of graphene/polymer composites is the interfacial interaction between the nanosheets and polymer chain, because it determines both the dispersion of the nanosheets and the free volume of the obtained nanocomposites.5,6 Thus, interfacial interaction enhancement has to be considered first in the construction of high-performance graphene/polymer nanocomposites.7,8 Since there are many kinds of oxygen-containing groups (hydroxyl, carboxyl, ether) and aromatic regions on GO, synergistic interfacial interactions (hydrogen bond, electrostatic attraction and π–π stacking) can be precisely constructed between GO and different polymers.9–12 These synergistic interfacial interactions can serve as sacrificial bonds to improve the mechanical properties, thermal stability, and barrier properties of GO/WPU.13,14 Although significant progress has been made in the developing of GO/WPU composites,15–20 and synergistic interfacial interactions were constructed in the fabrication procedure, yet there are few reports about the interfacial interaction intensity, free volume fraction, and the correlation between these parameters and properties for GO/WPU nanocomposites.
The positron annihilation lifetime spectroscopy (PALS) is a helpful tool to probe the atomic scale defects, free volume and relative free volume fraction (fr) for a wide variety of polymer nanocomposites.21,22 The positron originate from a radioactive 22Na are injected into polymer matrix, and get thermalized rapidly by losing energy. Then, the thermalized positron diffuse in the polymer, annihilating directly with electrons or indirectly by forming positronium (Ps, a bound state of e+ and e−). The Ps exists in two spin states: para-positronium (p-Ps) spins are antiparallel and ortho-positronium (o-Ps) spins are parallel. Ps are preferentially localized in free volume cavity in polymers, the pick-off annihilation lifetime of o-Ps (τ3) is well correlated to the free volume size, according to the free volume model. While the size of the free volume cavity increases, the electron density seen by o-Ps decreases, thus o-Ps lives a longer lifetime.23,24 Zhou et al. reported the application of PALS in the structure transition investigation of epoxy-multiwalled carbon nanotubes (MWNT), the results of free volume cavity size under temperature revealed that the MWNT fillers can enhance the structure transition temperatures of the composites.25 The free volume nanoholes of phenol–formaldehyde–MWNT composites has been reported by the group of Pujari,26 the free volume has a nonlinear variation with MWTN concentration, which indicated the agglomeration of MWTN in the matrix at higher concentration. In the work reported by Xue et al.,27 the PALS technique was used to investigate the free volume of rGO/PVA composites. The smallest free volume was observed at 0.5 wt% rGO sample, which can be ascribed to the interfacial interaction between rGO and PVA. The influence of rGO on the free volume and conductivity of polycarbonate composites were systemically studied by PALS in Zhong group,28 the results of PALS indicate the properties of free volumes fluctuate around the conductive percolation threshold.
Nowadays, the PALS technique not only can reveal the character about free volume, but also can explore the intensity of interfacial interaction. The intermediate lifetime τ2 is assigned to the annihilation of positron trapped in various vacancies.24 The variation of the intermediate lifetime intensity (I2) can be used to characterize the interfacial interaction in the polymer composites. If there are no interaction between polymer matrix and nanofiller, I2 only comes from positron annihilation in matrix and nanofiller according to the simple mixture rule. At this condition, I2 increases linearly with the increase of filler weight fraction. Actually, interfacial interaction exists in polymer composites in most cases, thus positive or negative deviations occurred between the experimental results and the calculated results.25,26 The interaction parameter β (an intuitionistic characterization of the interaction) was then introduced to characterize the interfacial interaction between polymer matrix and nanofiller,27,28 which provide new methods for the correlation between microstructure and properties, while the utilization of PALS in GO/WPU system has rarely been reported.
In the present work, the WPUs doped with different loadings of graphene oxide were prepared. Firstly, the microstructure of the obtained GO/WPU composites was qualitative characterized with traditional scanning electron microscopy and Fourier transform infrared. For further information about the microstructure, then the PALS was used to reveal the free volume properties and interfacial interaction of GO/WPU composites. The results of relative free volume fraction and interfacial interaction parameter gives a good explanation of the variation in glass transition temperature and tensile strength, respectively.
Results and discussion
Morphology of GO, WPU and GO/WPU composites
Scanning electron microscopy (SEM) is an effective method to direct probe the microstructure of graphene oxide (GO) based polymer composites. As shown in Fig. 1a, the SEM images reveal that the exfoliated GO sheets presenting layered structures. The wrinkled and folded surface resulted in the GO having a large aspect ratio and specific area, which is benefit for the adhesion of polymer.29 Consequently, strong interfacial interaction can be construct between GO and polar polymer, resulting in improved mechanical property through sacrificial bonds (hydrogen bond, π–π stacking, electrostatic attraction, etc).30,31 It is accessible to investigate the exfoliation state of GO using transmission electron microscopy (TEM) by dropping a small quantity of the dispersion onto the carbon grids. As shown in Fig. 1b, the TEM image show that graphene oxide was fully exfoliated into individual sheets in water by ultrasonic treatment, presenting flat yet wrinkled nanosheets shape. The fully exfoliation of GO can be ascribed to the hydrophilicity of oxygen-containing groups, electrostatic repulsion and steric repulsion between adjacent GO sheets.32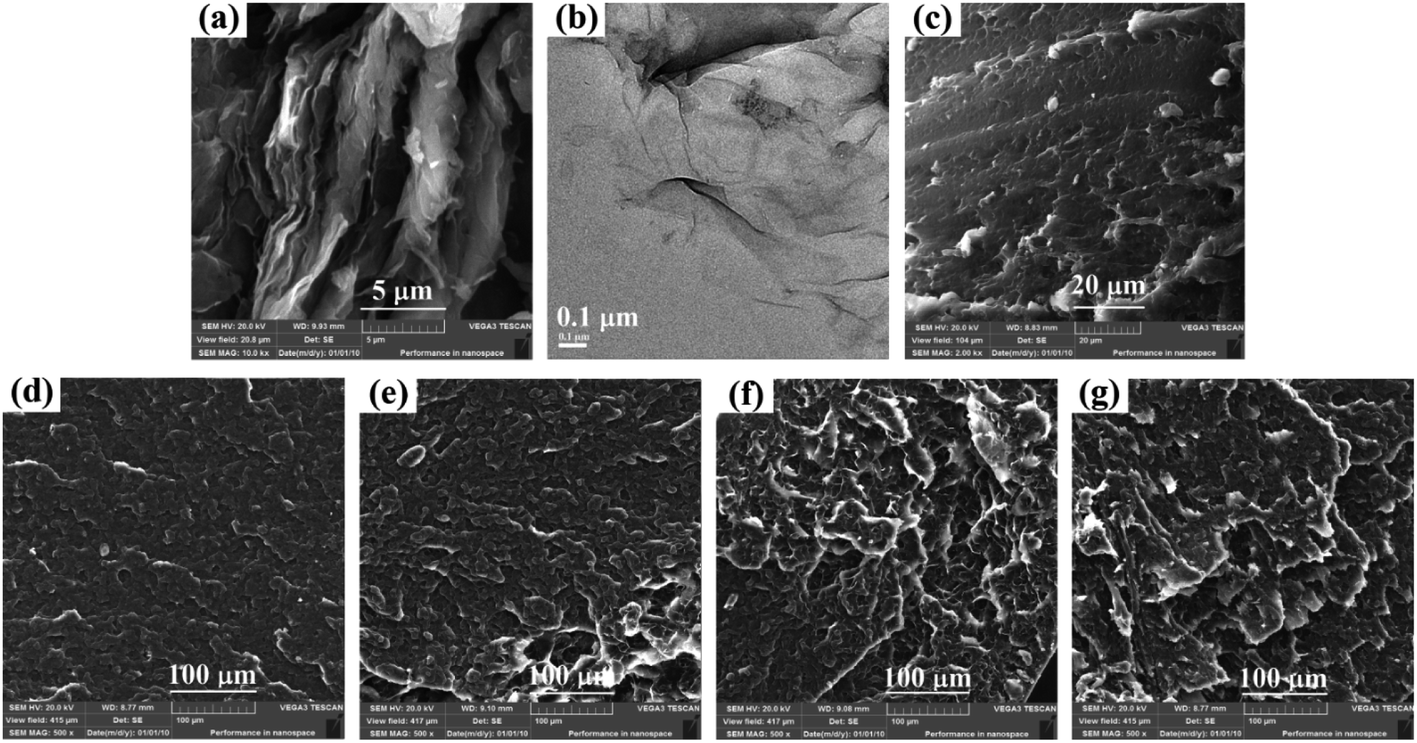 | ||
| Fig. 1 (a) SEM images and (b) TEM images of GO. (c–g) SEM images of fracture surface for pure WPU, 0.25, 0.5, 1.0, 2.0 wt% composites. | ||
The dispersion condition of nanofiller in polymer matrix is a key factor for the properties of obtained composites. The compatibility of GO in WPU was evaluated via SEM observation of the fracture surface of neat WPU and GO/WPU composites. As shown in Fig. 1c, the pure WPU displays a relatively loose and flat surface. The morphology changed dramatically after the introduction of GO. For the composites containing 0.25 and 0.5 wt% GO (Fig. 1d and e), GO was well-dispersed into the WPU matrix, a dense and layer by layer stacking surface can be observed. This may be attributed to the strong interfacial interaction between GO and WPU, which will improve the mechanical properties of the composites.33 For the composites containing 1 and 2 wt% GO (Fig. 1f and g), a rough and relative loose surface can be observed. This may be ascribed to the agglomerates increase of GO, which is not benefit for the dissipation of stress.34 Although the dispersity of GO and the compaction of composites can be direct observed from the SEM images, yet the information about interfacial interaction intensity and free volume fraction can not obtained.
Interfacial interaction between of GO and WPU
To verify the chemical structure of prepared GO and WPU, and elucidate the interfacial interaction between GO and WPU, the FTIR spectra of GO, WPU, and 0.5 wt%GO/WPU composites were measured and shown in Fig. 2a. The FTIR spectrum of GO clearly marked the presence of GO as evident from the observed bands at 3400 cm−1 (O–H stretching), 1730 cm−1 (C![[double bond, length as m-dash]](https://www.rsc.org/images/entities/char_e001.gif) O stretching), 1410 cm−1 (O–H bending), 1050 cm−1 (C–O bending).29,35 In the spectrum of WPU, the peak at 3346, 1734, 1539 cm−1 are due to N–H, CO, C–N stretching in the carbamate group. The symmetric and asymmetric C–H vibrations of –CH2– observed at 2861 and 2942 cm-1 can be attributed to the polyurethane chains.33,34 As for the FTIR spectrum of 0.5 wt%GO/WPU, the peak of N–H and CO stretching shift to 3325 and 1712 cm−1, which demonstrates the hydrogen bond interactions between GO and WPU.36–38 According to the result of FITR analysis, illustration of the hydrogen bond interactions is provided in Fig. 2b. However, only the type of interfacial interaction can be determined through FTIR spectra, the intensity of interfacial interactions can not provided.
O stretching), 1410 cm−1 (O–H bending), 1050 cm−1 (C–O bending).29,35 In the spectrum of WPU, the peak at 3346, 1734, 1539 cm−1 are due to N–H, CO, C–N stretching in the carbamate group. The symmetric and asymmetric C–H vibrations of –CH2– observed at 2861 and 2942 cm-1 can be attributed to the polyurethane chains.33,34 As for the FTIR spectrum of 0.5 wt%GO/WPU, the peak of N–H and CO stretching shift to 3325 and 1712 cm−1, which demonstrates the hydrogen bond interactions between GO and WPU.36–38 According to the result of FITR analysis, illustration of the hydrogen bond interactions is provided in Fig. 2b. However, only the type of interfacial interaction can be determined through FTIR spectra, the intensity of interfacial interactions can not provided.
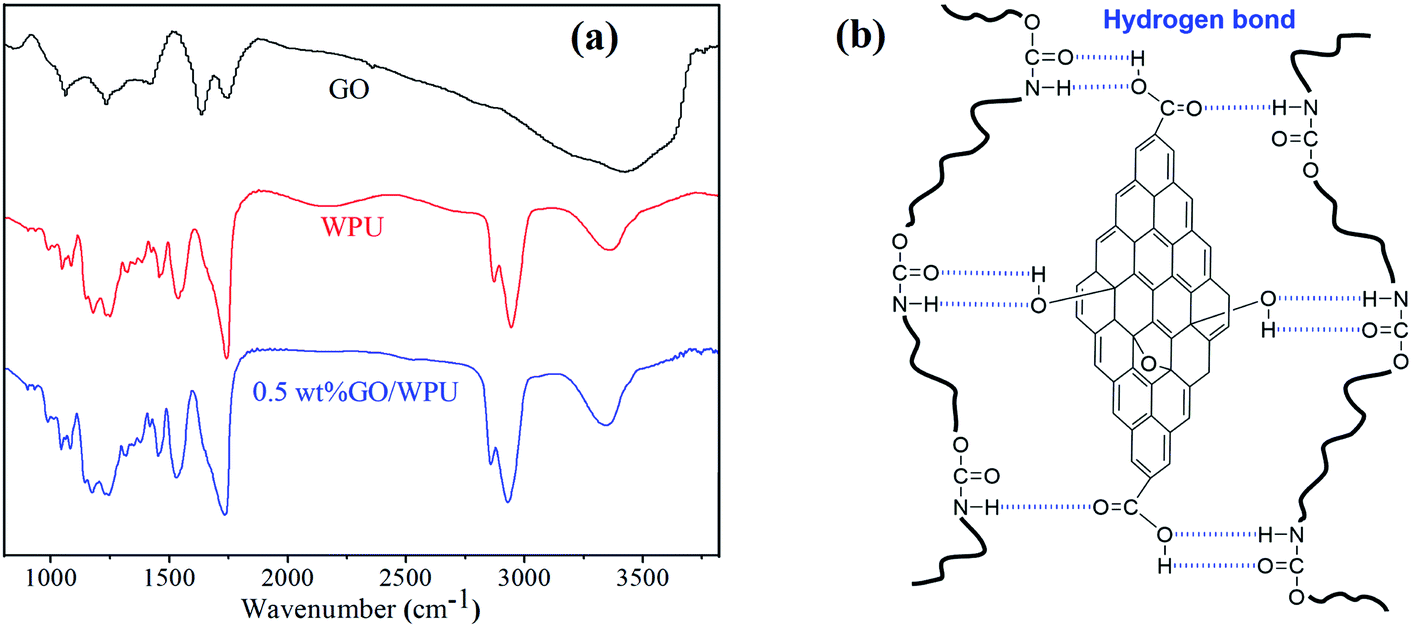 | ||
| Fig. 2 (a) FTIR spectra of GO, WPU and 0.5 wt% GO/WPU. (b) Hydrogen bond interactions between GO and WPU. | ||
Positron annihilation lifetime spectroscopy
In order to quantitative study the effects of GO on the microstructure of composites, the positron annihilation lifetime spectroscopy (PALS) were carried out. Positron annihilation lifetime spectroscopy was carried out by a conventional fast–fast coincidence spectrometer at room temperature. The positron source 22Na was sandwiched between two samples with a thickness over 1 mm. One million counts were recorded for each spectrum, which was resolved into three components by a commonly used positron annihilation fitting program. The third lifetime component τ3 (1.4–2.6 ns) is used to calculated the volume of free volume cavity (Vf) according to the follow equations:
 | (1) |
 | (2) |
| f = CVfI3. | (3) |
| fr = VfI3. | (4) |
The o-Ps lifetime (τ3), free volume size (Vf), the intensity of o-Ps lifetime (I3) and the relative free volume fraction (fr) as a function of GO content were shown in Fig. 3a–c respectively. As shown in Fig. 3a, the decrease in τ3 suggests the decrease in mean size of polymer free volume cavities, the smallest τ3 and Vf were observed for the composite contain 0.5 wt% GO.6,21 This is due to the fully exfoliated of GO at low loading level, in which large surface area provided by GO is benefit for the formation of hydrogen bond (Fig. 2b), limiting the mobility of WPU chains and resulting in decease of τ3 and Vf.27,36 In addition, τ3 and Vf showed a continuous increase with further increase of GO loading, this can be ascribed to the agglomeration of GO nanosheets, where weak interfacial interaction between stacked GO and WPU chains has little restriction on the chain movement, leading to a larger τ3 and Vf.27,36 Compared with the pure polymer matrix (WPU), lager τ3 and Vf were observed for the composite with high filler load level (2 wt% GO), which is different from the PVA/rGO composites.25 This maybe explained as that the WPU chain has a lower crystalline ability than PVA, which can not effectively restrict the increase of the mean size of cavity caused by agglomeration of GO nanosheets.13,22
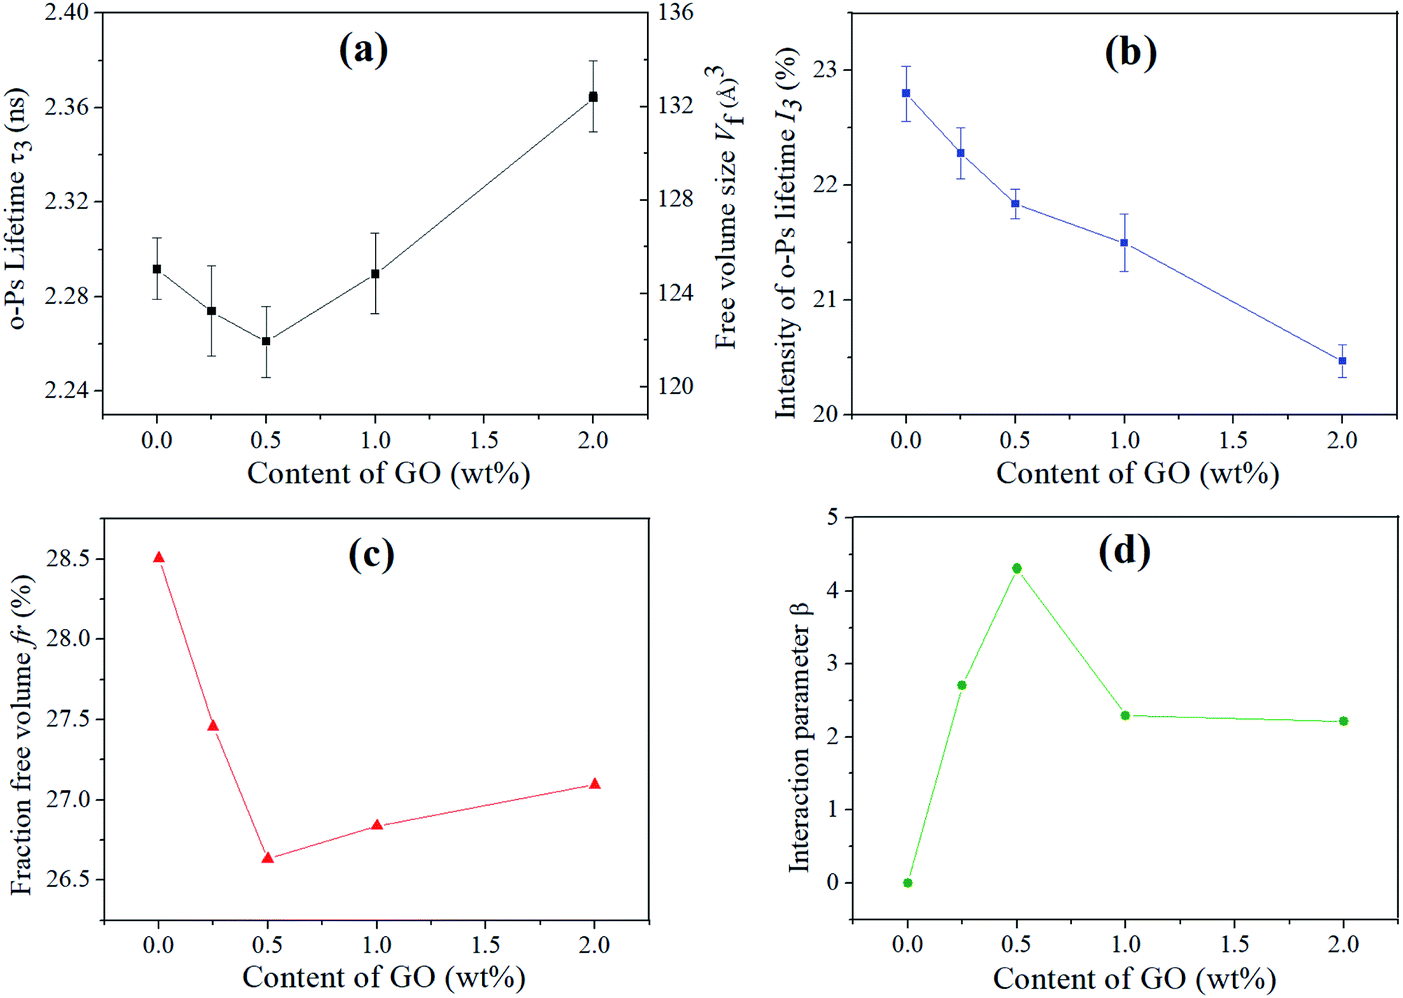 | ||
| Fig. 3 (a) o-Ps lifetime τ3 and free volume size Vf, (b) o-Ps lifetime intensity I3, (c) fractional free volume fr, (d) interfacial interaction β of the GO/WPU composites. | ||
As show in Fig. 3b, I3 decrease with increasing GO content, indicating a decrease in concentration of free volume in the composites, which is similar to the results of PC/RGO composites reported by Zhong and co-workers.28 This may be interpreted as the reason that the introduction of GO nanosheets with large surface in WPU matrix results in a high-density interfacial region and decrease the concentration of free volume holes.28
The relative free volume fraction (fr) is plotted in Fig. 3c showing that the composites have lower fr as compared to pure WPU. It is seen that fr decreases as a function of GO loading at low concentration (≤0.5 wt%) and increases at high loading, but still lower than that in pure WPU. The fr decreased at low GO loading is due to the effective restriction of chain movement, benefiting from the fully exfoliated state and strong interfacial interaction. The fr increased at high GO loading is due to the little restriction of chain movement, causing by the agglomeration and weak interfacial interaction.28,36 This results quantitative confirmed the results of SEM (Fig. 1c–g), where dense fracture surface was observed for the composite with low load level and loose fracture surface was observed for the composite with high load level.
The interfacial interaction plays an important role in determining the microstructure and properties of the composites.9,10 In the aspect of probe the interfacial interaction, PALS is more powerful than that of FTIR. The intensity of interfacial interaction can be calculated from the results of PALS, but the FTIR can only determine the type of interfacial interaction.27 According to the previous work in the literature,25–28 part of positrons annihilation in the interfacial layers, and the main difference between polymer and nanofiller/polymer composites is the new formed interfacial layer, thus the variation of the second lifetime intensity (I2) can be used to characterize the interfacial interaction in the composites. If there is no interaction between GO and WPU matrix, according to the simple mixture rule, I2 only comes from positron annihilation in GO and WPU, and it should be linear correlation with the GO weight fraction. Actually, the interfacial interaction always exists in the composites, and its intensity changes with the change of filler content. Thus, the interaction parameter β was introduced to probe the interaction intensity between GO filler and WPU matrix, which can be calculated according the following equation:27
 | (5) |
Quantitative description of microstructure (relative free volume fraction and interfacial interaction intensity) was realized for GO/WPU composites with PALS technique in this work, which will benefit for the correlation between microstructure and properties of the GO/WPU composites.
Thermal properties of GO/WPU composites
Glass transition temperature (Tg) is the temperature from glassy state to elastomeric state, which is one of the most important properties of polymer and polymer composites. Differential scanning calorimeter (DSC) was used for the Tg characterization of pure WPU and GO/WPU composite (Fig. 4). As WPU is an amorphous polymer, low Tg was observed for the pure WPU sample (−57.9 °C).38 The incorporation of GO nanosheets to WPU matrix caused the increase of Tg. It is seen that Tg increases as a function of GO loading at low concentration (≤0.5 wt%) and decreases at high loading, but still higher than that of pure WPU.39 This is consistent with the variation of fr with GO content (Fig. 3c), because the Tg is inherently determined by the free volume fraction of the polymer. With a low GO load level, the decrease of fr meaning GO nanosheets decrease the moving space of WPU chain, leading to the increase of Tg. When the loading concentration exceed 0.5 wt%, the increase of fr leading to the decrease of Tg.27,28 The correlation between free volume fraction and Tg was realized by PALS technique, which will benefit the precise regulation of Tg for graphene oxide based polymer composites.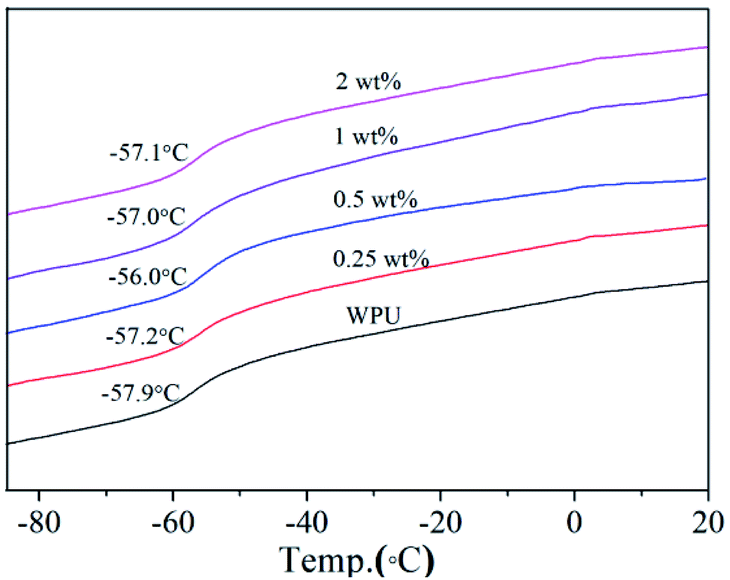 | ||
| Fig. 4 DSC curves of WPU and different GO/WPU composites. | ||
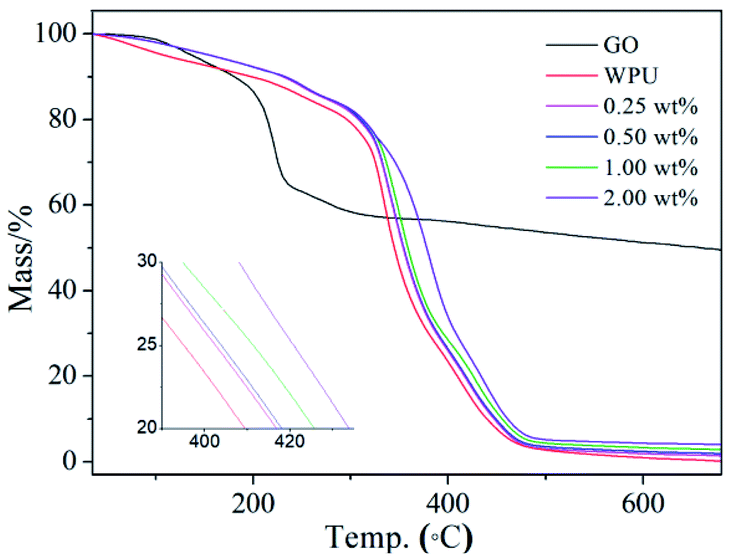
The TG profiles for GO, WPU and GO/WPU composites under nitrogen atmosphere are shown in Fig. 5. GO is thermally unstable and starts to lose weight from 90 °C, which is ascribed to the release of absorbed water. The major mass loss occurred at 220 °C, mainly assigning to the decomposition of the oxygen-contained group such as epoxy and hydroxyl.12,35
 | ||
| Fig. 5 TG curves of GO, WPU and different GO/WPU composites. | ||
As for the GO/WPU composites, the incorporation of GO enhances the thermal stability of WPU. The 50% weight loss was observed at 344 °C for pure WPU, as the increase of GO concentration, the temperature of 50% weight loss increased by 7, 10, 15 and 25 °C for the composites. This improvement in thermal stability could be attributed to the so-called tortuous path effect of GO, which delays the escape of volatile degradation product.40,41
Mechanical properties of GO/WPU composites
The representative stress–strain curves of pure WPU and GO/WPU composites were depicted in Fig. 6, which apparently demonstrates the improvements in the mechanical performance of the GO/WPU. Generally, the incorporation of nanofiller into polymer restricts the mobility of polymer chain and consequently decrease the strain of the composites.42 Interestingly, compared with pure WPU, low GO content (≤0.5 wt%) leads to an increase in the stain of the composites, then the strain shown a consistently decrease with further increased GO content. The possible reason is that the interfacial interaction (Fig. 2b) between GO and WPU is in favor of enhancing the flexibility of the composites.31 As reported in the literature,30 the hydrogen bond can served as sacrificial bond to dissipate energy, leading to the increase of strain at low loading level (≤0.5 wt%).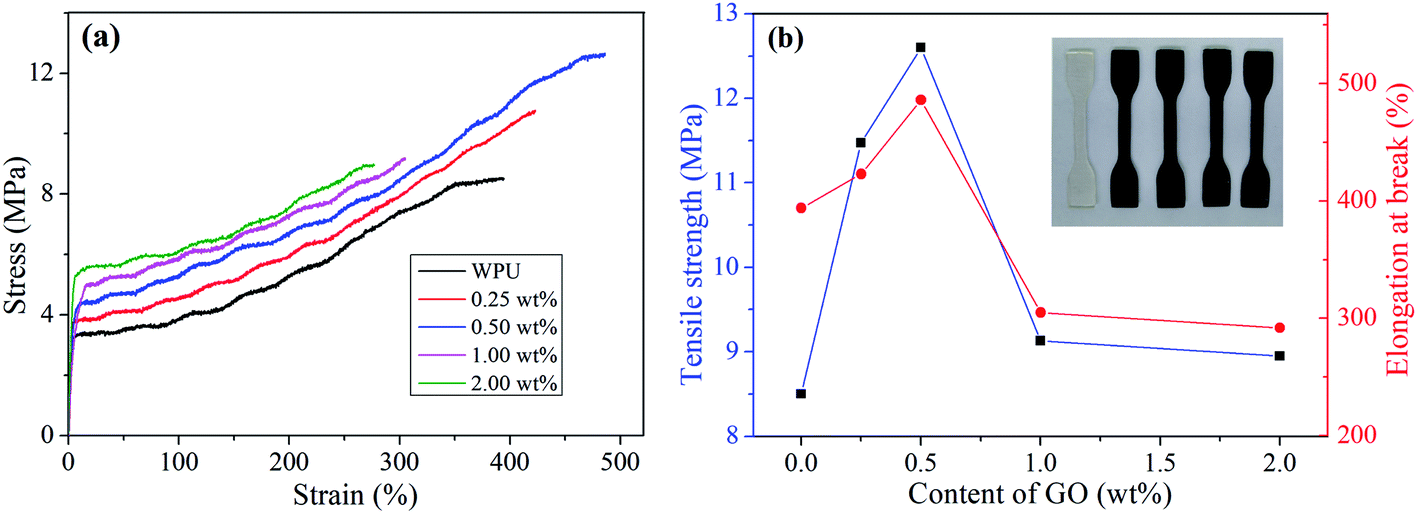 | ||
| Fig. 6 Stress–strain curves (a) and mechanical properties (b) of WPU and different GO/WPU composites. | ||
Compared with the pure WPU, the tensile strength of the composite containing 0.5 wt% GO is increased by 48% from 8.5 to 12.6 MPa. Then the tensile strength is consistently decrease with further increased GO content, but still higher than that of pure WPU. This can be ascribed to the different dispersed state of GO in WPU matrix, GO was fully exfoliated at low loading level leading to the effective dissipation of stress. On the contrary, the aggregation of GO at relative high loading level (>0.5 wt%) leading to a poor dissipation of stress.30,31 This results is consistent with the variation of interaction parameter β with GO content (Fig. 3d), because the tensile strength is related to the interfacial interaction, which can transfer the stress from soft polymer matrix to hard nanofiller. The correlation between interaction parameter and tensile strength was realized by PALS technique, which will benefit the precise regulation of tensile strength for graphene oxide based polymer composites.43
Conclusions
In summary, GO/WPU composites was prepared with a simple casting method, the microstructure of the obtained GO/WPU composites was revealed simultaneously by using qualitative (SEM and FTIR) and quantitative (PALS) method. Quantitative description of microstructure (relative free volume fraction and interfacial interaction intensity) was realized for GO/WPU composites with PALS technique, and correlation between microstructure and properties (glass transition temperature and tensile strength) was established with the PALS results. The variation of glass transition temperature with GO content agree well with the results of fr, and the results of interaction parameter β gives a good explanation of the variation in tensile strength. These results lays a good foundation on the precise regulation of physical properties for high performance graphene based polymer composites. Future work will focused on the quantitative relationship construction between microstructure and properties of the graphene based polymer composites.Experimental section
Materials
Natural flake graphite, sodium nitrate, concentration sulfuric acid, potassium permanganate, hydrogen peroxide, and acetone were purchased from Sinopharm Chemical Reagent Co., Ltd. Poly(butylene adipate) (PBA) diol (1000 g mol−1) was purchased from Qingdao Yutian Chemical Co., Ltd and dried at 120 °C under vacuum for 2 h. Isophorone diisocyanate (IPDI), butylene glycol (BG), dimethylol propionic acid (DMPA), triethylamine (TEA) were purchased from Aladdin Chemical Reagent Co., Ltd.Preparation of WPU dispersion
The WPU dispersion was prepared in a four-necked round-bottom flask, equipped with a mechanical stirrer, dropping funnel, condenser, under a dry nitrogen atmosphere. In a typical procedure, 40.00 g PBA (40 mmol), 1.26 g BG (14 mmol), 18.9 g IPDI (85 mmol) were added to the flask and reacted at 75 °C for 4 h. 2.14 g DMPA (16 mmol) dissolved in 15 mL acetone was added and reacted for another hour. Then, 1.6 g TEA (16 mmol) was added to neutralize the carboxyl group of the prepolymer, 136 g deionized water was dropwised into the flask to obtain a emulsion. Finally, the emulsion was stirred at 40 °C for chain extension reaction within 1 h, WPU dispersion was obtained with remove acetone under vacuum for 30 min, the resulting product with a solid content of 30 wt%.Preparation of GO/WPU composites
The graphene oxide was prepared from a modified Hummers method, which has been reported in our previous work.29,35,44 The obtained GO was redispersed into deionized water to prepare GO dispersion (2 mg mL−1) with ultrasound. An appropriate amount of GO dispersion was added into 8 g WPU dispersion, the mixture of the dispersion was stirred for 2 h. The obtained mixture was poured and dried on a polytetrafluoroethylene plate at 40 °C for 48 h, then dried in a vacuum oven at 60 °C for 12 h to fabricate GO/WPU nanocomposite film.Characterization
Scanning electron microscopy (SEM, VEGA3 TESCAN) were used to examine the morphology of the obtained composites. Transmission electron microscopy (TEM, Philips TECNAI) samples were prepared by dropping the dispersion onto carbon grids. Fourier transform infrared (FTIR) spectra were recorded on an Avatar 360 Nicolet instrument by direct measuring ultrathin film of different sample. The DSC curves were recorded as second heating curves from −100 to 100 °C at a heating rate of 10 °C min−1 and a cooling rate of 10 °C min−1. Thermogravimeter (TG) analysis was performed with a TG-209-F3 (PerkinElmer) under the nitrogen atmosphere at a heating rate of 10 °C min−1 from 30 to 750 °C. The tensile properties of GO/WPU composites were measured by a universal testing machine (Shimadzu AG-IC), at least five samples were tested to obtain average values.Conflicts of interest
There are no conflicts to declare.Acknowledgements
This work was supported by grants from the National Natural Science Foundation of China (51903080), Scientific Research Foundation of Hubei University of Science and Technology (BK202003, 2020-21X16, 2020-21X17, H2019006).References
- R. Tennebroek, H. I. Casteren, R. Swaans, S. Slot, P. J. M. Stals, B. Tuijtelaars and C. Koning, Polym. Int., 2019, 68, 832–842 CrossRef CAS.
- F. Zafar, A. Ghosal, E. Sharmin, R. Chaturvedi and N. Nishat, Prog. Org. Coat., 2019, 131, 259–275 CrossRef CAS.
- Y. Ahmadi and S. Ahmad, Polym. Rev., 2019, 196, 1–41 Search PubMed.
- A. Kausar, Polym-Plast. Technol., 2017, 56, 1468–1486 CrossRef CAS.
- M. A. Kashfipour, N. Mehra and J. H. Zhu, Adv. Compos. Hybrid Mater., 2018, 1, 415–439 CrossRef.
- R. A. Pethrick, Prog. Polym. Sci., 1997, 22, 1–47 CrossRef CAS.
- G. K. Zhao, X. M. Li, M. Huang, Z. Zhen, Y. J. Zhong, Q. Chen, X. L. Zhao, Y. J. He, R. R. Hu, T. T. Yang, R. J. Zhang, C. L. Li, J. Kong, J. B. Xu, R. S. Ruoff and H. W. Zhu, Chem. Soc. Rev., 2017, 46, 4417–4449 RSC.
- X. B. Han, J. Gao, T. Chen and Y. Zhao, Chem. Pap., 2020, 74, 757–765 CrossRef CAS.
- S. S. Gong, H. Ni, L. Jiang and Q. F. Cheng, Mater. Today, 2017, 20, 210–219 CrossRef CAS.
- J. S. Peng and Q. F. Cheng, Adv. Mater., 2017, 29, 1702959 CrossRef.
- F. Q. Weng, J. Yin, F. Bao, J. Gao, R. Ma, S. Yan, Y. P. Liu and H. Ding, Int. J. Polym. Mater., 2018, 67, 307–312 CrossRef CAS.
- J. Gao, F. Bao, Q. X. Wu, R. Ma, X. B. Han, D. P. Jin, K. Y. Chen, J. Y. He, Z. F. Guo and C. J. Yan, Mater. Today Commun., 2016, 7, 149–154 CrossRef CAS.
- J. G. Wen, W. M. Geng, H. Z. Geng, H. Zhao, L. C. Jing, X. T. Yuan, Y. Tian, T. Wang, Y. J. Ning and L. Wu, ACS Omega, 2019, 4, 20265–20274 CrossRef CAS.
- Z. X. Chen and H. B. Lu, J. Mater. Chem., 2012, 22, 12479–12490 RSC.
- F. Y. Zhang, W. Q. Liu, L. Y. Liang, S. Wang, H. Y. Shi, Y. K. Xie, M. P. Yang and K. Pi, Colloids Surf., A, 2020, 591, 124565 CrossRef CAS.
- X. P. Zhang, J. Wen, B. S. Hu, J. F. Yuan, J. Wang, L. Zhu and M. W. Pan, Nanotechnolgy, 2020, 31, 205708 CrossRef.
- Y. Ahmadi and S. Ahmad, Prog. Org. Coat., 2019, 127, 168–180 CrossRef CAS.
- S. J. Wan, Y. C. Li, J. S. Peng, H. Hu, Q. F. Cheng and L. Jiang, ACS Nano, 2015, 9, 708–714 CrossRef CAS.
- Y. Y. Li, Z. Z. Yang, H. X. Qiu, Y. G. Dai, Q. B. Zheng, J. Li and J. H. Yang, J. Mater. Chem. A, 2014, 2, 14139–14145 RSC.
- H. Kim, Y. Miura and C. W. Macosko, Chem. Mater., 2010, 22, 3441–3450 CrossRef CAS.
- S. K. Sharma and P. K. Pujari, Prog. Polym. Sci., 2017, 75, 31–47 CrossRef CAS.
- J. J. Fan, W. Zhou, Q. Wang, Z. J. Chu, L. Q. Yang, L. Yang, J. Sun, L. Zhao, J. M. Xu, Y. J. Liang and Z. Q. Chen, J. Membrane Sci., 2018, 549, 581–587 CrossRef CAS.
- R. Zaleski, A. Kierys and M. Gorgol, Phys. Chem. Chem. Phys., 2017, 19, 10009–10019 RSC.
- W. Gong, Y. Y. Mai, Y. F. Zhou, N. Qi, B. Wang and D. Y. Yan, Macromolecules, 2005, 38, 9644–9649 CrossRef CAS.
- W. Zhou, B. Wang, Y. P. Zheng, Y. C. Zhu, J. J. Wang and N. Qi, ChemPhysChem, 2008, 9, 1046–1052 CrossRef CAS.
- S. K. Sharma, J. Prakash, K. Sudarshan, P. Maheshwari, D. Sathiyamoorthy and P. K. Pujari, Phys. Chem. Chem. Phys., 2012, 14, 10972–10978 RSC.
- G. B. Xue, J. Zhong, S. Gao and B. Wang, Carbon, 2016, 96, 871–878 CrossRef CAS.
- J. Zhong, Y. Ding, F. Gao, J. Wen, J. Y. Zhou, W. B. Zheng, L. Shen, C. Q. Fu and B. Wang, J. Appl. Polym. Sci., 2019, 136, 48207 CrossRef.
- J. Gao, F. Bao, L. L. Feng, K. Y. Shen, Q. D. Zhu, D. F. Wang, T. Chen, R. Ma and C. J. Yan, RSC Adv., 2011, 1, 1737–1744 RSC.
- M. J. Palmeri, K. W. Putz and L. C. Brinson, ACS Nano, 2010, 4, 4256–4264 CrossRef CAS.
- Z. H. Tang, Y. D. Lei, B. C. Guo, L. Q. Zhang and D. M. Jia, Polymer, 2012, 53, 673–680 CrossRef CAS.
- F. Zhong, Y. He, P. Q. Wang, C. L. Chen, Y. Lin, Y. Q. Wu and J. Y. Chen, Appl. Surf. Sci., 2019, 488, 801–812 CrossRef CAS.
- Z. H. Zhao, L. Guo, L. Feng, H. Lu, Y. Xu, J. N. Wang, B. Xiang and X. F. Zou, Eur. Polym. J., 2019, 120, 109249 CrossRef CAS.
- N. Nouri, M. Rezaei, R. L. Sofla and A. Babaie, Compos. Sci. Technol., 2020, 194, 108170 CrossRef CAS.
- J. Gao, R. Ma, K. Y. Shen, J. Yin, F. Bao, C. J. Yan, T. Chen, G. Z. Wang, X. Liu, X. Zhang and D. B. Zhang, Polym-Plast. Technol., 2013, 52, 553–557 CrossRef CAS.
- P. N. Patil, K. Sudarshan, S. K. Sharma, P. Maheshwari, S. K. Rath, M. Patri and P. K. Pujari, ChemPhysChem, 2012, 13, 3916–3922 CrossRef CAS.
- W. Gong, D. N. He, J. L. Tao, P. F. Zhao, L. X. Kong, Y. Y. Luo, Z. Peng and H. Wang, RSC Adv., 2015, 5, 88908–88914 RSC.
- Y. T. Han, Z. Cheng, W. Dong, F. Zhang and Z. Y. Xin, J. Thermoplast. Compos., 2016, 30, 107–120 Search PubMed.
- S. H. Yoon, J. H. Park, E. Y. Kim and B. K. Kim, Colloid Polym. Sci., 2011, 289, 1809–1814 CrossRef CAS.
- X. Wang, W. Y. Xing, L. Song, H. Y. Yang, Y. Hu and G. H. Yeoh, Surf. Coat. Tech., 2012, 206, 4778–4784 CrossRef CAS.
- D. Y. Cai, J. Jin, K. Yusoh, R. Rafiq and M. Song, Compos. Sci. Technol., 2012, 72, 702–707 CrossRef CAS.
- S. K. Sharma, J. Prakash, K. Sudarshan, D. Sen, S. Mazumder and P. K. Pujari, Macromolecules, 2015, 48, 5706–5713 CrossRef CAS.
- R. G. Lecaros, M. E. Bismonte, B. T. Doma, W. S. Hung, C. C. Hu, H. A. Tsai, S. H. Huang, K. R. Lee and J. Y. Lai, Carbon, 2020, 162, 318–327 CrossRef CAS.
- J. Gao, F. Bao, Q. D. Zhu, Z. F. Tan, T. Chen, H. H. Cai, C. Zhao, Q. X. Cheng, Y. D. Yang and R. Ma, Polym. Chem., 2013, 4, 1672–1679 RSC.
| This journal is © The Royal Society of Chemistry 2020 |