
 Open Access Article
 This Open Access Article is licensed under a Creative Commons Attribution-Non Commercial 3.0 Unported Licence
Carbon dots for effective photodynamic inactivation of virus
Xiuli
Dong
a,
Rasheena
Edmondson
b,
Fan
Yang
 c,
Yongan
Tang
d,
Ping
Wang
c,
Ya-Ping
Sun
*c and
Liju
Yang
*a
c,
Yongan
Tang
d,
Ping
Wang
c,
Ya-Ping
Sun
*c and
Liju
Yang
*a
aDepartment of Pharmaceutical Sciences, Biomanufacturing Research Institute and Technology Enterprise (BRITE), North Carolina Central University, Durham, NC 27707, USA. E-mail: lyang@nccu.edu; Tel: +1-919-530-6705 Tel: +1-919-530-6704
bDepartment of Biology, Bennett College, Greensboro, NC 27401, USA
cDepartment of Chemistry, Laboratory for Emerging Materials and Technology, Clemson University, Clemson, SC 29634, USA. E-mail: syaping@clemson.edu; Tel: +1-864-656-5026
dDepartment of Mathematics and Physics, North Carolina Central University, Durham, NC 27707, USA
First published on 14th September 2020
Abstract
The antiviral function of carbon dots (CDots) with visible light exposure was evaluated, for which the model bacteriophages MS2 as a surrogate of small RNA viruses were used. The results show clearly that the visible light-activated CDots are highly effective in diminishing the infectivity of MS2 in both low and high titer samples to the host E. coli cells, and the antiviral effects are dot concentration- and treatment time-dependent. The action of CDots apparently causes no significant damage to the structural integrity and morphology of the MS2 phage or the breakdown of the capsid proteins, but does result in the protein carbonylation (a commonly used indicator for protein oxidation) and the degradation of viral genomic RNA. Mechanistically the results may be understood in the framework of photodynamic effects that are associated with the unique excited state properties and processes of CDots. Opportunities for potentially broad applications of CDots coupled with visible/natural light in the prevention and control of viral transmission and spread are highlighted and discussed.
1. Introduction
Infectious diseases continue to affect hundreds of millions of people each year with serious health outcomes, accounting for ∼20% global mortality, among which about one-third are caused by viral infections.1 Influenza or “the flu”, HIV (human immunodeficiency virus), and herpes are some of the many viruses that kill millions of people every year. In addition, new viruses, such as Ebola, SARS, and SARS-CoV-2, are continuously emerging and cause serious public health problems. For prevention of viral infections, vaccination is known as the best practice, but only a limited number of vaccines are available. For many viruses, including HIV, noroviruses, and other newly emerged viruses, there is presently no vaccine. Also, constant antigenic shift in some viruses creates difficulties for vaccine development. In reality, the control and prevention of viral transmission and spread largely rely on effective hygiene and sanitation practices, though other tools are also being explored to help the control of viral infections.2,3 Many traditional disinfection agents have been used for such purposes, but recently various nanomaterials of antiviral functions have been explored with very promising outcomes.In the early exploration for inactivation of viruses or virus-like particles (VLPs), various metal and metal oxide nanoparticles (NPs), including NPs of silver,4,5 copper iodide,5 and titanium dioxide6 have been used. Their small sizes, high surface-to-volume ratio,7 ability of direct interaction with viral capsid proteins,8 and/or other unique properties of the materials at nanoscale have contributed to their observed antiviral activities, making their use a more popular alternative to other physical and chemical antiviral strategies. Moreover, the coupling of nanomaterials with photon energies for photodynamic inactivation (PDI) of microbials has also attracted much attention. In the PDI, a popular approach has been the use of UV light to illuminate on selected NPs such as colloidal TiO2 to generate reactive oxygen species (ROS), including singlet molecular oxygen, superoxide and hydroxyl radicals, to kill pathogenic bacteria or viruses.9 Since UV light is hazardous for broader applications in living environment, various modifications to TiO2 NPs have been made to extend absorption into the visible.10–12 Similarly, the uses of gold NPs with organic dyes,13–15 cationic fullerenes,16 and semiconductor quantum dots (QDs)17–19 have been explored in the development of antimicrobial agents that can be excited by visible photons. More recently, carbon dots (CDots), which are small carbon NPs with particle surface functionalized by organic molecules,20–31 have been found and demonstrated for their strong visible/natural light-activated antimicrobial functions.32,33
CDots may be considered as a special kind of “core–shell” nanostructures, each with a small carbon nanoparticle core (mostly less than 10 nm in diameter) and a thin shell of soft materials (the organic or biological surface molecules) (Fig. 1). Their broad optical absorptions over the entire visible spectral range enable their efficient visible/natural light activation.21,23 Upon photoexcitation of CDots, there are efficient charge separations for the generation of separated electrons and holes, which are trapped at various surface defect sites in the dots and likely participate directly in the observed antimicrobial activities.34,35 As widely agreed,20,21,23–31,35 the radiative recombination of the electrons and holes results in the formation of emissive excited states, which are responsible for the famous bright and colorful fluorescence emissions of CDots and also contribute to the photodynamic antimicrobial functions. The antimicrobial activities of CDots are known to correlate with their surface functionality, surface charge, fluorescence emission quantum yields, and other structural/material characteristics.32,33,36
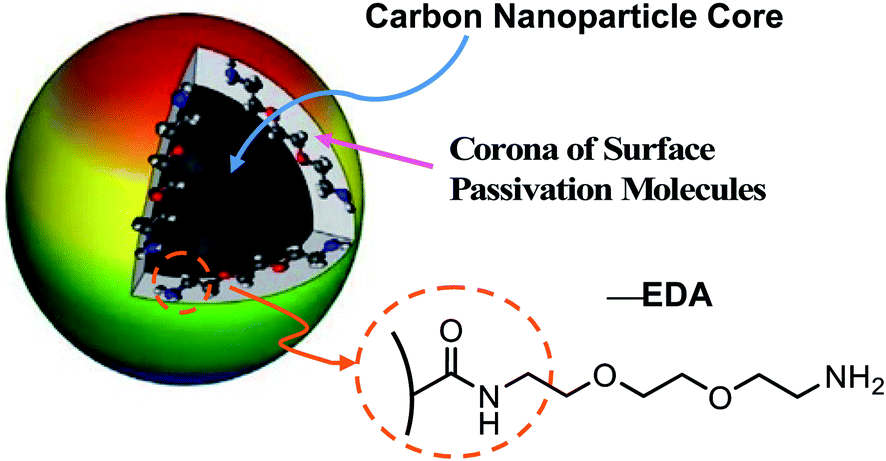 | ||
| Fig. 1 A cartoon illustration on the structure of CDots in general, with the carbon nanoparticle surface functionalization by EDA molecules highlighted for EDA–CDots. | ||
Here, we report a study of visible light-activated CDots for effective inactivation of virus and an exploration on mechanistic implications of the experimental results using bacteriophage MS2 as a model (a surrogate of a number of small RNA viruses such as norovirus, Ebola virus, Marburg virus). In the study, the CDots with 2,2′-(ethylenedioxy)bis(ethylamine) (EDA) for the carbon nanoparticle surface functionalization (thus EDA–CDots, Fig. 1) were selected for their being chemically and structurally well characterized37 and effective in antibacterial activities against multiple laboratory model bacteria,32,33,36,38 as well as exhibiting significant antiviral potential in the initial evaluation of their inhibitory effect on the binding of norovirus VLPs to host cell receptor.39 The use of bacteriophage MS2 in this study was to further reveal the effect of CDots on viral infectivity and viral genome, and to explore mechanistic insights into the action of CDots on the virus, both of which would not be possible with the VLPs.
2. Results and discussion
2.1 Bacteriophage infection and antiviral strategies
The process of viral infection to a host cell consists of multiple steps, generally including viral attachment, penetration (viral RNA/DNA entry), replication, assembly, release, and host cell lysis, but the details in these steps differ greatly between infections by different virus species.40,41 The viral attachment to a host cell is achieved when specific proteins on the viral capsid or viral envelope bind to specific host receptor proteins on the host cell surface. After attachment, animal virions enter into the host cell through receptor-mediated endocytosis or membrane fusion,42,43 while viruses enter into plant cells and fungi cells only after trauma to the cell walls.41,44 The general process of bacteriophage infection to a host bacterial cell is shown in Fig. 2. Generally bacteriophages use specialized surface receptor-binding proteins to interact with and adhere to their specific cognate host receptors, and then the phages use various mechanisms to breach the bacterial cell wall and inject their genome into the host bacterial cell, leaving the empty phage capsid outside the cell.45 Once the viral genome is uncoated in the host cell, the replication starts and the transcription or translation of the viral genome initiates. After the synthesis of viral genome and proteins, the proteins are packaged with the newly replicated viral genomes to assemble new virions ready to be released from the host cells, resulting in the lysis of infected host cells.45 However, in some other cases, viruses undergo a lysogenic cycle where the viral genome is incorporated by genetic recombination into a specific site in the host's chromosome.41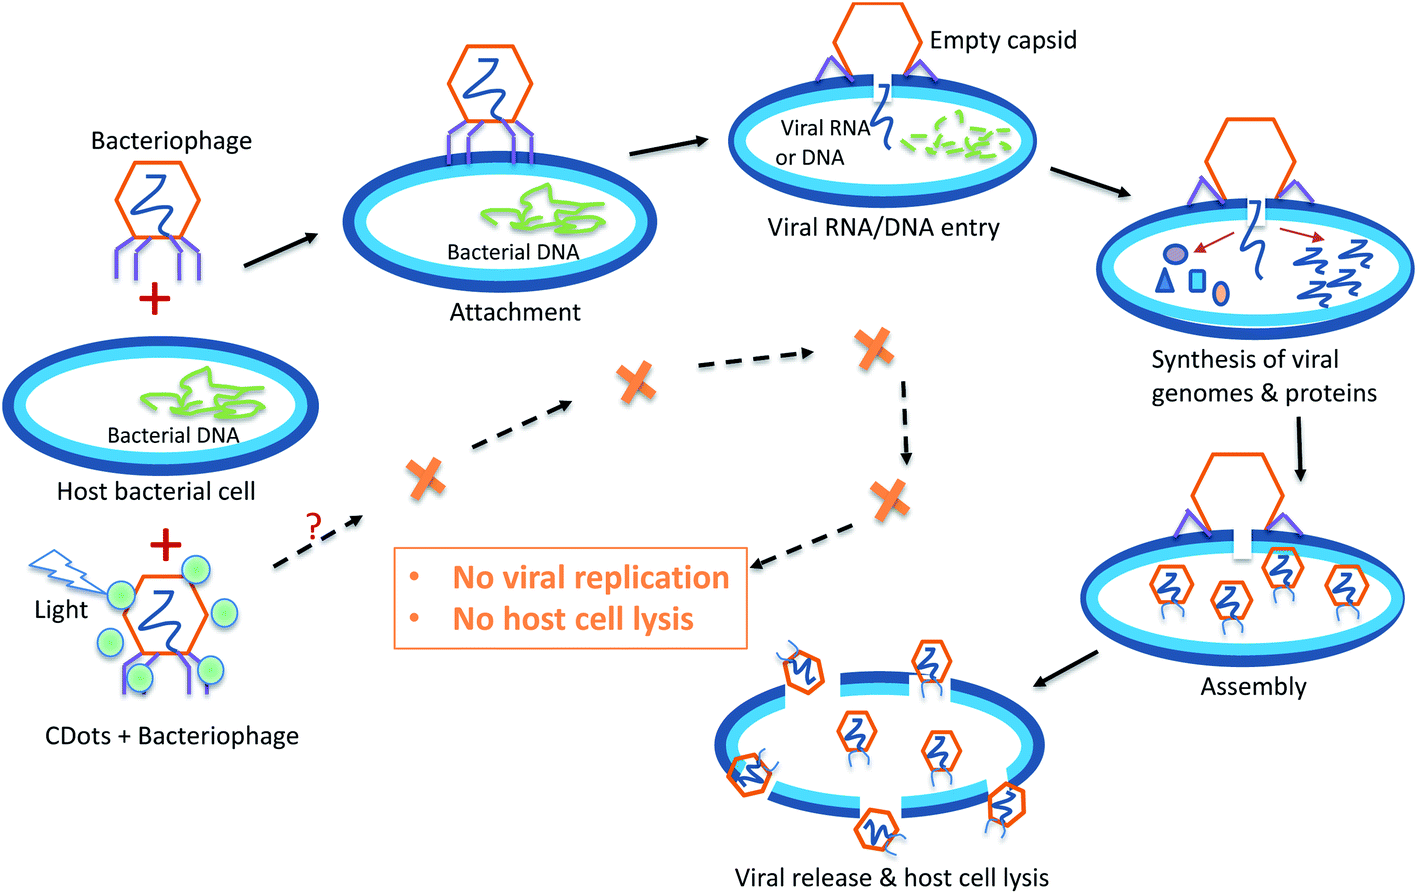 | ||
| Fig. 2 The general process of bacteriophage infection to its host cells, and the expected outcome of PDI antiviral function of CDots. | ||
Many antiviral agents/drugs are designed to target either viral proteins or host factors. Host-targeting antivirals aim at the host proteins that are involved in the viral life cycle, so as to regulate the function of the immune system or other cellular processes in host cells.46 More relevant to the study reported here in terms of antiviral strategies, the virus-targeting antivirals can function directly or indirectly to inhibit the functions of viral proteins, mostly enzymatic activities, or to block viral replication machinery. Among direct virus-targeting antivirals may be inhibitors of virus attachment, entry, protease, polymerase, integrase, methyltranserase, helicase, etc.46 Other direct antiviral methods may physically destroy/break viral capsid, such as high pressure, radiation, and the action of some nanoparticles.47–50 The photodynamic inactivation (PDI) as an antiviral approach exploits the function of photosensitizers under light illumination to generate ROS to attack viral envelope lipids, core proteins, capsid, and nucleic acid, leading to the loss of virus infectivity.51 CDots due to their unique photoexcited state properties and processes represent a new class of particularly effective PDI agents, as already demonstrated in their visible/natural light-activated actions against bacterial cells, are expected to be similarly effective antiviral PDI agents (Fig. 2).
2.2 PDI with CDots to diminish viral infectivity
EDA–CDots (Fig. 1) were prepared and characterized by following the experimental protocols reported previously.37,52 These dots are 5–10 nm in diameter according to microscopy characterization results (Fig. 3, inset). They are readily soluble in aqueous media, and the resulting aqueous solution is strongly absorptive in the visible spectrum (Fig. 3) for photoexcitation with broad-band visible light.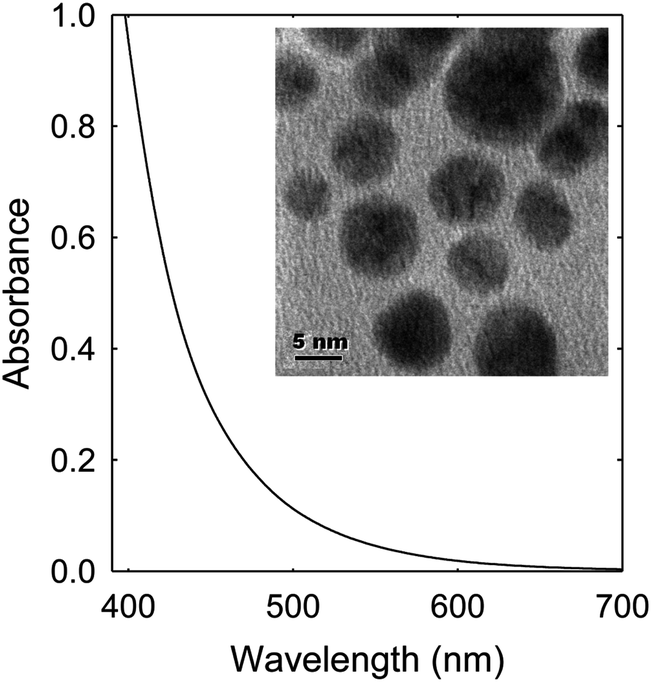 | ||
| Fig. 3 The absorption spectrum of EDA–CDots in aqueous solution. Inset: A TEM image of EDA–CDots. | ||
The antiviral activity of EDA–CDots was evaluated under different conditions. The initial experiment was on MS2 samples containing low virus titers (∼50–60 PFU per mL). The samples were treated with EDA–CDots at different concentrations ranging from 1 to 20 μg mL−1 with visible light illumination (from 36 W light box) or in the dark for 1 h. The infectivity of treated and untreated MS2 was evaluated by the plaque assay. Fig. 4A shows the percentage reduction in MS2 plaque numbers upon 1 h treatment with EDA–CDots under visible light and in dark. The viral titer was significantly reduced with the increasing concentration of EDA–CDots in the treatment under visible light. Specifically, the viral titer reduced to 92.3, 63.2, 59.4, 39.4, 25.8 and 20.6% of the starting viral titer with 1, 1.5, 2.5, 5, 10, and 20 μg mL−1 EDA–CDots, respectively, while the corresponding treatments in dark did not cause significant reduction in viral titer. The results confirmed that MS2 phages lost their infectivity to host cells upon the treatment with EDA–CDots under visible light in a dot concentration-dependent manner, but not the treatment in dark.
 | ||
| Fig. 4 (A) Percentage reduction in virus titers when MS2 samples containing low virus titers (<100 PFU per mL) were treated with different concentrations of EDA–CDots under visible light for 1 h. (B) Reduction in virus titers when MS2 samples containing high virus titers (∼108 PFU per mL) were treated with 20 μg mL−1 EDA–CDots under visible light for different times. (C) Images of the representative plates of MS2 plaque forming units on the lawn of E. coli C3000 after the MS2 samples were treated with 20 μg mL−1 EDA–CDots under visible light for 2, 6, and 16 h. (D) The growth curves of E. coli C3000 when they were infected with untreated and CDots-treated MS2 samples. | ||
Next, MS2 samples containing higher virus titers were tested to see how well CDots were able to inactivate the viruses at high viral titers for more practical opportunities. In the experiments, MS2 phage samples of ∼108 PFU per mL were treated with 20 μg mL−1 EDA–CDots for different time periods ranging from 2 to 24 h under the visible light. Fig. 4B shows the viral titers of the samples at different treatment time points, as determined by the plaque assay, along with controls without CDots treatment. The results show that EDA–CDots were effective in inactivating MS2 phages in the high virus titer samples. With 20 μg mL−1 EDA–CDots, the MS2 phages in the samples were completely inactivated (>8![[thin space (1/6-em)]](https://www.rsc.org/images/entities/char_2009.gif) log reduction in viral titer) with 24 h treatment, or >6log reduction and approximately 1log reduction (90% reduction) of virus with 16 h and 2 h treatments, respectively. The results indicated that CDots' photo-inactivation of MS2 phages was in a time-dependent manner, as prolonged treatment time could significantly increase the inactivation effectiveness. Fig. 4C shows the representative plates of the plaque forming units (PFU) of MS2 phage on the lawn of E. coli strain C3000, after the MS2 samples were treated with 20 μg mL−1 EDA–CDots under visible light for 2, 6, and 16 h (all plated upon 10−3 dilutions). There was an obvious decrease of PFU in the samples with increasing treatment time from 2 h to 6 h, and the samples with 16 h treatment did not form PFU. The results show that CDots were capable of inactivating MS2 phages in high virus titer samples, suggesting excellent potential for practical applications.
log reduction in viral titer) with 24 h treatment, or >6log reduction and approximately 1log reduction (90% reduction) of virus with 16 h and 2 h treatments, respectively. The results indicated that CDots' photo-inactivation of MS2 phages was in a time-dependent manner, as prolonged treatment time could significantly increase the inactivation effectiveness. Fig. 4C shows the representative plates of the plaque forming units (PFU) of MS2 phage on the lawn of E. coli strain C3000, after the MS2 samples were treated with 20 μg mL−1 EDA–CDots under visible light for 2, 6, and 16 h (all plated upon 10−3 dilutions). There was an obvious decrease of PFU in the samples with increasing treatment time from 2 h to 6 h, and the samples with 16 h treatment did not form PFU. The results show that CDots were capable of inactivating MS2 phages in high virus titer samples, suggesting excellent potential for practical applications.
In a separated experiment, the infectivity of MS2 phages with and without the CDots treatment to the host E. coli C3000 cells in suspensions was examined. The tests were performed by monitoring the growth curves of E. coli C3000 cells that were infected with CDots treated and untreated MS2 phages. As shown in Fig. 4D, E. coli C3000 cells without MS2 exhibited a normal growth curve consisting of lag phase, log phase and stationary phase, with the optical density (OD) value reaching ∼0.66 at 5 h. Untreated MS2 were able to infect E. coli cells and cause cell lysis over time. Although an increasing rate of growth of E. coli was observed until the time point of ∼2.7 h, after that, the OD started to decline and continued progressively until reaching a plateau (OD at ∼0.17), indicating the onset of cell lysis due to the infection of MS2 to the E. coli cells. The MS2 treated with 5 μg mL−1 EDA–CDots for 16 h under visible light induced E. coli cell lysis at a later time point of ∼3.3 h, and the decline in OD continued at a slower rate than that with untreated MS2, until reaching the OD of ∼0.41 at 5 h, indicating reduced infectivity of the treated MS2 to E. coli cells. However, the MS2 treated with 20 μg mL−1 EDA–CDots for 16 h did not show a decline in OD within the experimental time, and the growth curve of E. coli was the same as the control with uninfected E. coli cells, suggesting that the treated MS2 phages had lost their infectivity to E. coli cells. In the same experiments, the corresponding MS2 samples treated with CDots in dark also did not cause E. coli cell lysis, namely that light exposure in the CDots treatment was necessary to reducing the infectivity of MS2. On the effect of CDots concentrations in the treatments, the growths of E. coli C3000 cells infected with MS2 phages that were treated with 0, 5, 20, 30, 40, and 50 μg mL−1 CDots under visible light for 1 h were examined. The cell lysis apparently decreased with the increasing CDots concentration used in the treatment of MS2 phages, consistent with more MS2 phages losing their infectivity. However, for the effect of treatment time at a constant CDots concentration, 1 h vs. 16 h, the longer time was obviously more effective in inactivating MS2, as expected. Even at a high CDots concentration like 50 μg mL−1, the 1 h treatment could not completely inactivate the MS2 phages. Nevertheless, these results did consistently confirm that CDots coupled with visible light were effective for inactivating MS2 phages, making them lose their infectivity to host cells, and that the antiviral activity of CDots was dots concentration- and treatment time-dependent.
2.3 PDI damages to the integrity of MS2 phage, capsid proteins, and viral genomic RNA
MS2 phages treated with CDots under visible light and in dark, as well as the untreated phages were examined using TEM (Fig. 5A–C). Surprisingly, the CDots treated MS2 phages remained intact without obvious morphologic changes according to the TEM imaging, comparable to the untreated ones or those treated with CDots in dark. On the viral structural integrity, this observation is consistent with what was previously observed in the study of human norovirus virus-like particles (VLPs) treated with CDots, in which the VLPs maintained their morphology after CDots treatment despite of the loss of their binding capability to host receptors.39 This is also similar to what was found in the use of CDots for PDI against bacteria, in which the bacterial cells photodynamically inactivated by CDots also remained intact.53,54 However, the outcomes were significantly different by the action of many metal or metal oxide NPs and carbon nanotubes, in which physical damages to cell membrane or viral capsids were observed.47,48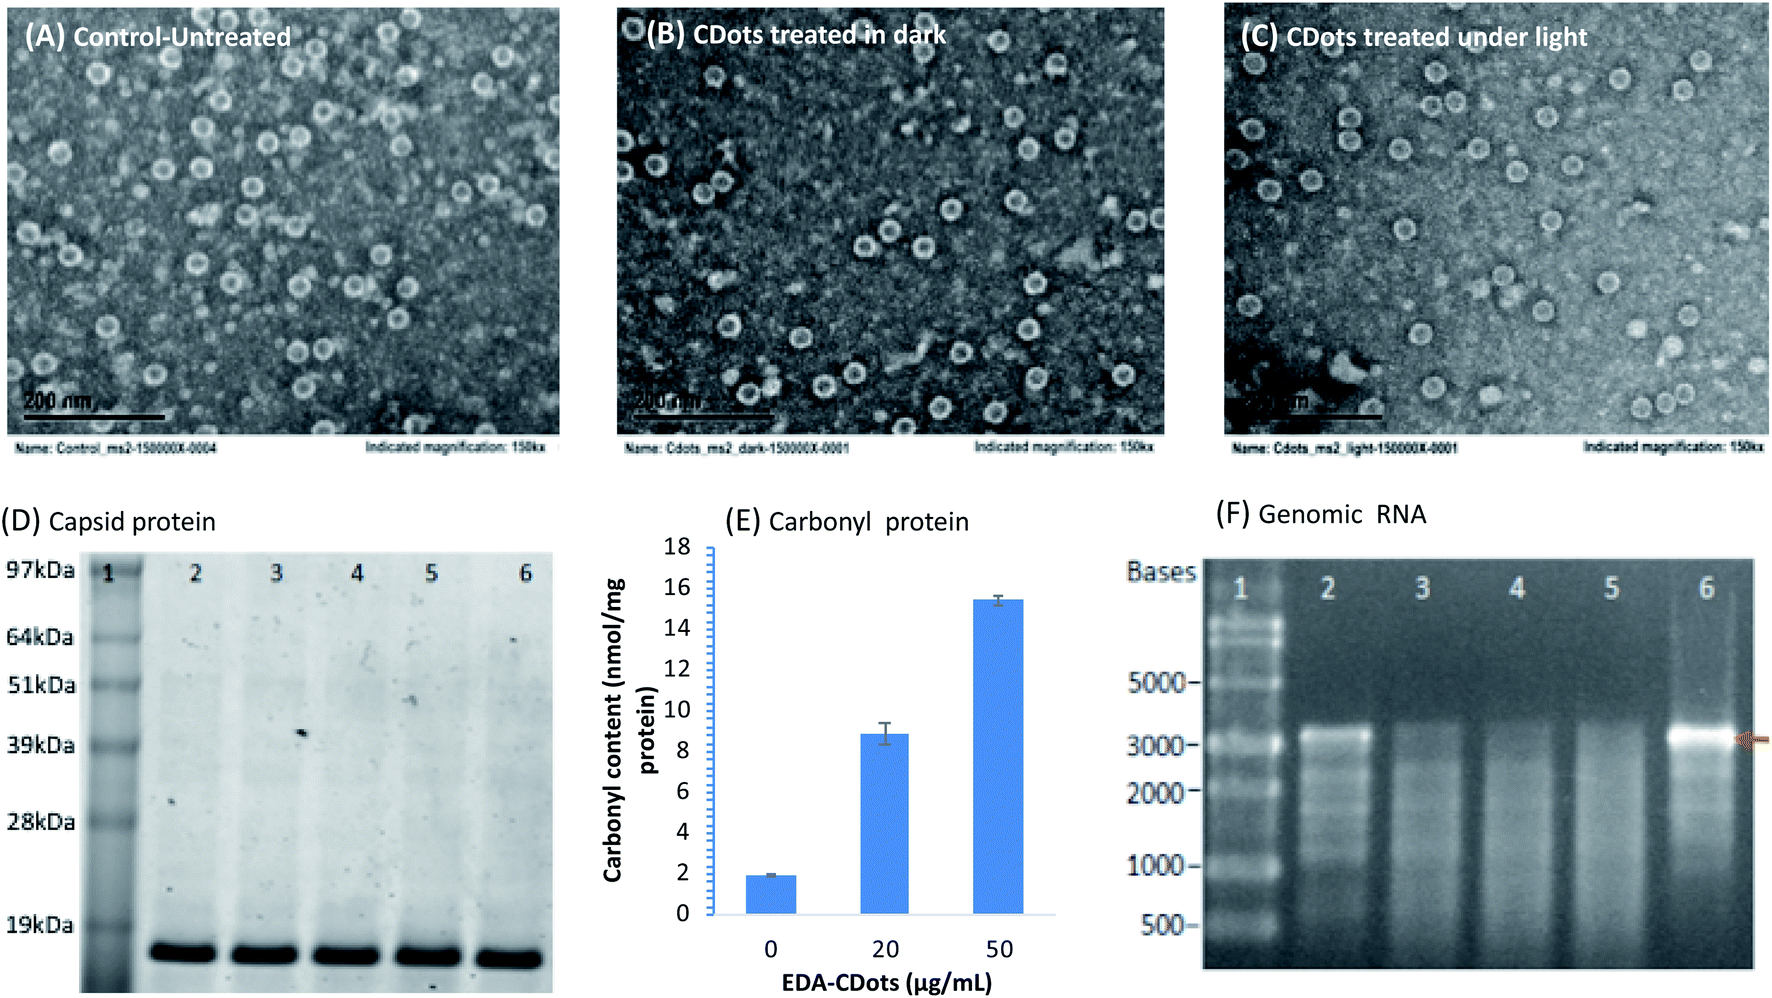 | ||
| Fig. 5 TEM images of MS2 phages (A) untreated, (B) treated with CDots in dark, and (C) treated with CDots under visible light. (D) Image of SDS-PAGE gel of 13.7 KDa MS2 coat proteins in CDots treated MS2 phages. Lane 1: SeeBlue Plus2 Pre-stained Protein Standard (Invitrogen, Carlsbad, CA); lane 2–5: protein from MS2 phages treated with 0, 10, 20, and 50 μg mL−1 CDots under light for 16 h; and lane 6: proteins from freshly thawed MS2 phages without CDots treatment. (E) The carbonyl contents in proteins from MS2 phages that were treated with 20 and 50 μg mL−1 EDA–CDots under visible light illumination for 2 h, along with those of the untreated controls. (F) Image of agarose gel electrophoresis of RNA from CDots treated MS2 phages. Lane 1: ssRNA ladder; lane 2–5: RNA from phages treated with 0, 5, 10, and 20 μg mL−1 CDots under light for 16 h; and lane 6: RNA isolated from freshly thawed MS2 phages without the CDots treatment. | ||
Next, the integrity of phage capsid protein was examined using SDS PAGE gel (Fig. 5D). The MS2 capsid consists of 2 structural proteins: 178 copies of coat protein (∼13.7 kDa) and 1 copy of A-protein (∼44 kDa).55 As shown in Fig. 5D, the bands corresponding to 13.7 kDa were the coat proteins from MS2 phages that were treated with 0, 10, 20, and 50 μg mL−1 CDots under visible light for 16 h, showing no obvious difference in the band intensity among the MS2 samples treated with different concentrations of CDots, and the controls. Due to the low copy number of A-protein, it was undetectable on the SDS PAGE gel. The results suggest that the CDots treatment at tested concentrations did not break down the coat proteins in the capsid of MS2 phages, consistent with the intact morphology of MS2 observed in TEM imaging.
To further assess the consequence at the protein level in MS2 phages upon the CDots treatment with visible light, the oxidation of protein was examined. Proteins have often been described as major targets for oxidative modifications, with the formation of protein carbonyls being among the most prevalent oxidative lesions of proteins.56 In fact, protein carbonyls are commonly used as a biomarker to measure oxidative stress in vivo for biological samples.57–59 In this study, the carbonyl formation in CDots treated MS2 phages was probed and analyzed. Fig. 5E shows the carbonyl contents in MS2 phages that were treated with 20 and 50 μg mL−1 EDA–CDots under visible light illumination for 2 h, along with those of the controls without CDots treatment. The carbonyl contents were 1.9, 8.9, and 15.4 nmol mg−1 protein in the MS2 phages treated with 0, 20, and 50 μg mL−1 CDots, respectively, corresponding to 3.6 and 7.1 fold increases in the treated MS2 phages. Carbonylation often causes major changes in protein structure and function, including unfolding and/or aggregation.56,60 It has been reported that changes to host receptor recognition sites on the virus capsid could inhibit host receptor attachment, thereby resulting in its inability to infect the host cell.55 Although MS2 phages and their coat proteins apparently remained intact upon the CDots treatment with visible light, there was oxidation of the capsid proteins by the photo-generated ROS during treatment, resulting in the observed high level of protein carbonylation, which could lead to structural changes/dysfunction in host receptor recognition sites on the capsid proteins, thus responsible for the loss of their infectivity.
Further examined was the degradation of the genomic RNA in MS2 phages due to the CDots treatment with visible light. Experimentally, the total RNA from the CDots-treated MS2 phages was isolated and analyzed on agarose gel after electrophoresis (Fig. 5F). The MS2 genome is comprised of 3569 nucleotides (nt) of single-stranded RNA, consisting of 1487 nt mat gene, 510 nt cp gene, 295 nt lys gene, and 2055 nt rep gene, while lys gene overlaps with both the 3′-end of the upstream cp gene and the 5′-end of the rep downstream rep gene.61,62 As shown in Fig. 5F, the fresh MS2 samples and the controls (without CDots but processed the same as all other samples) showed a clear band at size of ∼3569 nt, corresponding to the total genomic RNA of MS2. However, all the CDots treated MS2 samples did not show the clear band of their total genomic RNA, indicating the degradation of genomic RNA due to the treatment. In fact, the extent of degradation increased with the increasing CDots concentrations (from 5, 10 to 20 μg mL−1) used in the treatment with visible light.
The results above show that CDots could readily be activated by visible light to effectively diminish the infectivity of MS2 phages, but not at all with the same CDots treatment in dark. The former apparently oxidized the capsid proteins of MS2, thus most likely disabled the viral recognition/binding ability to the host cells, and also degraded the viral genomic RNA, though without breaking apart the viral particles. To the best of our knowledge, this is apparently the first demonstration on the potent PDI actions of CDots under visible light for effectively diminishing viral infectivity. The observed high performances of CDots justify these simple carbon nanomaterials as an extremely promising platform in the development of countermeasures for the control and prevention of viral transmission/spread. Beyond the high performances, the CDots platform also offers other major advantages, CDots have higher absorptivity in visible light wavelength than traditional organic dye photosensitizers, and more efficient PDI due to the generation of highly reactive redox pairs beyond the traditional ROS in the light activation processes.63 Especially with their known benign and nontoxic nature,64–66 CDots offer excellent opportunities for broad applications in many healthcare settings and human living environments.
2.4 Mechanistic issues/implications of the PDI diminishing viral infectivity
The results presented above suggest the necessity of visible light activation in CDots' antiviral function, pointing to a similar photodynamic inactivation (PDI) scheme to what has been adopted for the observed antibacterial activities of CDots with visible/natural light illumination.32–34 The potent PDI function of CDots could be attributed to their unique photoexcited state properties and processes.34,35As illustrated in Fig. 6, the photoexcitation of CDots drives the initial ultrafast charge separation to form charge separated species, which are electrons and holes trapped at various defect sites. These are highly reactive species, similar to or even more reactive than the classical ROS by organic dyes via photodynamic effects. Their recombination results in the formation of emissive excited states (Fig. 6), which are not only responsible for the observed bright and colorful fluorescence emissions but also capable of the same organic dye-like ROS generation. The collective actions of the initially formed charged separated species and the subsequently generated ROS make the PDI of CDots particularly effective and efficient, as made evident by the already reported excellent antibacterial outcomes.34,35 The same PDI framework may be applicable to the observed effective antiviral action of CDots under visible-light illumination to result in the loss of infectivity of MS2 phages.
 | ||
| Fig. 6 Upper: Cartoon illustration on the photoexcited state processes in CDots, including the rapid charge separation, and the trapping of electrons and holes thus formed (which can be quenched by external electron acceptor and donor, respectively) and their radiative recombinations. Lower: The energy diagram for the same processes, with the observed fluorescence quantum yield ΦF as a product of Φ1 (denoting the overall yield for the charge separation and radiative recombinations) and Φ2 (the yield of radiative process). | ||
On the traditional photodynamic effects with organic dyes as photosensitizers, ROS scavengers such as L-histidine and tert-butanol are often used for the quenching of singlet molecular oxygen and hydroxyl radicals, respectively.67,68 These scavengers were added to the CDots treatment of MS2 phages for an evaluation of their quenching effects on the antiviral activities of EDA–CDots with visible light. In the experiments, MS2 phage samples containing ∼108 PFU per mL were treated with 20 μg mL−1 EDA–CDots under visible light illumination for 2 h, which resulted in ∼1.16log virus reduction (Fig. 7). The same MS2 samples treated with each of the two scavengers only without any CDots under the same light illumination caused no virus reduction. In the CDots treatment of MS2 samples with visible light, the addition and presence of up to 90 mM tert-butanol resulted in no quenching effect, still the same virus reduction without tert-butanol (Fig. 7). On the other hand, the presence of L-histidine in the treatment of the same MS2 samples with CDots and visible light did quench the antiviral effect, with the level of quenching dependent on the L-histidine concentration (Fig. 7). At the highest L-histidine concentration of 90 mM, the antiviral effect decreased from the originally ∼1.16log to 0.36log, namely that the presence of L-histidine significantly protected MS2 phages from the antiviral action of the photoexcited CDots.
 | ||
| Fig. 7 The effects of scavengers L-histidine and tert-butanol on the antiviral function of CDots toward MS2 phages. The concentrations of the respective scavengers used in the experiments were 30, 60, and 90 mM. MS2 phage samples: ∼108 PFU mL; treatment: 20 μg mL−1 EDA–CDots under visible light illumination for 2 h. | ||
In the study of photodynamic effects by organic dyes, tert-butanol and L-histidine as ROS scavengers are often used to probe the sub-species in the ROS, specifically hydroxyl radicals and singlet molecular oxygen, respectively.67,68 However, CDots are hardly organic dyes-equivalent, despite the fact that some of their photoexcited state properties and processes may share similar characteristics with organic dye photosensitizers (Fig. 6). The observed no quenching by tert-butanol may not be sufficient for a conclusion on the absence of hydroxyl radicals, because such radicals, if present, could be too short lived and/or protected by the dot surface EDA molecules from the scavenging action of tert-butanol. In a similar consideration, L-histidine could be scavenging singlet molecular oxygen, but alternatively might be quenching the action of CDots by interfering their interactions with MS2 phages. These mechanistic issues are complicated, requiring separate systematic investigations. However, one significant outcome for sure from the scavenging experiments is that the antiviral function of photoexcited CDots could not be quenched completely, which might be correlated with expected activities of the initially formed highly reactive yet short-lived charge separated species (Fig. 6). Again, more dedicated investigations for mechanistic insights are needed.
3. Conclusions
The results from this study show unambiguously that CDots activated by visible light are highly effective antiviral agents, diminishing the infectivity of bacteriophage MS2 to the host cells. The action of photoexcited CDots apparently did not significantly change the integrity and morphology of the MS2 phage or break down the capsid proteins, but did result in the protein carbonylation (a commonly used indicator for protein oxidation) and the degradation of genomic RNA. Mechanistically the antiviral action and outcome are attributed to similar photodynamic inactivation (PDI) to what is more established for the visible/natural light-activated antibacterial function of CDots. With more investigations for an improved understanding of mechanistic details, CDots may be established as a new class of antiviral agents for broad applications in the prevention and control of viral infection/spread.4. Materials and methods
4.1 Synthesis and characterization of EDA–CDots
The CDots were synthesized by chemical functionalization of pre-processed and selected small carbon nanoparticles. The processing and selection to harvest the nanoparticles from a commercially acquired sample of carbon nano-powders (US Research Nanomaterials, Inc.) were similar to those reported previously.37,69 In a typical experiment, a portion of the as-supplied carbon nano-powders (2 g) was refluxed in aqueous nitric acid (8 M, 200 mL) for 48 h. The reaction mixture was cooled back to room temperature, and centrifuged at 1000g to discard the supernatant. The residue was re-dispersed in deionized water, dialyzed in a membrane tubing (molecular weight cut-off ∼ 500) against fresh water for 48 h, and then centrifuged at 1000g to retain the supernatant. Upon the removal of water, small carbon nanoparticles were recovered and used in the subsequent functionalization reaction.For the synthesis of EDA–CDots,37,70 the small carbon nanoparticles were refluxed in neat thionyl chloride for 12 h. Upon the removal of excess thionyl chloride, the treated sample (50 mg) was mixed well with carefully dried 2,2′-(ethylenedioxy)bis(ethylamine) (EDA, Sigma-Aldrich, ∼1 g) liquid in a round-bottom flask, heated to 120 °C, and vigorously stirred under nitrogen protection for 3 days. The reaction mixture back at room temperature was dispersed in water and then centrifuged at 20000g to retain the supernatant. It was dialyzed in a membrane tubing (cutoff molecular weight ∼ 500) against fresh water to remove unreacted EDA and other small molecular species to obtain EDA–CDots as an aqueous solution. The characterization by using NMR, microscopy, and optical spectroscopy techniques confirmed the structure and properties of EDA–CDots as previously reported.37,52
4.2 Propagation of bacteriophage MS2 and the plaque assay
E. coli C 3000 (ATCC 15597) and E. coli bacteriophage MS2 (ATCC 15597-B1) were purchased from American Type Culture Collection (ATCC, Manassas, VA). E. coli C-3000 cells were cultured at 37 °C in tryptic soy broth (TSB) with supplements of 0.1% glucose, 0.001% thiamine, and 5.52 mM CaCl2. The supplements were prepared and sterilized by filtration and then added into the sterile TSB media which were cooled to ∼55 °C or below. The overnight grown E. coli cells in TSB were diluted 100 times with fresh TSB, and then grown to the optical density (OD) value of ∼0.5 at the wavelength of 600 nm for further uses to propagate MS2 phages.The propagation of bacteriophage MS2 were performed using the double agar layer method (DLA).71,72 The double agar layer plates were prepared using tryptic soy agar (TSA) plates. Briefly, for the top layer, the stock of MS2 phages were serially diluted with TSB. Then 100 μL diluted MS2 phages (approximately 108 PFU per mL) and 20 μL freshly grown E. coli cells (OD value of ∼0.5 at the wavelength of 595 nm) and were mixed with 3 mL melted TSA which contained 0.7% low-melting agarose pre-warmed at 46 °C. The mixtures were poured onto the plates containing the bottom layer of TSA which were pre-warmed at 37 °C. Once the top TSA solidified, the plates were incubated at 37 °C overnight. To harvest the MS2 phases, the plates with well lysis were flooded with 3 mL TSB and the top TSA was scraped off into a 50 mL sterile tube. TSB was added to the volume of 40 mL, followed by adding 0.2 g EDTA and 0.03 g lysozyme. The tube was incubated in a shaker at 37 °C for 2 h, and then centrifuged at 8000g for 10 min. The supernatant containing the bacteriophage was filtered (pore size 0.22 μm) and stored at −80 °C as a stock of MS2 for further experimental uses.
The titer of MS2 was determined by the plaque assay using the double layer TSA plates and E. coli C3000 as the host. Briefly, an aliquot of 1 mL serially diluted MS2 sample was added to 7 mL of molten agarose overlay along with 200 μL of freshly grown log phase E. coli cells. The agarose containing the E. coli and the MS2 phages were poured onto prewarmed TSA plates. Allowed to solidify for 20–30 min, the plates were then flipped and incubated overnight, and the plaques formed on the plates were counted the next day, and calculated into plaque forming unit per mL (PFU per mL).
4.3 CDots treatment to MS2 phages
To test the antiviral activity of CDots on MS2 phages, the phages from stock were first thawed on ice. Aliquots of 20 μL of MS2 phages at the titer of ∼108 PFU per mL were placed in the wells of 96-well plates, various volumes of 0.75 mg mL−1 CDots stock were added to reach the final concentration ranging from 0 to 50 μg mL−1, then 2/3 × TSB and DI-H2O were added to make the final volume of 150 μL in each well. The plates were then placed on a shaker with constantly shaking under the visible light (∼10 cm above the plate) or in the dark (the plate wrapped with aluminum foil) with desired treatment time. Samples without CDots with light or in dark were used as controls. After the treatments, the MS2 phage samples were then serially diluted and the plaque assay was performed. The reduction in viral titers due to CDots treatment compared to the controls was used to evaluate the effect of CDots on the infectivity MS2 phages.4.4 Growth curves of E. coli C3000 cells infected with untreated and CDots-treated MS2 phage
The growth curves of E. coli C3000 cells infected with CDots-treated and untreated MS2 phages were also examined for examining the amplification of MS2 phages in host E. coli cells in broth. MS2 phages were treated with EDA–CDots at the concentration of 0, 5, 20, 30, 40, and 50 μg mL−1 in the 96-well plate under the light for 1 h or 16 h. Considering the possible influences of CDots on the growth curves of host bacteria, the TSB with CDots but without phages were used as control samples. The treated MS2 phages and the control samples were added into the wells containing E. coli C3000 cells in TSB at the OD595 of ∼0.05. The bacterial growths were monitored by OD at 595 nm every 20 min for 6 h. A decline in OD on the growth curve of E. coli cells indicated E. coli cell lysis by MS2 phage infection.4.5 Effect of ROS scavengers on CDots' antiviral activity
Tert-butanol and L-histidine were used in the experiments as ROS scavengers to scavenge hydroxyl radicals (˙OH) and singlet oxygen (1O2), respectively. Stock solutions of tert-butanol and L-histidine were prepared in DI H2O. In the treatments of MS2 phages with EDA–CDots (20 μg mL−1), various concentrations of tert-butanol or L-histidine at 30 mM, 60 mM, and 90 mM were added to the MS2 samples, appropriate controls including samples treated with scavenger only, CDots only, and untreated samples were included. The samples were mixed and kept in the dark for 15 min and then were placed on the shaker under visible light for 2 h. The titer of MS2 in all samples were determined using the plaque assay as described above.4.6 Transmission electron microscopy (TEM)
The integrity of MS2 phages after EDA–CDots treatment was examined by TEM imaging. MS2 phage samples were treated with 50 μg mL−1 CDots under the visible light or in the dark for 2 h. The samples were loaded on copper grids and air dried, followed by a negative staining step by placing uranyl acetate on the grids for 30 s. The excess stain was wicked with filter paper and the grids were air dried. TEM imaging of MS2 samples was performed in the Microscopy Services Laboratory Core Facility at the University of North Carolina (UNC) at Chapel Hill School of Medicine, using a JEOL JEM-1230 transmission electron microscope operating at 80 kV (JEOL USA, Peabody, MA), equipped with the Gatan Orius SC1000 CCD camera and Gatan Microscopy Suite 3.0 software (Gatan, Inc., Pleasanton, CA).4.7 Assay of protein oxidation in MS2 phages
Protein oxidation in MS2 phages after CDots treatment was assessed by the content of carbonyl protein per gram of total protein. MS2 phages were treated with 20 and 50 μg mL−1 EDA–CDots under visible light for 2 h. The total protein content was determined by the use of Pierce Rapid Gold BCA Protein Assay Kit (Thermo Scientific, Rockford, IL). The carbonyl content was determined using Protein Carbonyl Content Assay Kit (BioVision, Inc., Milpitas, CA). The carbonyl content was calculated according to the instruction from the manufacturer as follows:| C = [[(OD375 nm)/6.364] × 100] nmol per well |
| Carbonyl content: nmol carbonyl per mg protein = (C/P) × 1000 × D |
4.8 SDS-PAGE for analysis of MS2 capsid protein
SDS-PAGE gel was used to examine the effect of CDots on the MS2 capsid protein integrity. MS2 phages were treated with CDots at the concentrations of 0, 10, 20, and 50 μg mL−1 under visible light for 16 h. The freshly thawed phages without CDots treatments were also used for comparison. Aliquots of 5 μL of the treated and untreated MS2 samples were mixed with 1 μL NuPAGE Sample Reducing Agent (Invitrogen, Carlsbad, CA), 2.5 μL LDS-Sample Buffer (Invitrogen, Carlsbad, CA), and 1.5 μL DI-H2O, and sat at 72 °C in a hot block for 8 min. The samples were then analyzed using the SDS-PAGE gels, which were run in NuPAGE MOPS SDS Running Buffer (Life Technologies, Carlsbad, CA) at 200 V for 50 min. The gels were fixed with a 50% methanol and 7% acetic acid solution, rinsed with DI-H2O, and then stained with GelCode Blue Stain Reagent (Thermo Scientific, Rockford, IL) for 1 h with gently shaking. After de-stain with DI-H2O for 2 h, the gels were imaged by using the Li-Cor Odyssey imager (Li-Cor, Inc., Lincoln, NE).4.9 Agarose gel for viral genomic RNA analysis
For examine the effect of CDots treatment on the genomic RNA integrity, MS2 phages were treated with EDA–CDots at concentrations of 0, 5, 10, and 20 μg mL−1 under visible light for 16 h. Genomic RNA was extracted from 250 μL samples by using Invitrogen PureLink™ Viral RNA/DNA Mini Kit (Thermo Fisher Scientific, Carlsbad, CA) according to the instructions from the manufacturer. The extracted RNA was eluted with 25 μL of RNase-/DNase-free water and was loaded at the volume of 5 μL in a 1.2% agarose gel for electrophoresis. The gel was stained for 20 min with ethidium bromide solution in the dark, and the image was captured under UV light using Kodak Image Station 4000R Pro (Carestream Health, Inc., Rochester, NY).Authors' contributions
XD: methodology, investigation, data curation, writing-original draft. RE: methodology, investigation. FY: methodology, investigation. YT: methodology, data curation, resources, funding acquisition. PW: methodology, investigation, data curation. SYP: conceptualization, resource, supervision, writing – reviewing and editing, finding acquisition. LY: conceptualization, resources, supervision, writing – reviewing and editing, funding acquisition.Conflicts of interest
The authors declare no conflict of interest.Acknowledgements
Financial support from NSF 1855905, 1701399 and 1701424 is gratefully acknowledged.References
- R. Lozano, M. Naghavi, K. Foreman, S. Lim, K. Shibuya, V. Aboyans, J. Abraham, T. Adair, R. Aggarwal, S. Y. Ahn, M. Alvarado, H. R. Anderson, L. M. Anderson, K. G. Andrews, C. Atkinson, L. M. Baddour, S. Barker-Collo, D. H. B. Bartels, M. L. Bell, E. J. Benjamin, D. Bennett, K. Bhalla, B. Bikbov, A. Bin Abdulhak, G. Birbeck, F. Blyth, I. Bolliger, S. Boufous, C. Bucello, M. Burch, P. Burney, J. Carapetis, H. L. Chen, D. Chou, S. S. Chugh, L. E. Coffeng, S. D. Colan, S. Colquhoun, K. E. Colson, J. Condon, M. D. Connor, L. T. Cooper, M. Corriere, M. Cortinovis, K. C. de Vaccaro, W. Couser, B. C. Cowie, M. H. Criqui, M. Cross, K. C. Dabhadkar, N. Dahodwala, D. De Leo, L. Degenhardt, A. Delossantos, J. Denenberg, D. C. Des Jarlais, S. D. Dharmaratne, E. R. Dorsey, T. Driscoll, H. Duber, B. Ebel, P. J. Erwin, P. Espindola, M. Ezzati, V. Feigin, A. D. Flaxman, M. H. Forouzanfar, F. G. R. Fowkes, R. Franklin, M. Fransen, M. K. Freeman, S. E. Gabriel, E. Gakidou, F. Gaspari, R. F. Gillum, D. Gonzalez-Medina, Y. A. Halasa, D. Haring, J. E. Harrison, R. Havmoeller, R. J. Hay, B. Hoen, P. J. Hotez, D. Hoy, K. H. Jacobsen, S. L. James, R. Jasrasaria, S. Jayaraman, N. Johns, G. Karthikeyan, N. Kassebaum, A. Keren, J. P. Khoo, L. M. Knowlton, O. Kobusingye, A. Koranteng, R. Krishnamurthi, M. Lipnick, S. E. Lipshultz, S. L. Ohno, J. Mabweijano, M. F. MacIntyre, L. Mallinger, L. March, G. B. Marks, R. Marks, A. Matsumori, R. Matzopoulos, B. M. Mayosi, J. H. McAnulty, M. M. McDermott, J. McGrath, G. A. Mensah, T. R. Merriman, C. Michaud, M. Miller, T. R. Miller, C. Mock, A. O. Mocumbi, A. A. Mokdad, A. Moran, K. Mulholland, M. N. Nair, L. Naldi, K. M. V. Narayan, K. Nasseri, P. Norman, M. O’Donnell, S. B. Omer, K. Ortblad, R. Osborne, D. Ozgediz, B. Pahari, J. D. Pandian, A. P. Rivero, R. P. Padilla, F. Perez-Ruiz, N. Perico, D. Phillips, K. Pierce, C. A. Pope, E. Porrini, F. Pourmalek, M. Raju, D. Ranganathan, J. T. Rehm, D. B. Rein, G. Remuzzi, F. P. Rivara, T. Roberts, F. R. De Leon, L. C. Rosenfeld, L. Rushton, R. L. Sacco, J. A. Salomon, U. Sampson, E. Sanman, D. C. Schwebel, M. Segui-Gomez, D. S. Shepard, D. Singh, J. Singleton, K. Sliwa, E. Smith, A. Steer, J. A. Taylor, B. Thomas, I. M. Tleyjeh, J. A. Towbin, T. Truelsen, E. A. Undurraga, N. Venketasubramanian, L. Vijayakumar, T. Vos, G. R. Wagner, M. R. Wang, W. Z. Wang, K. Watt, M. A. Weinstock, R. Weintraub, J. D. Wilkinson, A. D. Woolf, S. Wulf, P. H. Yeh, P. Yip, A. Zabetian, Z. J. Zheng, A. D. Lopez and C. J. L. Murray, Lancet, 2012, 380, 2095–2128 CrossRef.
- P. Moitra, Bioorg. Chem., 2019, 86, 15–27 CrossRef CAS PubMed.
- P. Moitra, M. Alafeef, K. Dighe, M. B. Frieman and D. Pan, ACS Nano, 2020, 14, 7617–7627 CrossRef CAS PubMed.
- S. Park, H. H. Park, S. Y. Kim, S. J. Kim, K. Woo and G. Ko, Appl. Environ. Microbiol., 2014, 80, 2343–2350 CrossRef PubMed.
- N. Shionoiri, T. Sato, Y. Fujimori, T. Nakayama, M. Nemoto, T. Matsunaga and T. Tanaka, J. Biosci. Bioeng., 2012, 113, 580–586 CrossRef CAS.
- G. W. Park, M. Cho, E. L. Cates, D. Lee, B. T. Oh, J. Vinje and J. H. Kim, J. Photochem. Photobiol., B, 2014, 140, 315–320 CrossRef CAS.
- A. Ingle, A. Gade, S. Pierrat, C. Sonnichsen and M. Rai, Curr. Nanosci., 2008, 4, 141–144 CrossRef CAS.
- T. Cromeans, G. W. Park, V. Costantini, D. Lee, Q. Wang, T. Farkas, A. Lee and J. Vinje, Appl. Environ. Microbiol., 2014, 80, 5743–5751 CrossRef.
- M. R. Hamblin and S. B. Brown, in Advances in Photodynamic Therapy: Basic, Translational and Clinical, ed. M. R. Hamblin and P. Mroz, Artech House, Inc., Norwood, MA, 2008, ch. 19 Search PubMed.
- G. V. Anehosur, R. D. Kulkarni, M. G. Naik and R. K. Nadiger, Journal of Gerontology and Geriatric Research, 2012, 1, 1–8 Search PubMed.
- Y. L. Chen, Y. S. Chen, H. Chan, Y. H. Tseng, S. R. Yang, H. Y. Tsai, H. Y. Liu, D. S. Sun and H. H. Chang, PLoS One, 2012, 7, e31212 CrossRef CAS PubMed.
- C. L. Cheng, D. S. Sun, W. C. Chu, Y. H. Tseng, H. C. Ho, J. B. Wang, P. H. Chung, J. H. Chen, P. J. Tsai, N. T. Lin, M. S. Yu and H. H. Chang, J. Biomed. Sci., 2009, 16, 7 CrossRef PubMed.
- A. J. T. Naik, S. Ismail, C. Kay, M. Wilson and I. P. Parkin, Mater. Chem. Phys., 2011, 129, 446–450 CrossRef CAS.
- S. Noimark, E. Allan and I. P. Parkin, Chem. Sci., 2014, 5, 2216–2223 RSC.
- S. Perni, C. Piccirillo, J. Pratten, P. Prokopovich, W. Chrzanowski, I. P. Parkin and M. Wilson, Biomaterials, 2009, 30, 89–93 CrossRef CAS.
- L. Y. Huang, M. Terakawa, T. Zhiyentayev, Y. Y. Huang, Y. Sawayama, A. Jahnke, G. P. Tegos, T. Wharton and M. R. Hamblin, Nanomedicine, 2010, 6, 442–452 CrossRef CAS.
- C. M. Courtney, S. M. Goodman, J. A. McDaniel, N. E. Madinger, A. Chatterjee and P. Nagpal, Nat. Mater., 2016, 15, 529–534 CrossRef CAS.
- C. M. Courtney, S. M. Goodman, T. A. Nagy, M. Levy, P. Bhusal, N. E. Madinger, C. S. Detweiler, P. Nagpal and A. Chatterjee, Sci. Adv., 2017, 3, e1701776 CrossRef.
- Z. Lu, C. M. Li, H. Bao, Y. Qiao, Y. Toh and X. Yang, Langmuir, 2008, 24, 5445–5452 CrossRef CAS.
- L. Cao, M. J. Meziani, S. Sahu and Y. P. Sun, Acc. Chem. Res., 2013, 46, 171–180 CrossRef CAS PubMed.
- L. Cao, X. Wang, M. J. Meziani, F. S. Lu, H. F. Wang, P. J. G. Luo, Y. Lin, B. A. Harruff, L. M. Veca, D. Murray, S. Y. Xie and Y. P. Sun, J. Am. Chem. Soc., 2007, 129, 11318–11319 CrossRef CAS.
- K. A. S. Fernando, S. Sahu, Y. M. Liu, W. K. Lewis, E. A. Guliants, A. Jafariyan, P. Wang, C. E. Bunker and Y. P. Sun, ACS Appl. Mater. Interfaces, 2015, 7, 8363–8376 CrossRef CAS.
- G. E. LeCroy, S. T. Yang, F. Yang, Y. M. Liu, K. A. S. Fernando, C. E. Bunker, Y. Hu, P. G. Luo and Y. P. Sun, Coord. Chem. Rev., 2016, 320, 66–81 CrossRef.
- S. Y. Lim, W. Shen and Z. Q. Gao, Chem. Soc. Rev., 2015, 44, 362–381 RSC.
- P. J. G. Luo, S. Sahu, S. T. Yang, S. K. Sonkar, J. P. Wang, H. F. Wang, G. E. LeCroy, L. Cao and Y. P. Sun, J. Mater. Chem. B, 2013, 1, 2116–2127 RSC.
- P. J. G. Luo, F. Yang, S. T. Yang, S. K. Sonkar, L. J. Yang, J. J. Broglie, Y. Liu and Y. P. Sun, RSC Adv., 2014, 4, 10791–10807 RSC.
- P. Miao, K. Han, Y. G. Tang, B. D. Wang, T. Lin and W. B. Cheng, Nanoscale, 2015, 7, 1586–1595 RSC.
- Y. P. Sun, US Pat., #7829772, 2010 and #8932877, 2015.
- Y. P. Sun, B. Zhou, Y. Lin, W. Wang, K. A. S. Fernando, P. Pathak, M. J. Meziani, B. A. Harruff, X. Wang, H. F. Wang, P. J. G. Luo, H. Yang, M. E. Kose, B. L. Chen, L. M. Veca and S. Y. Xie, J. Am. Chem. Soc., 2006, 128, 7756–7757 CrossRef CAS.
- Y. F. Wang and A. G. Hu, J. Mater. Chem. C, 2014, 2, 6921–6939 RSC.
- A. D. Zhao, Z. W. Chen, C. Q. Zhao, N. Gao, J. S. Ren and X. G. Qu, Carbon, 2015, 85, 309–327 CrossRef CAS.
- X. L. Dong, W. X. Liang, M. J. Meziani, Y. P. Sun and L. J. Yang, Theranostics, 2020, 10, 671–686 CrossRef CAS.
- M. J. Meziani, X. Dong, L. Zhu, L. P. Jones, G. E. LeCroy and F. Yang, ACS Appl. Mater. Interfaces, 2016, 8, 10761–10766 CrossRef CAS PubMed.
- D. Abu Rabe, O. Mohammed, X. Dong, A. Patel, C. Overton, Y. Tang, S. Kathariou, Y. Sun and L. Yang, Materials Advances, 2020, 1, 321–325 RSC.
- Y. P. Sun, Carbon Dots – Exploring Carbon at Zero-Dimension, Springer International Publishing, 2020 Search PubMed.
- D. I. Abu Rabe, M. M. Al Awak, F. Yang, P. A. Okonjo, X. Dong, L. R. Teisl, P. Wang, Y. Tang, N. Pan, Y. P. Sun and L. Yang, Int. J. Nanomed., 2019, 14, 2655–2665 CrossRef CAS.
- G. E. LeCroy, S. K. Sonkar, F. Yang, L. M. Veca, P. Wang, K. N. Tackett 2nd, J. J. Yu, E. Vasile, H. Qian, Y. Liu, P. G. Luo and Y. P. Sun, ACS Nano, 2014, 8, 4522–4529 CrossRef CAS PubMed.
- M. M. Al Awak, P. Wang, S. Y. Wang, Y. A. Tang, Y. P. Sun and L. J. Yang, RSC Adv., 2017, 7, 30177–30184 RSC.
- X. L. Dong, M. M. Moyer, F. Yang, Y. P. Sun and L. J. Yang, Sci. Rep., 2017, 7, 519 CrossRef.
- G. F. Brooks, K. C. Carroll, J. S. Butel, S. A. Morse and T. A. Mietzner, in Jawetz, Melnick, & Adelberg's Medical Microbiology, The McGraw-Hill Companies, Inc., McGraw Hill, 26th edn, 2013 Search PubMed.
- C. Rye, R. Wise, V. Jurukovsk, J. DeSaix, J. Choi and Y. Avissar, General Biology, https://bio.libretexts.org/Bookshelves/Introductory_and_General_Biology/Book%3A_General_Biology_(Boundless)/ Search PubMed.
- J. A. Thorley, J. A. McKeating and J. Z. Rappoport, Protoplasma, 2010, 244, 15–24 CrossRef CAS.
- H. Sobhy, Arch. Virol., 2017, 162, 3567–3585 CrossRef CAS PubMed.
- J. P. Buchmann and E. C. Holmes, Microbiol. Mol. Biol. Rev., 2015, 79, 403–418 CrossRef CAS.
- J. Callanan, S. R. Stockdale, A. Shkoporov, L. A. Draper, R. P. Ross and C. Hill, Viruses, 2018, 10, 388 CrossRef PubMed.
- Z. Y. Lou, Y. N. Sun and Z. H. Rao, Trends Pharmacol. Sci., 2014, 35, 86–102 CrossRef CAS.
- E. Addae, X. Dong, E. McCoy, C. Yang, W. Chen and L. Yang, J. Biol. Eng., 2014, 8, 11 CrossRef PubMed.
- J. J. Broglie, B. Alston, C. Yang, L. Ma, A. F. Adcock, W. Chen and L. Yang, PLoS One, 2015, 10, e0141050 CrossRef PubMed.
- K. Feng, E. Divers, Y. Ma and J. Li, Appl. Environ. Microbiol., 2011, 77, 3507–3517 CrossRef CAS.
- E. Araud, E. DiCaprio, Z. Yang, X. Li, F. Lou, J. H. Hughes, H. Chen and J. Li, Appl. Environ. Microbiol., 2015, 81, 6669–6678 CrossRef CAS PubMed.
- L. Costa, M. A. Faustino, M. G. Neves, A. Cunha and A. Almeida, Viruses, 2012, 4, 1034–1074 CrossRef PubMed.
- G. E. LeCroy, F. Messina, A. Sciortino, C. E. Bunker, P. Wang, K. A. S. Fernando and Y.-P. Sun, J. Phys. Chem. C, 2017, 121, 28180–28186 CrossRef CAS.
- X. Dong, A. E. Bond, N. Pan, M. Coleman, Y. Tang, Y. P. Sun and L. Yang, Int. J. Nanomed., 2018, 13, 8025–8035 CrossRef CAS.
- X. L. Dong, M. Al Awak, N. Tomlinson, Y. G. Tang, Y. P. Sun and L. J. Yang, PLoS One, 2017, 12, e0185324 CrossRef PubMed.
- H. Majiya, O. O. Adeyemi, N. J. Stonehouse and P. Millner, J. Photochem. Photobiol., B, 2018, 178, 404–411 CrossRef CAS.
- M. D. Driessen, S. Mues, A. Vennemann, B. Hellack, A. Bannuscher, V. Vimalakanthan, C. Riebeling, R. Ossig, M. Wiemann and J. Schnekenburger, Part. Fibre Toxicol., 2015, 12, 36 CrossRef.
- I. Dalle-Donne, R. Rossi, D. Giustarini, A. Milzani and R. Colombo, Clin. Chim. Acta, 2003, 329, 23–38 CrossRef CAS.
- E. Shacter, J. A. Williams, M. Lim and R. L. Levine, Free Radicals Biol. Med., 1994, 17, 429–437 CrossRef CAS.
- E. Shacter, Drug Metab. Rev., 2000, 32, 307–326 CrossRef CAS.
- E. R. Stadtman, Free Radical Res., 2006, 40, 1250–1258 CrossRef CAS.
- W. Fiers, R. Contreras, F. Duerinck, G. Haegeman, D. Iserentant, J. Merregaert, W. Min Jou, F. Molemans, A. Raeymaekers, A. Van den Berghe, G. Volckaert and M. Ysebaert, Nature, 1976, 260, 500–507 CrossRef CAS.
- J. van Duin and N. Tsareva, in The Bacteriophages, ed. R. L. Calendar, Oxdord University Press, Oxford, 2nd edn, 2006, vol. 1, ch. 4, pp. 117–167 Search PubMed.
- X. Dong, L. Ge, D. I. Abu Rabe, O. O. Mohammed, P. Wang, Y. Tang, S. Kathariou, L. Yang and Y.-P. Sun, Carbon, 2020, 170, 137–145 CrossRef CAS.
- J.-H. Liu, Y. Wang, G.-H. Yan, F. Yang, H. Gao, Y. Huang, H. Wang, P. Wang, L. Yang, Y. Tang, L. R. Teisl and Y.-P. Sun, J. Nanosci. Nanotechnol., 2019, 19, 2130–2137 CrossRef CAS.
- Y. Wang, P. Anilkumar, L. Cao, J. H. Liu, P. G. Luo, K. N. Tackett 2nd, S. Sahu, P. Wang, X. Wang and Y. P. Sun, Exp. Biol. Med., 2011, 236, 1231–1238 CrossRef CAS.
- S. T. Yang, X. Wang, H. Wang, F. Lu, P. G. Luo, L. Cao, M. J. Meziani, J. H. Liu, Y. Liu, M. Chen, Y. Huang and Y. P. Sun, J. Phys. Chem. C, 2009, 113, 18110–18114 CrossRef CAS PubMed.
- K. Hara, S. Holland and J. Woo, J. Exp. Microbiol. Immunol., 2004, 62–66 Search PubMed.
- K. Ishiyama, K. Nakamura, H. Ikai, T. Kanno, M. Kohno, K. Sasaki and Y. Niwano, PLoS One, 2012, e37871 CrossRef CAS.
- F. Yang, G. E. LeCroy, P. Wang, W. Liang, J. Chen, K. A. S. Fernando, C. E. Bunker, H. Qian and Y.-P. Sun, J. Phys. Chem. C, 2016, 120, 25604–25611 CrossRef CAS.
- Y. M. Liu, P. Wang, K. A. S. Fernando, G. E. LeCroy, H. Maimaiti, B. A. Harruff-Miller, W. K. Lewis, C. E. Bunker, Z. L. Hou and Y. P. Sun, J. Mater. Chem. C, 2016, 4, 6967–6974 RSC.
- J. You, Y. Zhang and Z. Hu, Colloids Surf., B, 2011, 85, 161–167 CrossRef CAS PubMed.
- A. R. Badireddy, E. M. Hotze, S. Chellam, P. Alvarez and M. R. Wiesner, Environ. Sci. Technol., 2007, 41, 6627–6632 CrossRef CAS PubMed.
| This journal is © The Royal Society of Chemistry 2020 |