 Open Access Article
Physical property and gas transport studies of ultrathin polysulfone membrane from 298.15 to 328.15 K and 2 to 50 bar: atomistic molecular simulation and empirical modelling†
S. S. M. Locka,
K. K. Lau *a,
Norwahyu Jusoh
 a,
A. M. Shariffa,
Y. F. Yeong
 a,
Chung Loong Yiinb and
Syed Ali Ammar Taqvic
aCO2 Research Center (CO2RES), Department of Chemical Engineering, Universiti Teknologi PETRONAS, 32610 Seri Iskandar, Malaysia. E-mail: laukokkeong@utp.edu.my
bDepartment of Chemical Engineering and Energy Sustainability, Faculty of Engineering, Universiti Malaysia Sarawak (UNIMAS), 94300, Kota Samarahan, Sarawak, Malaysia
cDepartment of Chemical Engineering, NED University of Engineering and Technology, Karachi, 75270, Pakistan
First published on 1st September 2020
Abstract
Elucidation of ultrathin polymeric membrane at the laboratory scale is complicated at different operating conditions due to limitation of instruments to obtain in situ measurement data of membrane physical properties. This is essential since their effects are reversible. In addition, tedious experimental work is required to collect gas transport data at varying operating conditions. Recently, we have proposed a validated Soft Confining Methodology for Ultrathin Films that can be used to simulate ultrathin polysulfone (PSF) membranes upon confinement limited to 308.15 K and 2 bars. In industry application, these ultrathin membranes are operated within 298.15–328.15 K and up to 50 bars. Therefore, our proposed methodology using computational chemistry has been adapted to circumvent limitation in experimental study by simulating ultrathin PSF membranes upon confinement at different operating temperatures (298.15 to 328.15 K) and pressures (2 to 50 bar). The effect of operating parameters towards non-bonded and potential energy, free volume, specific volume and gas transport data (e.g. solubility and diffusivity) for oxygen and nitrogen of the ultrathin films has been simulated and collected using molecular simulation. Our previous empirical equations that have been confined to thickness dependent gas transport properties have been modified to accommodate the effect of operating parameters. The empirical equations are able to provide a good quantitative characterization with R2 ≥ 0.99 consistently, and are able to be interpolated to predict gas transport properties within the range of operating conditions. The modified empirical model can be utilized in process optimization studies to determine optimal membrane design for typical membrane specifications and operating parameters used in industrial applications.
1. Introduction
Oxygen enriched combustion has emerged as one of the most promising combustion technologies over the past decade.1 The greater combustion proficiency through oxygen enriched air entails minimization in emission of pollutants, typically carbon dioxide (CO2) and carbon monoxide (CO).1 Based on a review of existing air separation technologies, e.g. cryogenic distillation and pressure swing absorption, it is found that there exists a trade-off between oxygen purity and production volume with energy requirement and cost for plant operation. At present, oxygen separated from membranes has been reported to be potentially competitive for medium O2 purity (25–40%) and small scale plants (10–25 tons per day)2 associated with advantages of being less energy intensive, inheriting lower capital and operating costs, and being inherently safer.3 Since air is constituted by merely 21% of O2 and remaining N2 in abundance, enhancement of a membrane that exhibits good permeance and selectivity is vital to ensure good O2 recovery and minimization of heat lost through by-products.4 In order to be commercially viable in oxygen-enriched combustion applications, it has been reported that polymeric membranes have to minimally exhibit an ideal O2/N2 selectivity of 3–6 and optimum O2 permeance value.5 The excellent gas separation properties can be achieved via fabrication of a membrane matrix with ultrathin dimension (<1000 Å)6 to reduce transport resistance while exhibiting satisfactory separation properties to allow transport of O2 to the permeate while retaining N2 in the retentate.Nevertheless, the application of ultrathin polymeric membrane in industrial scale has encountered hindrance for further expansion to date. The main challenge has been attributed to departure of behavior and properties of ultrathin polymeric membrane film in comparison to its bulky counterpart.7 By reducing the thickness of a film appropriately beneath a particular dimension (i.e., <1000 Å thick), the conformation of polymeric chains in the membrane is perturbed when it is located in the vicinity closer to the surface boundary. Under such circumstance, behavior and properties of ultrathin polymeric membrane film is dependent upon specification of the active film, whereby it is commonly known as the thickness dependent confinement.8 The phenomenon is yet to be fully elucidated and remains an active research area. This has been due to difficulties to prepare defect free ultrathin membrane films at experimental scale that requires specialty instruments under controlled environment, which are usually expensive and time consuming, to increase its success rate of fabrication.9 In addition, in a real experimental set-up, nanofilms are typically grown on support, such as silicon wafer and glass, whereby the inherent stability and physical properties can be different since interaction between polymeric film and support existed.10
Molecular simulation of membrane involves the study of fundamentals characterizing the interaction between atoms. The end effect of membrane morphology and properties as a direct consequence of alteration in operating conditions and exposure to feed gas that are difficult or impossible to be obtained from in situ measurement can be elucidated directly.11 The challenges have been ascribed to the reversibility of membrane morphology after removal of operating conditions from the membrane. This further shows the importance of computational tool as an alternative to expensive laboratory instruments in order to obtain in situ measurement data of membrane. Furthermore, there are inherent constraints in the range of working operating parameters of measuring probes associated with the instruments. Thereby, it is almost impossible to obtain data of morphology and physical property of membrane at extended operating parameters away from ambient condition at laboratory scale. In this context, molecular simulation tool can be used to develop empirical equations that describe intrinsic material properties of ultrathin films.11
Nonetheless, most of the simulation work has assumed an idealistic proposition of membrane material with uniform characteristic through the periodic boundary condition (PBC), whereby the behaviour is the same in all directions.12 The PBC assumption is merely valid for bulk polymer and not for ultrathin structure, whereby confinement that arises from the polymer membrane surface plays an essential role to the chain relaxation, causing a deviation from its bulk counterpart.13 Over recent years, published literature has emerged to construct ultrathin polymer films adopting different methodologies by simulating the interaction between the polymer and interfaces. Baschnagel & his co-workers employed user defined wall potential, ε, that can be altered to modify dynamics of non-entangled polymer melts near to surfaces.14–16 In another work by Torres et al. (2000), they adapted a hard sphere molecular dynamics methodology via coarse grain agglomeration to simulate ultrathin polymer system with free and solid surfaces that involves many atoms.17 Liu et al. adapted inert xenon crystals as confining layer to condense polymer chain from melt to glassy state to create amorphous polymer surfaces.18 It is suggested that xenon is a promising candidate to form dummy rigid surfaces, whereby hydrophobicity of polypropylene and hydrophilicity of cellulose layer have been investigated and validated with experimental values. In recent work by Nie et al. (2019), they used dynamic Monte Carlo (MC) to simulate ultrathin films by placing non-penetrable substrates on surfaces of the polymer chains. The simulation model has been used to elucidate the impact of polymer–substrate interaction on the localized glass transition temperature (Tg) and segmental density distribution within ultrathin film.19 In short, all the works have been devoted to study the methodology for constructing ultrathin films at a fixed dimension and ambient operating conditions.
Besides, limited study has been conducted to incorporate gas molecules within the constructed ultrathin films to elucidate gas transport properties upon confinement.20,21 Similarly, the construction of ultrathin film at fixed dimensions has restrained the elucidation of confinement towards thickness-dependent gas transport properties.20,21 Frentrup et al. (2012) developed a novel non-equilibrium molecular dynamics (NEMD) simulation along the thickness of a polymer slice and demonstrate how permeability and solubility can be reasoned from a single simulation.20 Tong et al. (2016) simulated 2-dimensional (2-D) Covalent Organic Framework (COF) ultrathin membranes through computational study in layers to explore the gas separation of such structures.22 Ozcan et al. (2017) presented a concentration gradient driven MD (CGD-MD), whereby the permeation driving force is based upon concentration gradient for pure and binary gas mixtures through ultrathin membranes.23 In recent work by Liu et al. (2019), they propose a novel molecular simulation procedure for ultrathin polymer slices to simulate effect of swelling and permeabilities of organic solvent in nanofiltration, in which it has been validated via good agreement with experimental data.24 Based on review of the published literatures, most of the research have been confined to study of gas permeability in the membrane at ambient operating conditions, while the study of individual contributions of gas solubility and diffusivity to permeance under varying operating temperatures and pressures typically for ultrathin polymeric films have received less scrutiny. The thickness upon confinement towards gas transport properties under varying operating conditions has also not been described through empirical equations to provide quantitative elucidation towards the phenomenon.
Based on the motivation, the objective of this study is to simulate ultrathin PSF polymeric membranes upon nanoconfinement at varying operating temperatures and pressures. This will help to provide insight into the morphological change from molecular level while enable physical property to be elucidated to circumvent limitation of experimental scale instruments. In this context, the Soft Confining Methodology for Ultrathin Films (SCMUF) proposed in our previous works to simulate ultrathin PSF films of varying specifications (<1000 Å)25 has been employed, but has been further improved through incorporation of operating condition effects to the molecular simulation framework. Subsequently, gas transport properties (solubility, diffusivity and permeance) at a specific film thickness under varying operating temperatures and pressures have been elucidated. The novelty of our work has also been highlighted with regards to extension of our previous empirical equations26 that originally only address the effect of thickness-dependent gas transport properties upon confinement for ultrathin film via incorporation of thermodynamic parameters obtained from the constructed molecular structures to simulate effect of operating temperature and pressure. The improved empirical equations with incorporation of effect of operating parameters in ultrathin PSF membranes has been validated through close compliance between interpolated model prediction and published experimental data. The good validity has been used to predict gas solubility, diffusivity and permeance for ultrathin films of varying thicknesses (∼100–5000 Å),27 operating temperatures (298.15 to 328.15 K)28,29 and pressures (2 to 50 bar).30,31
2. Methodology
This section describes the molecular simulation methodology that has been adapted to simulate ultrathin PSF films at varying operating conditions. The physical property studies that have been employed to elucidate morphological alterations associated with changes in the aforementioned variables have also been studied in this section. Subsequently, the methodology to determine gas solubility, diffusivity and permeance in the constructed ultrathin PSF of a particular dimension has been outlined. Finally, the modelling work that has been conducted to revise empirical equations from our previously published works that characterize the mere effect of thickness upon confinement towards O2 and N2 gas transport behavior has also been elaborated in order to extend its functionality at varying operating parameters. Summary of the chemical compounds used in this study and their associated models have been provided in Table 1.| Chemical name | Chemical or linear formula | CAS number | Model |
|---|---|---|---|
| a Interaction parameters using COMPASS force field given in ESI (S1) to (S4).b Methodology to simulate the ultrathin structure has been given in Fig. S.1 of ESI. | |||
| Oxygen |  |
7782-44-7 | Materials Studioa |
| Nitrogen |  |
7727-37-9 | Materials Studioa |
| Polysulfone | 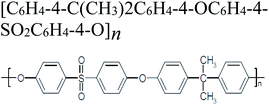 |
25135-51-7 | Materials Studioa (SCMUF)b |
2.1 Soft confining methodology for ultrathin films at different operating conditions
Details of the molecular simulation to simulate ultrathin PSF films at vary thicknesses upon confinement have been outlined in our earlier works.25 Biova Materials Studio version 8.0 (ref. 32) has been adapted in present work with Condensed-phase Optimized Molecular Potentials for Atomistic Simulation Studies (COMPASS) since it has been reported to be able to generate a PSF membrane that exhibits physical properties with a close agreement to experimental observations.33 In this work, the electronic interactions have been characterized using the Ewald method (accuracy 0.001 kcal mol−1), while the Lennard-Jones-9-6 function has been employed to describe the van der Waals association.34 The cut-off distances have been set to be 45–500 Å respectively (spine width = 0.1 nm; buffer width = 0.05 nm), which is reliant on the specification of the ultrathin film of interest.Briefly, the methodology has utilized xenon crystals as compacting layer to confine polymeric chains into 2-dimensional molecular model at different film specifications.18 However, the simulation methodology has been extended to varying operating temperatures and pressures in the present study. The operating temperature has been altered at distinct values, which are 298.15, 308.15, 318.15 and 328.15 K, since they are within the temperature range most commonly employed for polymeric membranes in industrial application.28,29 Parameter sensitivity of pressure effect has also been conducted by altering the operating pressure within the range 2, 10, 20, 30, 40 and 50 bars. Pressure of up to 50 bars has been proposed to be the suitable range for study in O2/N2 gas separation using membrane in previous published literatures.30,31 Temperature has been maintained throughout the course of molecular simulation using Nose thermostat with Q ratio of 0.01. On the other hand, operating pressure is regulated at the designated condition employing the Berendsen barostat with a decay constant of 0.1 ps. Overall workflow of the simulation has been summarized in Fig. S.1 in ESI.† The procedural works in which simulation parameter is required to be regulated at the respective operating conditions have also been highlighted in the figure.
In general, assumptions and limitations that are associated with the simulation methodology are provided as follow:
i. Mobility of atoms within the simulation system can be described sufficiently using Newton's law of motion.
ii. Empirical potential function parameters embedded in Materials Studio can be used to quantify molecular interaction among atoms over the range of temperature and pressure being studied.33
iii. The cutoff distance of half the simulated cell lengths is adequate to capture the important interactions in the system. The basis have been established by other published molecular simulation work to be the adequate cut off distances to hinder particle from interacting with its own image, while minimizing any unnecessary and costly computational time.35,36
iv. Effect of membrane plasticization is negligible since oxygen and nitrogen are non condensable gases.6
v. Isothermal operation at designated temperature37–39 by assuming negligible Joule–Thomson (JT) temperature drop. It has been reported that JT cooling is less apparent in O2/N2 separation40 while being majorly significant in application involving feed gas with a high CO2 contaminant content41–43
vi. Both O2 (TC = 154.55 K; PC = 50.5 bar) and N2 (TC = 126.15 K; PC = 34 bar) demonstrate characteristic of gas molecules in the range of operating temperature from 298.15 to 328.15 K and pressure from 2 to 50 bars. The assumption has been verified through gas–liquid phase tabulation from Plank–Riedel equation as shown in Fig. S.2,† in which the limit of operating temperature and pressure is found to be located within the vicinity of gas-like behavior.44–46 In addition, published literatures devoted to study of gas separation involving nitrogen species have commonly been operated above its critical pressure, which further justify the range of operating conditions selected.47–52 In particular, study by Kamiya et al. (1986) that have studied the transport behavior of N2 in bulk PSF membrane has been operated up to 50 bars at 308.15 K, which further verifies applicability of the operating pressure for membrane separation.53
2.2 Physical property analysis
Varying physical properties of the constructed ultrathin polymeric films have been elaborated based upon the methodologies and basis outlined in this section.The specific volume of polymer film, vg, has been reported by Shishatskii et al. (1996)54 to be a limiting function for film thickness, such as that depicted in (1), whereby it has been deduced from actual experimental observation. Applicability of the equation to characterize thickness-dependent specific volume has been further reaffirmed in the study by Chen et al. (2012).55
 | (1) |
 | (2) |
The Connolly surface function, which has been readily available in Materials Studio simulation software as build-in capability, has been employed to determine the phases consisting of solid and free volume, respectively. The medium grid resolution with 0.4 Å grid intervals and Connolly probe radius of 1.3 Å, which corresponds to the kinetic size of gas helium, has been employed. The kinetic radius of helium has been used since it exhibits the smallest size among all penetrants that enables all void spaces in the polymeric film to be captured.
In addition, the FFV (Bondi) variable has been calculated based on Bondi's group contribution methodology, as shown in (3).56
 | (3) |
2.3 Gas transport properties
Similarly, the methodology that has been employed to elucidate gas transport properties within the 500 Å ultrathin PSF films, which comprises of gas diffusivity, gas solubility and gas permeance, has been elaborated in our previous works.26 In summary, gas diffusivity has been determined via random insertion of gas O2 or N2 within supercell of the simulated cell, followed by successive 1000 ps NPT-500 ps NVT MD to relax the molecular system at the particular operating temperature and pressure. The consecutive NPT–NVT procedure is continued until fluctuations observed in the physical properties and energies of the structure are within predefined tolerance.26 Subsequently, an additional 5000 ps NVT MD has been executed to track mean square displacement (MSD) of the O2 or N2 gas molecules. The tasks have been completed through employment of Forcite module in Materials Studio. Finally, according to Einstein correlation, the diffusivity coefficient can be read from 1/6 slope of the MSD versus time curve.58 With regards to the gas solubility, Sorption module of the simulation software has been adapted using build-in adsorption isotherm task.26 Grand canonical Monte Carlo ensemble (GCME) has been used that involves constant temperature and pressure at the designated operating conditions and volume of the simulation cell of interest with merely change in energy and number of sorbed particles allowed.26 The probability of inserting the sorbed molecules have been based upon Metropolis methodology, whereby the probability of inclusion are computed from energy alteration between successive configurations with degree of freedom in gas orientations and amount.59 Consequently, slope of gas concentration versus fugacity isotherm at region close to the origin (0 to 1 atm) can be used to calculate the solubility coefficient.26 Ultimately, gas permeance is obtained via product of gas diffusivity and solubility normalized by active film thickness of the ultrathin film.602.4 Empirical modeling of gas transport behavior of ultrathin films upon confinement at varying operating conditions
In our previous work, empirical equations that have been developed to characterize the effect of thickness upon confinement, l, towards gas diffusivity, Di(l), solubility, Si(l), and permeance, , have been summarized in (4), (5) and (6), respectively.
 | (4) |
 | (5) |
 | (6) |
In this work, Tait's empirical equations62 coupled together with parameter obtained from Zoller's work63,64 have been adapted to quantify the operating temperature and pressure dependency of PSF polymer. In Zoller's work, experimental work has been conducted on bulk PSF polymer to determine the correlations for volume–temperature isotherm at zero pressure and Tait parameter over a wide range of operating temperatures and pressures (temperature: 30–300 °C; pressure: 1–2000 bars). The equation has been utilized to quantify the limiting density, ρ0, in (1) since it describes the density of PSF at bulk condition, whereby the confinement levels off and becomes not apparent.
 | (7) |
As for parameter b in (1), it is related to relaxation of the PSF polymeric film, which has been proposed to be an effect of operating temperature based upon the Vogel–Fulcher–Tammann (VFT) equation,65 such as that depicted in (8).
 | (8) |
 | (9) |
 | (10) |
 describes the excess molar expansion of melt with respect to the glassy state polymer.
Thereby, by explicitly defining that merely TSc parameters in (9) are changing with operating temperature and simplification that the excess heat capacity in the temperature integral term of (10) varies inversely with reciprocal of temperature in accordance to a constant K (e.g.  ),68–70 the Pressure Extended Adams Gibbs (PEAG) expression that incorporates the effect of temperature and pressure to relaxation has been proposed, such as that shown in (11) and (12). The function of ΔCP(T) as a reciprocal of operating temperature, which has been originally proposed in work by Angell & Bressel (1972) by fitting the empirical equation to experimental observation, has been employed in present work.71 The correlation has been commonly used to describe the dependency of ΔCP with respect to T for a wide variety of materials,68,69,72 which has been further tested and verified for polymeric system by Prevosto et al. (2004)70 and exclusively for PSF polymer in work by Zoller (1978).63 The verification reaffirms its applicability to define ΔCP(T) as a function of temperature in present study.
 | (11) |
 | (12) |
In this work, the temperature and pressure dependent material parameter, b, is correlated to the reciprocal of relaxation time, τ(T,P), such as that shown in (13), which has been calculated from (11) and (12), and b0, which is the material constant at a particular standard operating condition.
 | (13) |
The excess molar expansion term,  , has been computed based on Tait's-Zoller expression for PSF polymer, as shown in (14).
 | (14) |
In addition, the pre-exponential factor Ai in Doolittle correlation73,74 as shown in (4) as well as dual-mode sorption model parameters bi and kDi in (5) has been reported to exhibit Hoff–Arrhenius correlation with operating temperature,75,76 such as that shown in (15)–(17). This is because it has been commonly acknowledged that the solubility coefficient is described as an exponential function of temperature.
 | (15) |
 | (16) |
 | (17) |
 | (18) |
 | (19) |
 | (20) |
 | (21) |
 | (22) |
2.5 Model validation
With regards to the prediction of proposed empirical equations to simulated data, the goodness of fit has been quantified using the coefficient of determination (R2) in (23).
 | (23) |
 denotes the average of simulated data, xmodel corresponds to the prediction from the empirical equation, while
  represents the average of the model prediction. On the other hand, in order to demonstrate the accuracy of the simulated data as compared to actual experimental observation, a metric of mean absolute percentage error (MAPE) has been used to quantify the deviation between the simulated and experimental conditions as provided in (24).
 | (24) |
3. Results and discussion
This section discusses the findings from present study. Initially the molecular simulation procedure using SCMUF at varying operating temperatures, as outlined in Fig. S.1,† has been discussed.25 In short, xenon crystals have been used as confining layers on top and bottom surfaces of varying number of PSF polymeric chains. The increasing number of PSF chains contributes to increment in ultrathin film thickness. Subsequently, the structure has been subjected to preliminary molecular treatment to confine the chains towards centre of the hypothetical box. The vacuum space left behind has been cropped off with rearrangement of polymer chain within boundary of the simulation cell prior to second stage molecular treatment until successive NPT–NVT molecular dynamics are within predefined tolerance. As highlighted earlier, the molecular treatment procedures are controlled at designated operating temperature and pressure using Nose thermostat and Berendsen barostat respectively. For film specification that exceeds memory constraint of Materials Studio, layer function of the simulation software has been adapted to combine smaller membrane structure before being subjected to the same successive NPT–NVT molecular dynamics.The evolution of energy and specifications of the ultrathin polymeric film throughout molecular dynamics is initially observed to ensure the structures have achieved thermodynamic equilibration state. Subsequently, the validity of the molecular dynamics simulation procedure to generate ultrathin polymeric films at varying operating conditions have been validated, followed by elucidation of physical properties evolution accompanying the change in operating temperature and pressure. Subsequently, gas solubility and diffusivity of ultrathin PSF film at a particular dimension have been studied to obtain physical parameters of the developed empirical model. Validity of the developed empirical model will also be demonstrated through comparison with published experimental data interpolated at 303.15 K, which has been subsequently employed to predict gas transport properties over a wide range of film specifications (100–5000 Å), temperatures (298.15 to 328.15 K) and pressures (2 to 50 bar).
3.1 Molecular simulation of ultrathin polysulfone (PSF) films
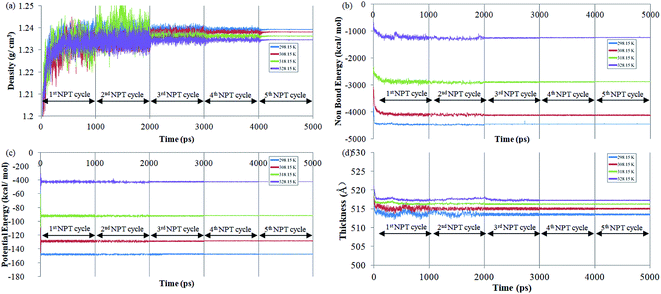
The effect of operating temperature to the evolution of density, non-bonded and potential energy, and cell thickness versus time step for ultrathin PSF membrane film with a thickness of ∼500 Å has been explained at 298.15 K, 308.15 K, 318.15 K and 328.15 K to study the impact of temperature towards physical properties of the film upon confinement as shown in Fig. 1. It is found that all the parameters converged to a specific value with decreased noises after each cycle of successive NPT–NVT molecular treatment, which indicates that equilibration has been achieved.The NPT (isobaric–isothermal) molecular dynamic procedure is conducted by regulating the operating temperature and pressure at designated values, while volume and energy of the subjected simulation cell is allowed to vary during the quest of determining the most probable configuration with the lowest energy. On the other hand, the NVT (canonical) molecular dynamics is aimed to relax the simulated structure at the targeted cell specification and operating temperature to a stabilized configuration while removing any internal inherent inhomogeneities from previous NPT. It is found that the density experiences a decrement when temperature rises, which is consistent to observation reported in experimental work for glassy polymeric membrane.63,64 The observation can be rationalized through higher activation energy,63,64 whereby the mobility of the polymeric chain is enhanced. In this context, in the vicinity of greater operating temperature, the higher energetic state allows them to break the attraction force rather than being bind together. The looser arrangement of polymeric atoms within the membrane matrix further constitutes a reduction in density. It is seen from the figure that potential and non-bonded energy are correlated to the operating temperature. The PSF structure at the lower operating temperature demonstrates larger negative values in comparison to its counterpart at the higher temperature. The observation has been rationalized through lower activation energy for mobility, which indicates a more stabilized structure. In addition, the lower energy state also causes the polymeric atoms to be in close proximity with respect to one another, which consequently leads to larger attraction energy between them. The claim of the larger distance between polymeric chains has been reaffirmed through observation of increment in cell thickness with enhancement in temperature since a larger simulation box volume is required to accommodate the chains.
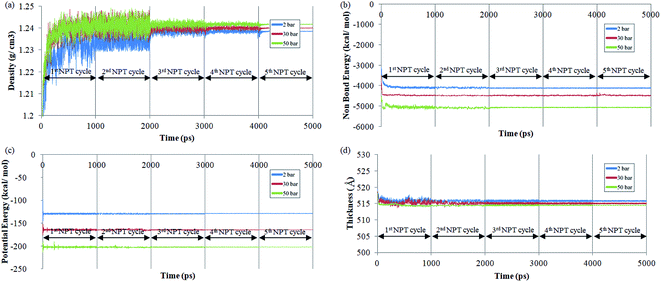
The effect of operating pressure to molecular dynamics characteristic of ∼500 Å PSF membrane film has been investigated, whereby the examples at 2 bars, 30 bars and 50 bars have been provided in Fig. 2, in order to elucidate the impact of pressure towards properties of ultrathin structure upon confinement. It is found that after exhibiting the characteristic of thermodynamic equilibration demonstrated through minimal fluctuations in the 5th NPT–NVT molecular cycle treatment, density of the ultrathin PSF membrane is found to be increasing with increment with operating pressure, which has been rationalized through larger confinement impact that suppresses the ultrathin glassy membrane to smaller vicinity. The observation is consistent with the reported trend that elucidates the effect of operating pressure on bulk membrane.63,64,70
The parameters are found to inherit larger negative values with increment in operating pressure from the aspect of potential and non-bonded energy. The observation has been attributed to densification at higher operating pressure, which constitutes to closer proximity with neighboring atoms, and therefore stronger interaction energy. In addition, the more densified structure at higher operating pressure is also thermodynamically more stable due to its lower flexibility for chain mobility in the more confined volume, which constitutes to larger negative values in structure operated at higher pressure. The cell dimension is found to be smaller in ultrathin polymeric membranes exposed to higher operating pressure since the high pressure induces a higher stress77 to compact the film to a smaller specification.
3.2 Physical property analysis
After determining that the simulated ultrathin polymeric membranes have attained theoretically reasonable structures and achieved thermodynamic equilibration state, physical properties data have been collected based upon the simulated membranes in order to elucidate morphological changes associated to changes in the operating temperatures and pressures. To demonstrate the applicability of the simulated model for the study of gas transport behaviour in the subsequent section, physical properties of the simulated structure has been compared with published experiment data and empirical equation characterizing effect of thickness upon confinement towards properties of the ultrathin film. Structural density is the parameter being tested since they are the most widely reported properties that are affected by thickness-dependent confinement in previously published works.54,783.3 Specific volume (simulation data validation)
The specific volume of ultrathin PSF polymeric membranes at varying thicknesses, operating temperatures and pressure of 2 bars have been simulated and tabulated in Fig. 3. The specific volume as an effect of thickness upon confinement has been fitted with the published empirical equation, as shown in (1) to verify accuracy of the simulation data. The fitted parameters have been summarized in Table 2. The computation of molecular simulation has been performed from 3 initial configurations, and the average value has been reported to ensure statistical certainty. The specific volume data under varying film thicknesses and operating temperatures has been summarized in Table S.1 of ESI.†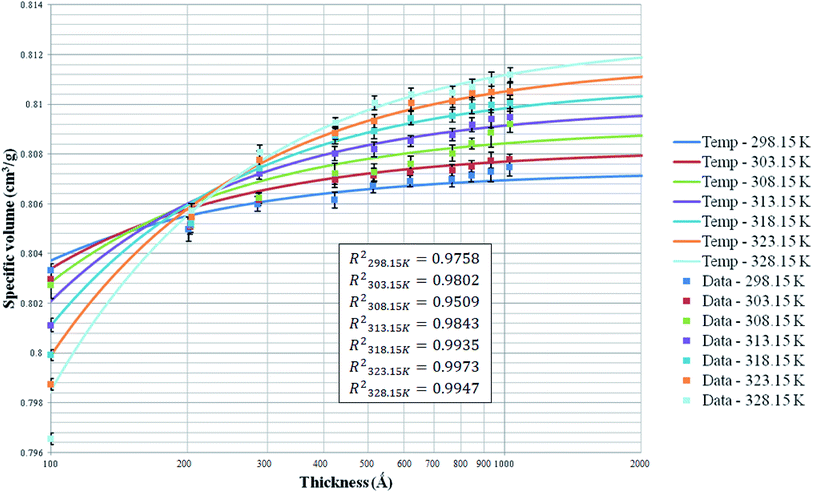 | ||
| Fig. 3 Effect of film thickness on the specific volume of the polymeric film, fitted with empirical eqn (1) at different operating temperatures (solid line: prediction by the empirical equation; close data: simulation data from simulation work). | ||
| Temperature (K) | ρ0 (g cm−3) | b (cm3 Å g−1) |
|---|---|---|
| 298.15 | 1.2387 | 0.3577 |
| 303.15 | 1.2373 | 0.4775 |
| 308.15 | 1.2360 | 0.6155 |
| 313.15 | 1.2347 | 0.7829 |
| 318.15 | 1.2333 | 0.9690 |
| 323.15 | 1.2320 | 1.1772 |
| 328.15 | 1.2307 | 1.4069 |
The coefficient of determination (R2), such as that shown in (23), has been employed to quantify goodness of fit to the correlation in (1). It is found that the empirical equation is able to provide a satisfactory description of the simulated data over a broad range of film thicknesses at different operating temperatures (0.951 < R2 < 0.998).
In addition, from Fig. 3, it is depicted that specific volume at all operating temperature exhibit similar behavior, whereby it increases with thickness due to diminishing of confinement. The contention has been attributed to enhanced mobility of polymeric chains within the thinner film when it is located in the vicinity closer to the free surface boundary since a shorter distance is travelled for lost of free volume, further promoting the formation of a more equilibrated and hence denser structure.79 In accordance with the model prediction and simulated data, it is found that enhancement in specific volume when film specification is increased has been typically perceptible under condition of thin film thickness. The observation has been explained through enhancement in surface effect to relaxation of polymeric chains attributed to the closer proximity and shorter distance that enables ease of mobility of free volumes to the free surface.80 On the other hand, densification effect levels off when film thickness increases beneath 1000 Å, whereby analogous experimental observation has been reported by Shishatskii et al. (1996).54 In their work, they have measured density of polymers, e.g. PVTMS and PTMSNB, of varying thicknesses at the laboratory scale and observed a similar trend with regards to the impact of thickness to polymer density.
With respect to the effect of operating temperature, it is found that for polymeric membrane >200 Å, specific volume at higher operating temperature is depicted to demonstrate a greater value consistently as compared to its counterpart at a lower temperature, which has been explained through the higher activation energy for expansion.81 As for ultrathin film <200 Å, the opposite trend has been observed, whereby the specific volume is the highest at 298.15 K and progressively decreases as the operating temperature is further increased. The trend has been captured successfully by the empirical equation. The observation can be rationalized through surface effect with higher mobility at greater operating temperature, which further enhances lost of free volume to the surface within ultrathin PSF films of small dimension. This surpasses the effect of higher mobility to break attraction energy between the PSF polymer atoms at thicker films and higher operating temperature. It is also found that the effect of temperature is apparent within PSF ultrathin PSF films <200 Å, whereby the difference converges and then becomes progressively larger when the thickness of the PSF film is further enhanced. The suggestion supports the proposal that higher mobility of free volume to escape to the film surface and high mobility to escape the attractive force between polymeric atoms are two competitive effects at varying operating temperatures, whereby the former is dominant within smaller structure, becomes less apparent when both competitive effects counteract each another, and switch to dominancy of higher mobility for polymeric chains to overcome interaction between polymer chains when the thickness is further increased.
| Thickness (Å) | Number of PSF chains | Number of atoms | Cell dimensions (Å3) | Occupied volume, vo (Å3) | Free volume, vf (Å3) | Total volume, vg (Å3) | FFV (MS) | FFV (Bondi's) |
|---|---|---|---|---|---|---|---|---|
| ∼100 | 2 | 2164 | 16.12 × 16.12 × 90.55 | 19![[thin space (1/6-em)]](https://www.rsc.org/images/entities/char_2009.gif) 990.03 990.03 |
3539.78 | 23![[thin space (1/6-em)]](https://www.rsc.org/images/entities/char_2009.gif) 529.82 529.82 |
0.1504 | 0.13704 |
| ∼200 | 4 | 4328 | 14.89 × 14.89 × 203.37 | 37![[thin space (1/6-em)]](https://www.rsc.org/images/entities/char_2009.gif) 530.68 530.68 |
7558.91 | 45![[thin space (1/6-em)]](https://www.rsc.org/images/entities/char_2009.gif) 089.59 089.59 |
0.1676 | 0.14271 |
| ∼300 | 6 | 6492 | 15.73 × 15.73 × 287.99 | 59![[thin space (1/6-em)]](https://www.rsc.org/images/entities/char_2009.gif) 012.96 012.96 |
12![[thin space (1/6-em)]](https://www.rsc.org/images/entities/char_2009.gif) 245.25 245.25 |
71![[thin space (1/6-em)]](https://www.rsc.org/images/entities/char_2009.gif) 258.20 258.20 |
0.1718 | 0.14507 |
| ∼400 | 8 | 8656 | 15.00 × 15.00 × 422.87 | 78![[thin space (1/6-em)]](https://www.rsc.org/images/entities/char_2009.gif) 385.40 385.40 |
16![[thin space (1/6-em)]](https://www.rsc.org/images/entities/char_2009.gif) 760.35 760.35 |
95![[thin space (1/6-em)]](https://www.rsc.org/images/entities/char_2009.gif) 145.75 145.75 |
0.1762 | 0.14645 |
| ∼500 | 10 | 10![[thin space (1/6-em)]](https://www.rsc.org/images/entities/char_2009.gif) 820 820 |
15.18 × 15.18 × 515.90 | 97![[thin space (1/6-em)]](https://www.rsc.org/images/entities/char_2009.gif) 889.47 889.47 |
20![[thin space (1/6-em)]](https://www.rsc.org/images/entities/char_2009.gif) 990.61 990.61 |
118![[thin space (1/6-em)]](https://www.rsc.org/images/entities/char_2009.gif) 880.08 880.08 |
0.1766 | 0.14664 |
| ∼600 | 12 | 12![[thin space (1/6-em)]](https://www.rsc.org/images/entities/char_2009.gif) 984 984 |
15.16 × 15.16 × 621.32 | 117![[thin space (1/6-em)]](https://www.rsc.org/images/entities/char_2009.gif) 386.88 386.88 |
25![[thin space (1/6-em)]](https://www.rsc.org/images/entities/char_2009.gif) 408.36 408.36 |
142![[thin space (1/6-em)]](https://www.rsc.org/images/entities/char_2009.gif) 795.24 795.24 |
0.1779 | 0.14720 |
| ∼700 | 14 | 15![[thin space (1/6-em)]](https://www.rsc.org/images/entities/char_2009.gif) 148 148 |
14.74 × 14.74 × 766.96 | 136![[thin space (1/6-em)]](https://www.rsc.org/images/entities/char_2009.gif) 952.51 952.51 |
29![[thin space (1/6-em)]](https://www.rsc.org/images/entities/char_2009.gif) 683.05 683.05 |
166![[thin space (1/6-em)]](https://www.rsc.org/images/entities/char_2009.gif) 635.56 635.56 |
0.1781 | 0.14728 |
| ∼800 | 16 | 17![[thin space (1/6-em)]](https://www.rsc.org/images/entities/char_2009.gif) 312 312 |
15.00 × 15.00 × 847.11 | 156![[thin space (1/6-em)]](https://www.rsc.org/images/entities/char_2009.gif) 369.54 369.54 |
34![[thin space (1/6-em)]](https://www.rsc.org/images/entities/char_2009.gif) 230.21 230.21 |
190![[thin space (1/6-em)]](https://www.rsc.org/images/entities/char_2009.gif) 599.75 599.75 |
0.1796 | 0.14771 |
| ∼900 | 18 | 19![[thin space (1/6-em)]](https://www.rsc.org/images/entities/char_2009.gif) 476 476 |
15.14 × 15.14 × 933.87 | 175![[thin space (1/6-em)]](https://www.rsc.org/images/entities/char_2009.gif) 587.17 587.17 |
38![[thin space (1/6-em)]](https://www.rsc.org/images/entities/char_2009.gif) 474.14 474.14 |
214![[thin space (1/6-em)]](https://www.rsc.org/images/entities/char_2009.gif) 061.31 061.31 |
0.1797 | 0.14774 |
| ∼1000 | 20 | 21![[thin space (1/6-em)]](https://www.rsc.org/images/entities/char_2009.gif) 640 640 |
15.33 × 15.33 × 1027.11 | 197![[thin space (1/6-em)]](https://www.rsc.org/images/entities/char_2009.gif) 909.98 909.98 |
43![[thin space (1/6-em)]](https://www.rsc.org/images/entities/char_2009.gif) 470.01 470.01 |
241![[thin space (1/6-em)]](https://www.rsc.org/images/entities/char_2009.gif) 379.99 379.99 |
0.1801 | 0.14783 |
| Thickness (Å) | Number of PSF chains | Number of atoms | Cell dimensions (Å3) | Occupied volume, vo (Å3) | Free volume, vf (Å3) | Total volume, vg (Å3) | FFV (MS) | FFV (Bondi's) |
|---|---|---|---|---|---|---|---|---|
| ∼100 | 2 | 2164 | 16.13 × 16.13 × 90.01 | 20![[thin space (1/6-em)]](https://www.rsc.org/images/entities/char_2009.gif) 156.36 156.36 |
3262.16 | 23![[thin space (1/6-em)]](https://www.rsc.org/images/entities/char_2009.gif) 418.52 418.52 |
0.1393 | 0.13339 |
| ∼200 | 4 | 4328 | 14.86 × 14.86 × 204.33 | 37![[thin space (1/6-em)]](https://www.rsc.org/images/entities/char_2009.gif) 533.96 533.96 |
7586.11 | 45![[thin space (1/6-em)]](https://www.rsc.org/images/entities/char_2009.gif) 120.07 120.07 |
0.1681 | 0.14325 |
| ∼300 | 6 | 6492 | 15.70 × 15.70 × 288.96 | 58![[thin space (1/6-em)]](https://www.rsc.org/images/entities/char_2009.gif) 831.81 831.81 |
12![[thin space (1/6-em)]](https://www.rsc.org/images/entities/char_2009.gif) 393.94 393.94 |
71![[thin space (1/6-em)]](https://www.rsc.org/images/entities/char_2009.gif) 225.75 225.75 |
0.1740 | 0.14573 |
| ∼400 | 8 | 8656 | 14.99 × 14.99 × 423.78 | 78![[thin space (1/6-em)]](https://www.rsc.org/images/entities/char_2009.gif) 329.75 329.75 |
16![[thin space (1/6-em)]](https://www.rsc.org/images/entities/char_2009.gif) 893.66 893.66 |
95![[thin space (1/6-em)]](https://www.rsc.org/images/entities/char_2009.gif) 223.41 223.41 |
0.1774 | 0.14698 |
| ∼500 | 10 | 10![[thin space (1/6-em)]](https://www.rsc.org/images/entities/char_2009.gif) 820 820 |
15.18 × 15.18 × 516.79 | 97![[thin space (1/6-em)]](https://www.rsc.org/images/entities/char_2009.gif) 611.50 611.50 |
21![[thin space (1/6-em)]](https://www.rsc.org/images/entities/char_2009.gif) 473.66 473.66 |
119![[thin space (1/6-em)]](https://www.rsc.org/images/entities/char_2009.gif) 085.16 085.16 |
0.1803 | 0.14784 |
| ∼600 | 12 | 12![[thin space (1/6-em)]](https://www.rsc.org/images/entities/char_2009.gif) 984 984 |
15.15 × 15.15 × 622.34 | 116![[thin space (1/6-em)]](https://www.rsc.org/images/entities/char_2009.gif) 908.71 908.71 |
25![[thin space (1/6-em)]](https://www.rsc.org/images/entities/char_2009.gif) 932.32 932.32 |
142![[thin space (1/6-em)]](https://www.rsc.org/images/entities/char_2009.gif) 841.03 841.03 |
0.1815 | 0.14818 |
| ∼700 | 14 | 15![[thin space (1/6-em)]](https://www.rsc.org/images/entities/char_2009.gif) 148 148 |
14.74 × 14.74 × 767.75 | 136![[thin space (1/6-em)]](https://www.rsc.org/images/entities/char_2009.gif) 471.61 471.61 |
30![[thin space (1/6-em)]](https://www.rsc.org/images/entities/char_2009.gif) 335.59 335.59 |
166![[thin space (1/6-em)]](https://www.rsc.org/images/entities/char_2009.gif) 807.20 807.20 |
0.1819 | 0.14826 |
| ∼800 | 16 | 17![[thin space (1/6-em)]](https://www.rsc.org/images/entities/char_2009.gif) 312 312 |
15.00 × 15.00 × 848.02 | 156![[thin space (1/6-em)]](https://www.rsc.org/images/entities/char_2009.gif) 005.93 005.93 |
34![[thin space (1/6-em)]](https://www.rsc.org/images/entities/char_2009.gif) 798.57 798.57 |
190![[thin space (1/6-em)]](https://www.rsc.org/images/entities/char_2009.gif) 804.50 804.50 |
0.1824 | 0.14852 |
| ∼900 | 18 | 19![[thin space (1/6-em)]](https://www.rsc.org/images/entities/char_2009.gif) 476 476 |
15.15 × 15.15 × 934.87 | 175![[thin space (1/6-em)]](https://www.rsc.org/images/entities/char_2009.gif) 173.80 173.80 |
39![[thin space (1/6-em)]](https://www.rsc.org/images/entities/char_2009.gif) 116.73 116.73 |
214![[thin space (1/6-em)]](https://www.rsc.org/images/entities/char_2009.gif) 290.53 290.53 |
0.1825 | 0.14877 |
| ∼1000 | 20 | 21![[thin space (1/6-em)]](https://www.rsc.org/images/entities/char_2009.gif) 640 640 |
15.33 × 15.33 × 1027.98 | 196![[thin space (1/6-em)]](https://www.rsc.org/images/entities/char_2009.gif) 888.51 888.51 |
44![[thin space (1/6-em)]](https://www.rsc.org/images/entities/char_2009.gif) 695.93 695.93 |
241![[thin space (1/6-em)]](https://www.rsc.org/images/entities/char_2009.gif) 584.45 584.45 |
0.1850 | 0.14903 |
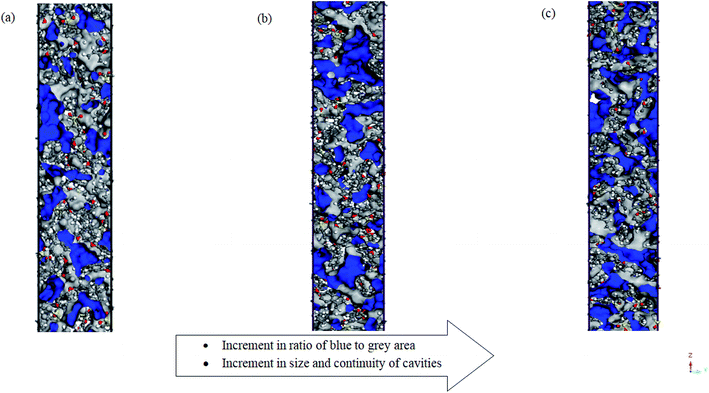
Other than total free volume as a whole, it is also observed from in Fig. 4 that the cavities at higher operating temperature are more continuous and bigger in sizes. Consistently, from Tables 3 and 4, merely the ∼100 Å PSF structure demonstrates a decrement in FFVs (MS and Bondi's) with increment in operating temperature due to dominancy of intrachain bonding within the confined structure.
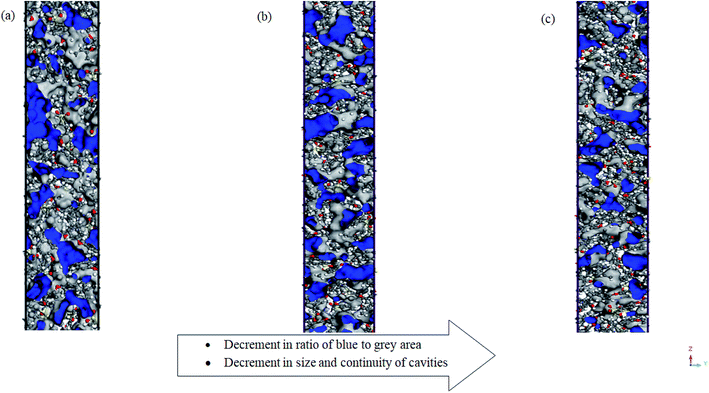
Alternatively, the effect of operating pressure to relaxation behaviour of polymeric chains has been investigated through the employment of the same Connolly surface assembly, with the computed data for 30 bars and 50 bars tabulated in Tables 5 and 6 respectively. In addition, the 2-dimensions view of a ∼500 Å ultrathin PSF films at different operating pressures of 2 bars, 30 bars and 50 bars has been provided in Fig. 5. It is found that the free volume decreases with increment in operating pressure since the polymeric chains are located within closer proximity when exposed to compression. The difference is exceptionally perceptible within the thinner structure, which has been attributed to enhanced confinement when the interfacial region is closer and occupies a larger fraction of the ultrathin film. Viewing from the aspect of the effect of operating pressure to cavity sizes and distribution within PSF ultrathin films as demonstrated in Fig. 5, it is decreasing regardless of being the ratio of blue to grey ratio or size and continuity of cavities. The closer vicinity among polymeric chains forms smaller void channels in between them.
| Thickness (Å) | Number of PSF chains | Number of atoms | Cell dimensions (Å3) | Occupied volume, vo (Å3) | Free volume, vf (Å3) | Total volume, vg (Å3) | FFV (MS) | FFV (Bondi's) |
|---|---|---|---|---|---|---|---|---|
| ∼100 | 2 | 2164 | 16.02 × 16.02 × 91.27 | 20![[thin space (1/6-em)]](https://www.rsc.org/images/entities/char_2009.gif) 066.99 066.99 |
3356.58 | 23![[thin space (1/6-em)]](https://www.rsc.org/images/entities/char_2009.gif) 423.57 423.57 |
0.1433 | 0.13360 |
| ∼200 | 4 | 4328 | 14.89 × 14.89 × 202.94 | 37![[thin space (1/6-em)]](https://www.rsc.org/images/entities/char_2009.gif) 793.10 793.10 |
7201.16 | 44![[thin space (1/6-em)]](https://www.rsc.org/images/entities/char_2009.gif) 994.25 994.25 |
0.1600 | 0.14049 |
| ∼300 | 6 | 6492 | 15.72 × 15.72 × 287.31 | 59![[thin space (1/6-em)]](https://www.rsc.org/images/entities/char_2009.gif) 239.82 239.82 |
11![[thin space (1/6-em)]](https://www.rsc.org/images/entities/char_2009.gif) 759.77 759.77 |
70![[thin space (1/6-em)]](https://www.rsc.org/images/entities/char_2009.gif) 999.59 999.59 |
0.1656 | 0.14208 |
| ∼400 | 8 | 8656 | 14.99 × 14.99 × 422.13 | 78![[thin space (1/6-em)]](https://www.rsc.org/images/entities/char_2009.gif) 809.60 809.60 |
16![[thin space (1/6-em)]](https://www.rsc.org/images/entities/char_2009.gif) 043.05 043.05 |
94![[thin space (1/6-em)]](https://www.rsc.org/images/entities/char_2009.gif) 852.65 852.65 |
0.1691 | 0.14355 |
| ∼500 | 10 | 10![[thin space (1/6-em)]](https://www.rsc.org/images/entities/char_2009.gif) 820 820 |
15.17 × 15.17 × 515.22 | 98![[thin space (1/6-em)]](https://www.rsc.org/images/entities/char_2009.gif) 409.40 409.40 |
20![[thin space (1/6-em)]](https://www.rsc.org/images/entities/char_2009.gif) 157.61 157.61 |
118![[thin space (1/6-em)]](https://www.rsc.org/images/entities/char_2009.gif) 567.01 567.01 |
0.1700 | 0.14404 |
| ∼600 | 12 | 12![[thin space (1/6-em)]](https://www.rsc.org/images/entities/char_2009.gif) 984 984 |
15.14 × 15.14 × 620.42 | 117![[thin space (1/6-em)]](https://www.rsc.org/images/entities/char_2009.gif) 972.34 972.34 |
24![[thin space (1/6-em)]](https://www.rsc.org/images/entities/char_2009.gif) 240.08 240.08 |
142![[thin space (1/6-em)]](https://www.rsc.org/images/entities/char_2009.gif) 212.42 212.42 |
0.1704 | 0.14439 |
| ∼700 | 14 | 15![[thin space (1/6-em)]](https://www.rsc.org/images/entities/char_2009.gif) 148 148 |
14.73 × 14.73 × 765.96 | 137![[thin space (1/6-em)]](https://www.rsc.org/images/entities/char_2009.gif) 711.71 711.71 |
28![[thin space (1/6-em)]](https://www.rsc.org/images/entities/char_2009.gif) 480.85 480.85 |
166![[thin space (1/6-em)]](https://www.rsc.org/images/entities/char_2009.gif) 192.56 192.56 |
0.1714 | 0.14484 |
| ∼800 | 16 | 17![[thin space (1/6-em)]](https://www.rsc.org/images/entities/char_2009.gif) 312 312 |
14.98 × 14.98 × 847.01 | 157![[thin space (1/6-em)]](https://www.rsc.org/images/entities/char_2009.gif) 358.76 358.76 |
32![[thin space (1/6-em)]](https://www.rsc.org/images/entities/char_2009.gif) 710.62 710.62 |
190![[thin space (1/6-em)]](https://www.rsc.org/images/entities/char_2009.gif) 069.38 069.38 |
0.1721 | 0.14504 |
| ∼900 | 18 | 19![[thin space (1/6-em)]](https://www.rsc.org/images/entities/char_2009.gif) 476 476 |
15.13 × 15.13 × 932.93 | 176![[thin space (1/6-em)]](https://www.rsc.org/images/entities/char_2009.gif) 772.02 772.02 |
36![[thin space (1/6-em)]](https://www.rsc.org/images/entities/char_2009.gif) 791.42 791.42 |
213![[thin space (1/6-em)]](https://www.rsc.org/images/entities/char_2009.gif) 563.44 563.44 |
0.1723 | 0.14514 |
| ∼1000 | 20 | 21![[thin space (1/6-em)]](https://www.rsc.org/images/entities/char_2009.gif) 640 640 |
15.31 × 15.31 × 1026.28 | 198![[thin space (1/6-em)]](https://www.rsc.org/images/entities/char_2009.gif) 943.74 943.74 |
41![[thin space (1/6-em)]](https://www.rsc.org/images/entities/char_2009.gif) 612.29 612.29 |
240![[thin space (1/6-em)]](https://www.rsc.org/images/entities/char_2009.gif) 556.03 556.03 |
0.1730 | 0.14540 |
| Thickness (Å) | Number of PSF chains | Number of atoms | Cell dimensions (Å3) | Occupied volume, vo (Å3) | Free volume, vf (Å3) | Total volume, vg (Å3) | FFV (MS) | FFV (Bondi's) |
|---|---|---|---|---|---|---|---|---|
| ∼100 | 2 | 2164 | 16.01 × 16.01 × 90.88 | 20![[thin space (1/6-em)]](https://www.rsc.org/images/entities/char_2009.gif) 197.51 197.51 |
3096.86 | 23![[thin space (1/6-em)]](https://www.rsc.org/images/entities/char_2009.gif) 294.37 294.37 |
0.1329 | 0.12887 |
| ∼200 | 4 | 4328 | 14.89 × 14.89 × 202.56 | 37![[thin space (1/6-em)]](https://www.rsc.org/images/entities/char_2009.gif) 966.52 966.52 |
6943.48 | 44![[thin space (1/6-em)]](https://www.rsc.org/images/entities/char_2009.gif) 910.00 910.00 |
0.1546 | 0.13877 |
| ∼300 | 6 | 6492 | 15.71 × 15.71 × 287.09 | 59![[thin space (1/6-em)]](https://www.rsc.org/images/entities/char_2009.gif) 450.95 450.95 |
11![[thin space (1/6-em)]](https://www.rsc.org/images/entities/char_2009.gif) 404.04 404.04 |
70![[thin space (1/6-em)]](https://www.rsc.org/images/entities/char_2009.gif) 854.99 854.99 |
0.1609 | 0.14079 |
| ∼400 | 8 | 8656 | 14.96 × 14.96 × 422.83 | 79![[thin space (1/6-em)]](https://www.rsc.org/images/entities/char_2009.gif) 085.97 085.97 |
15![[thin space (1/6-em)]](https://www.rsc.org/images/entities/char_2009.gif) 544.06 544.06 |
94![[thin space (1/6-em)]](https://www.rsc.org/images/entities/char_2009.gif) 630.03 630.03 |
0.1643 | 0.14193 |
| ∼500 | 10 | 10![[thin space (1/6-em)]](https://www.rsc.org/images/entities/char_2009.gif) 820 820 |
15.16 × 15.16 × 514.91 | 98![[thin space (1/6-em)]](https://www.rsc.org/images/entities/char_2009.gif) 613.95 613.95 |
19![[thin space (1/6-em)]](https://www.rsc.org/images/entities/char_2009.gif) 725.55 725.55 |
118![[thin space (1/6-em)]](https://www.rsc.org/images/entities/char_2009.gif) 339.50 339.50 |
0.1667 | 0.14276 |
| ∼600 | 12 | 12![[thin space (1/6-em)]](https://www.rsc.org/images/entities/char_2009.gif) 984 984 |
15.13 × 15.13 × 620.19 | 118![[thin space (1/6-em)]](https://www.rsc.org/images/entities/char_2009.gif) 097.68 097.68 |
23![[thin space (1/6-em)]](https://www.rsc.org/images/entities/char_2009.gif) 874.29 874.29 |
141![[thin space (1/6-em)]](https://www.rsc.org/images/entities/char_2009.gif) 971.97 971.97 |
0.1682 | 0.14328 |
| ∼700 | 14 | 15![[thin space (1/6-em)]](https://www.rsc.org/images/entities/char_2009.gif) 148 148 |
14.72 × 14.72 × 765.47 | 137![[thin space (1/6-em)]](https://www.rsc.org/images/entities/char_2009.gif) 853.03 853.03 |
28![[thin space (1/6-em)]](https://www.rsc.org/images/entities/char_2009.gif) 007.78 007.78 |
165![[thin space (1/6-em)]](https://www.rsc.org/images/entities/char_2009.gif) 860.81 860.81 |
0.1689 | 0.14356 |
| ∼800 | 16 | 17![[thin space (1/6-em)]](https://www.rsc.org/images/entities/char_2009.gif) 312 312 |
14.97 × 14.97 × 846.64 | 157![[thin space (1/6-em)]](https://www.rsc.org/images/entities/char_2009.gif) 588.60 588.60 |
32![[thin space (1/6-em)]](https://www.rsc.org/images/entities/char_2009.gif) 141.94 141.94 |
189![[thin space (1/6-em)]](https://www.rsc.org/images/entities/char_2009.gif) 730.54 730.54 |
0.1694 | 0.14381 |
| ∼900 | 18 | 19![[thin space (1/6-em)]](https://www.rsc.org/images/entities/char_2009.gif) 476 476 |
15.12 × 15.12 × 932.69 | 177![[thin space (1/6-em)]](https://www.rsc.org/images/entities/char_2009.gif) 008.07 008.07 |
36![[thin space (1/6-em)]](https://www.rsc.org/images/entities/char_2009.gif) 218.29 218.29 |
213![[thin space (1/6-em)]](https://www.rsc.org/images/entities/char_2009.gif) 226.36 226.36 |
0.1699 | 0.14402 |
| ∼1000 | 20 | 21![[thin space (1/6-em)]](https://www.rsc.org/images/entities/char_2009.gif) 640 640 |
15.31 × 15.31 × 1025.89 | 199![[thin space (1/6-em)]](https://www.rsc.org/images/entities/char_2009.gif) 515.64 515.64 |
40![[thin space (1/6-em)]](https://www.rsc.org/images/entities/char_2009.gif) 948.97 948.97 |
240![[thin space (1/6-em)]](https://www.rsc.org/images/entities/char_2009.gif) 464.62 464.62 |
0.1703 | 0.14429 |
3.4 Gas transport properties
The gas transport properties of O2 and N2 have been simulated for ∼500 Å PSF ultrathin film at varying operating temperature and pressure, which is consisted of gas diffusivity, gas solubility, gas permeance and O2/N2 gas selectivity. The gas transport properties are discussed in this section.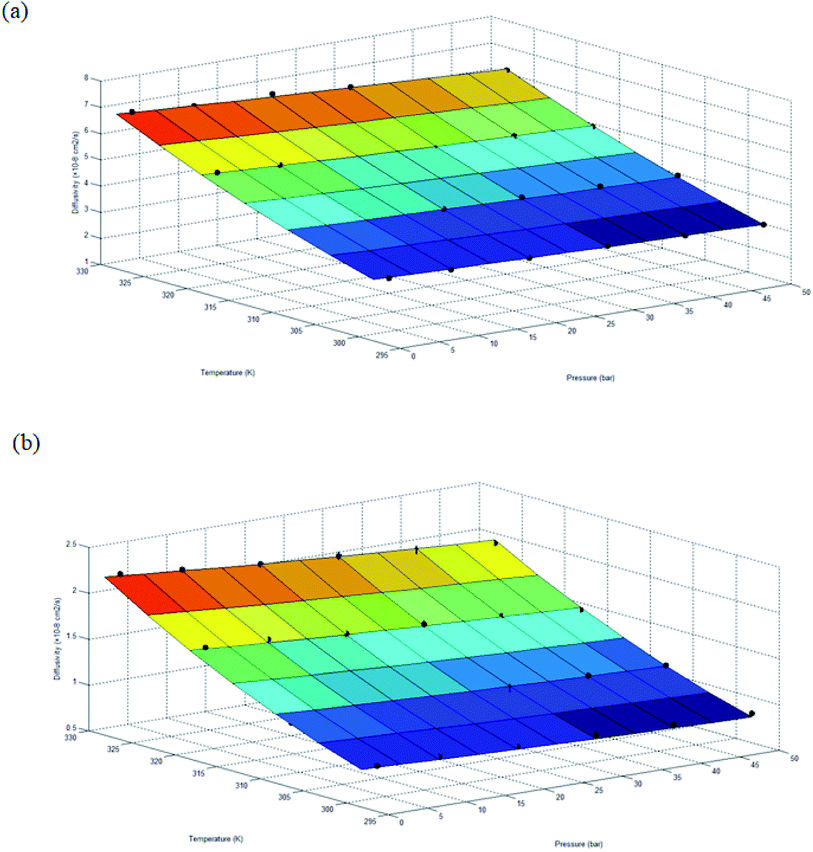 | ||
| Fig. 6 Diffusivity of ∼500 Å ultrathin PSF films under varying operating temperature and pressure for (a) oxygen (R2 = 0.9940) and (b) nitrogen (R2 = 0.9986), surface plot characterizes empirical equation based upon expression (18) with fitted parameters in Table 7. | ||
Based on the physical parameters summarized in Table 7, the effect of thickness upon confinement towards the gas diffusivity under different operating temperatures and pressures has been elucidated in Fig. 7 and S.3 given in ESI,† respectively for O2 and N2. It is found that the gas diffusivity increases with increment in film thickness attributed to increment in void space that forms pathways for the trajectory of gas molecules. Consistently, the gas diffusivity decreases with increment in operating pressure for all film thickness and operating temperature, which has been rationalized through compaction of void spaces at higher pressure, further reducing the free vicinity for movement of gas molecules.82 The observation is consistent with published literature that reported a decrement in diffusivity when operating pressure is increased for non-plasticizing gas molecules.82 It is found that for lower operating pressure, the gas diffusivity is consistently higher at greater operating temperature, which has been realized through the availability of bigger void channels and intensification of gas molecules mobility when molecules exhibit higher activation energy for diffusional jump.83
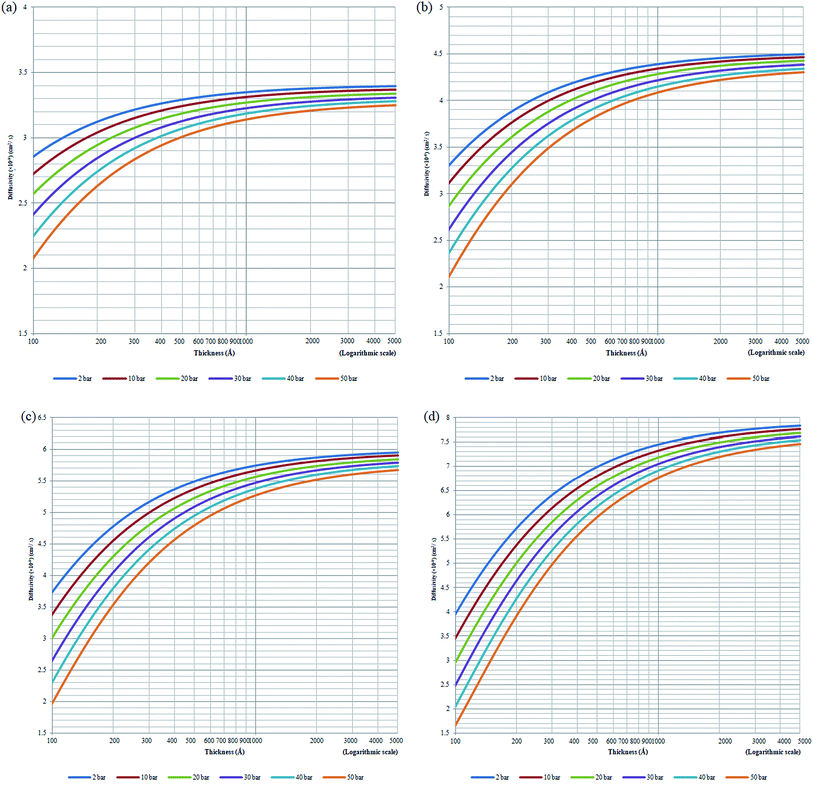 | ||
| Fig. 7 Effect of thickness upon confinement towards O2 diffusivity under varying operating pressures of (a) 298.15 K (b) 308.15 K (c) 318.15 K and (d) 328.15 K. | ||
Nonetheless, it is also found that the reduction in gas diffusivity attributed to compression of pressure is more apparent under higher operating temperature, typically at a film of smaller dimension. This indicates that the gas diffusivities span a wider range under higher operating temperature, which is evident in Fig. 7 for O2. The simulation for N2 diffusivity has been provided in Fig. S.3 in the ESI† since they have demonstrated similar behaviour with regards to film specification, operating temperature and pressure. For example, in a polymeric film of ∼100 Å under 50 bar pressure, the gas diffusivity under an operating temperature of 328.15 K is the lowest in comparison to its counterpart at smaller operating temperature. The observation proposes that higher operating temperature enhances the relaxation during compaction of polymeric chains at higher operating pressure, further enhancing agglomeration of polymeric chains into a structure with smaller void channels and thereby causing a reduction in gas diffusivity.
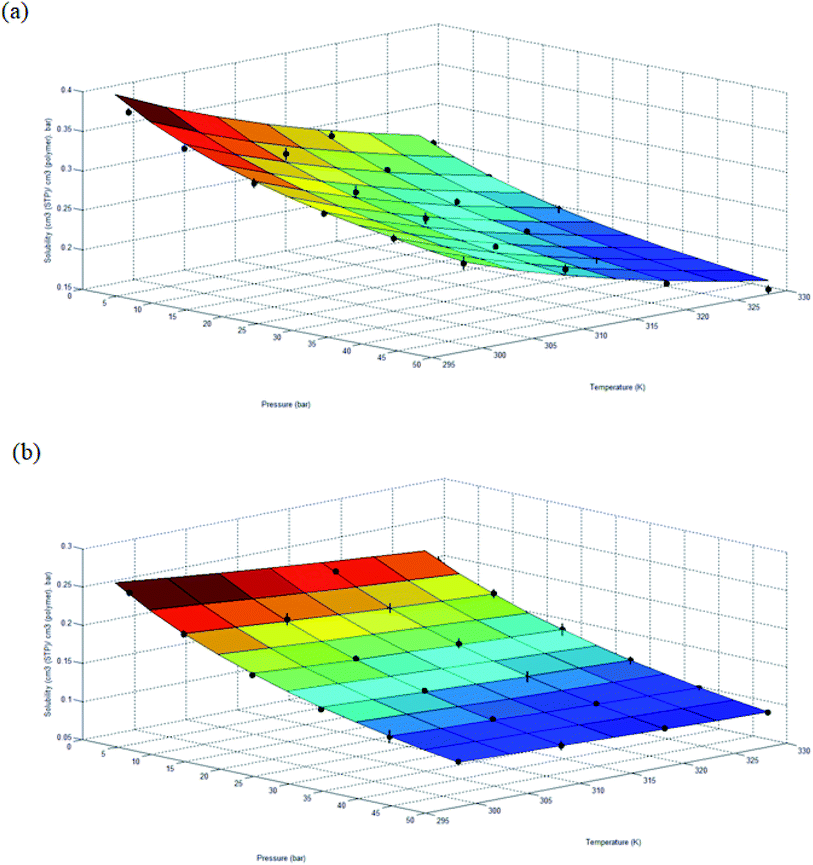 | ||
| Fig. 8 Solubility of ∼500 Å ultrathin PSF films under varying operating temperature and pressure for (a) oxygen (R2 = 0.9929) and (b) nitrogen (R2 = 0.9978), surface plot characterizes empirical equation based upon expression (19) with fitted parameters in Table 8. | ||
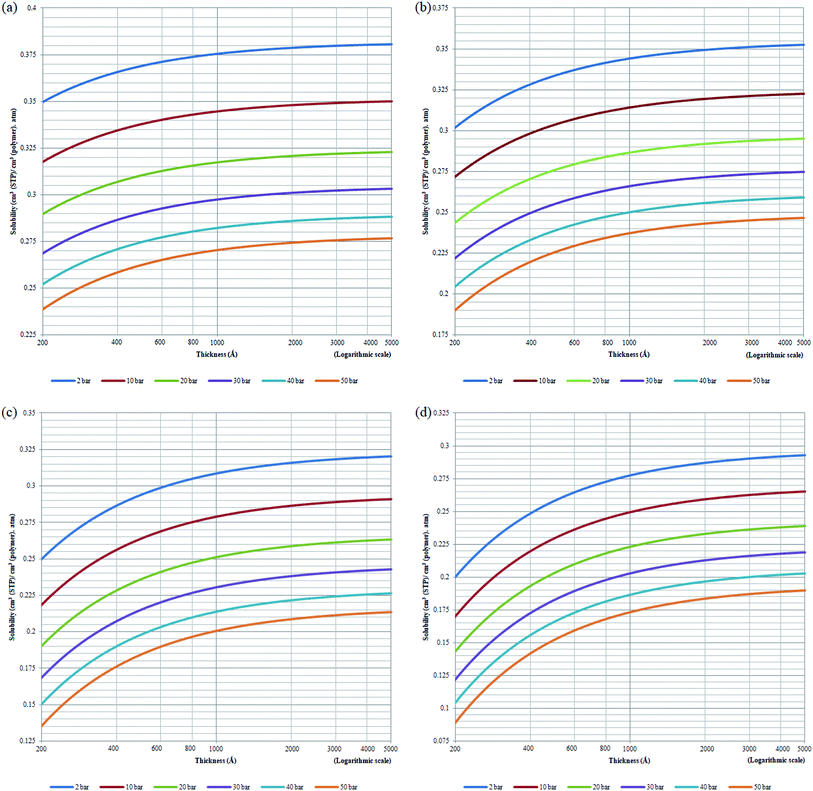
Based on physical parameters summarized in Table 8, the effect of operating conditions to gas solubility has been extended to ultrathin PSF membrane films of varying thicknesses for O2 in Fig. 9, while solubility of N2 in Fig. S.4,† respectively. It is found that gas solubility increases consistently with increment in film thickness and decrement in operating pressure, which has been rationalized through the availability of larger void channels that exist within the PSF ultrathin film when the effect of densification diminishes. The former has been attributed to leveling off of confinement within thicker PSF film while the latter is devoted to less compaction effect when operating pressure is lowered.82 For the effect of operating temperature, the gas solubility is found to be decreasing with increment in operating temperature attributed to the affinity to remain in a gaseous state. It is also found that the decrement in gas solubility attributed to operating pressure is progressively more perceptible under higher operating temperature, typically for the film of smaller dimension. The behaviour can be rationalized through the similar attribute observed in gas diffusivity, whereby clustering of polymeric chains with stronger intrachain bonding is further enhanced under the condition of smaller polymeric film, higher operating temperature and higher operating pressure. The condition increases the hindrance for gas molecules to interfere with the strong intrachain bonding in the polymeric chains, which ultimately causes a low solubility coefficient in a whole.
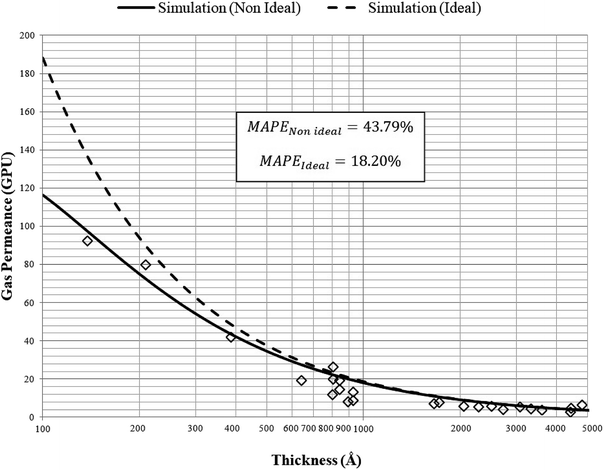 | ||
| Fig. 10 Model validation with experimental gas permeance data of oxygen gas for ultrathin PSF polymeric films of varying thicknesses by Ismail et al. (2003 & 2004)84,85 (⋄) at 303.15 K and 2 bars with non ideal (—) and ideal (---) simulation predictions. | ||
In a similar manner, the prediction of interpolated gas permeance at 303.15 K and 2 bars for non ideal and ideal permeance with their computed MAPE has been incorporated in Fig. 11 to demonstrate significance of the confinement effect studied in this work. The permeance for ideal model has been obtained by ignoring confinement effect within ultrathin membrane (l → ∞) in the permeability term as presented through eqn (20)–(22). This reduces permeance to be merely a function of operating temperature and pressure.
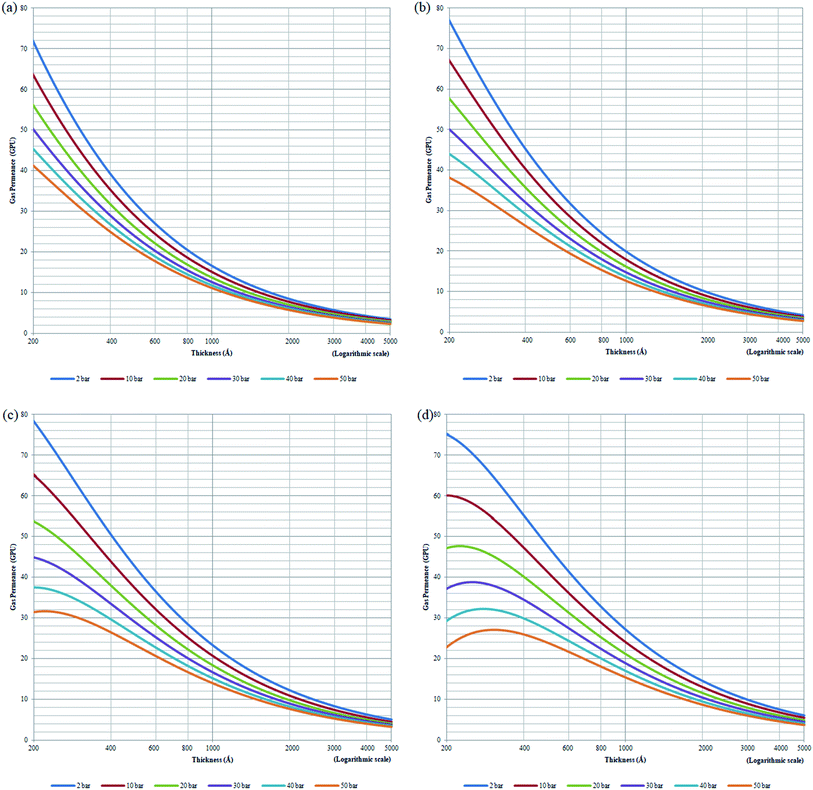 | ||
| Fig. 11 Effect of thickness upon confinement towards O2 permeance under varying operating pressures of (a) 298.15 K (b) 308.15 K (c) 318.15 K and (d) 328.15 K. | ||
It can be seen that simulated gas permeance data is able to give satisfactory accordance to the experimental data by Ismail et al. (2003 & 2004)84,85 over a wide range of film thickness, with percentage error of approximately 18.2% for O2 gas molecules using the non ideal simulation model. The error can be rationalized through formation of defects, which is typically encountered within fine membrane film,86 such as non uniformity or creation of holes that affect gas transport properties. Nonetheless, the simulation model is able to provide good qualitative behavior and quantitative representation characterizing the effect of thickness through direct interpolation at different operating temperature, which supports accuracy of the developed empirical model deduced from molecular simulation work. The ideal simulation model gives greater percentage error of approximately 44% for prediction of O2 gas permeance, whereby the error is typically apparent within thinner ultrathin polymeric film. The higher percentage error at smaller dimension has been explained through the higher dominancy of confinement effect when the thinner film is created at thickness far apart from the bulk structure. The lower percentage error of non ideal permeance in comparison to the ideal value justifies the importance of incorporating the confinement effect to characterize the separation performance of ultrathin polymeric film.
The effect of thickness upon confinement towards gas permeance of O2 and N2 has been computed based upon expressions (20)–(22) and the fitted parameters summarized in Tables 7 and 8 The computed gas permeance for O2 and N2 over a wide range of operating temperature, operating pressure and film thickness have been tabulated in Fig. 11 and S.5,† respectively. In an overall, the gas permeance of O2 molecule is higher than N2 at all operating conditions and membrane specification attributed to its smaller kinetic diameter and higher critical temperature that enables ease of sorption and diffusion within void spaces of the ultrathin PSF membrane films.
Generally, it is seen that the gas permeance decreases with increment in membrane thickness, which has been attributed to increment in permeation resistance with the longer path of transport. Nonetheless, it is found that beneath a certain membrane thickness, typically at higher operating temperature and pressure, the membrane permeance is found to be increasing with film specification before embarking to the normal region of decrement with membrane size. The behaviour has been attributed to enhanced densification in thinner structure when the interfacial layer effect dominates, which reduces the free channel for gas transport to an overall reduction in gas permeance in a whole. The observation of such behaviour typically at higher temperature and pressure has been rationalized through amplified agglomeration of polymeric chains when the surface effect is more pronounced at enhanced operating parameters within ultrathin structure. The transition from increment to decrement in gas permeance is found to be shifted towards higher film thickness with operating temperature and pressure. This is attributed to higher dominancy of the densification effect at a higher operating temperature that persists till thicker ultrathin PSF polymeric films.
As for the effect of operating temperature, it is found that the greater operating temperature contributes to higher activation energy that enables more diffusional jump within the structure of higher void spaces, further enhancing the gas permeance. The observation has been reported in the previously published literatures that has observed increment in gas permeance with operating temperature.87 In addition, it is found that the gas permeance at higher operating temperature span wider values over the range of membrane thickness attributed to the dominancy of intrachain bonding at the smaller specification to transition of dominancy of activation energy for a diffusional jump when the membrane thickness increases that is typically apparent when the operating temperature is increased. The enhanced confinement at higher operating temperature causes gas permeance at a smaller thickness to be lower in comparison to its counterpart typically at higher operating pressure condition. The observation can be explained through augmented relaxation contributed by higher operating temperature, which promotes the agglomeration of polymeric chains to form structure of lower void space, especially at the condition of higher operating pressure.
The higher pressure contributes to compaction that enhances densification within ultrathin PSF film, which reduces the free channels for the permeability of gas molecules. It is found that the decrement in gas permeance is more prominent at higher operating temperature, which has been rationalized through the higher energetic state for compaction and clustering of polymeric chains with increment in operating pressure, further contributing to formation of structure with confined free spaces and ultimately an overall reduction in gas permeance. In addition, it is found that the decrement in membrane permeance with increment in operating pressure is most pronounced at thinner polymeric membrane structure, whereby the decrement among membrane permeance of varying operating pressure gradually becomes less significant with increment in membrane thickness. The observation has been explained through levelling off of densification effect when membrane thickness increases, which serves operating pressure to have a less apparent impact on the relaxation, structure and gas transport properties of the thicker PSF ultrathin polymeric membrane.
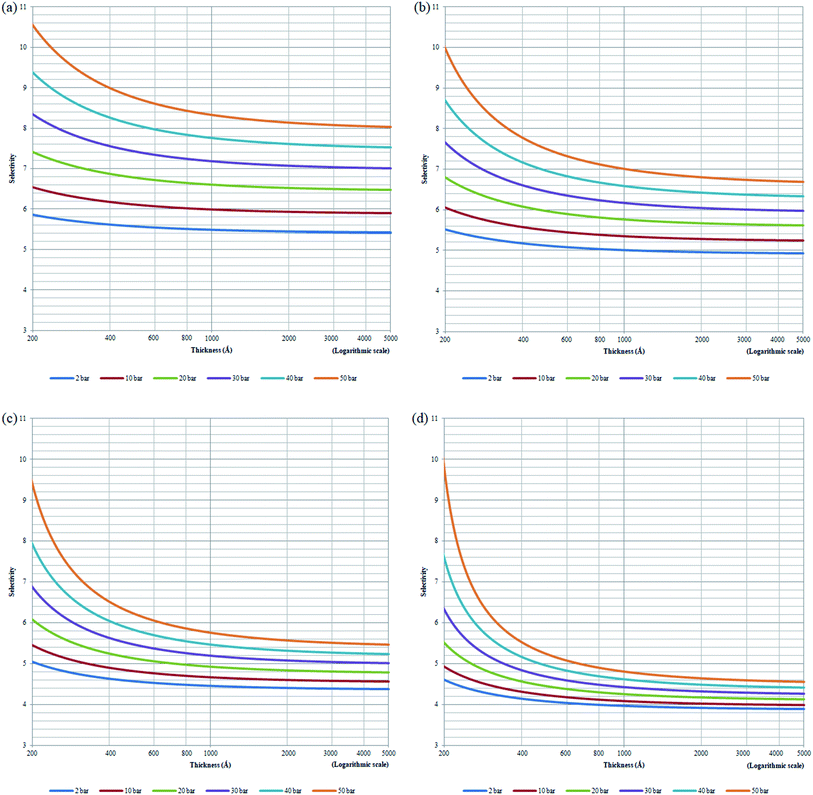
 , has been plotted in Fig. 12. Generally, it is found that the membrane selectivity is the highest at thinner polymeric membrane structure, whereby the selectivity decreases when membrane thickness is further increased. The observation has been attributed to smaller void spaces in thinner polymeric membrane, which increases the separating capability by allowing less N2 with a bigger size to surpass the impediments for gas transport. In addition, it is found that the selectivity also increases with operating pressure but decreases with increment in operating temperature. The behaviour has been rationalized through alteration in membrane-free channel with the aforementioned operating condition, whereby it decreases with operating pressure and increases with operating temperature, which subsequently affects the separating ability in the same manner. It is found that the effect of operating pressure on selectivity is more apparent under the condition of lower operating temperature, whereby the difference becomes less significant when the temperature is increased. The condition has been attributed to the reason that the membrane reaches a threshold of low selectivity with increment in operating temperature when void spaces becomes sufficiently big for passage of both O2 and N2. Thereby, increment in operating pressure has less impact on improvement to the membrane selectivity.
4. Conclusion
A Soft Confining Methodology for Ultrathin Film (SCMUF) has been conducted in Materials Studio 8.0 software to incorporate the non-ideal confinement encountered in ultrathin film at varying operating temperatures and pressures. The specific volume and free volume have been simulated to elucidate the nature of thickness-dependent confinement towards characteristic and relaxation of polymeric membranes at varying operating conditions. At higher operating temperature, there exists higher activation energy for mobility to overcome intrachain bonding between polymeric chains, further contributing to final structure that exhibits lower structural density, higher free volume and greater cavity sizes. Only with the exception at a low film thickness of ∼100 Å, an opposite observation has been found since intrachain attractive forces are the dominant factor under such circumstance. For the effect of operating pressure, it is found that the compression at higher pressure causes enhanced confinement within the ultrathin film, which results in higher density, lower free volume fraction and smaller cavity sizes. Close compliance between simulated data with real experimental observation and intuitive elucidation that describes the impact of thickness to behavior of ultrathin polymeric films under varying operating temperatures and pressures have been obtained. This supports that the molecular simulation methodology is of sufficient reliability, which can be subsequently applied to study the interaction between the ultrathin membrane and gas penetrants to capture the confinement phenomenon towards gas transport behaviour.With regards to operating temperature effect, despite lower solubility at higher operating temperature, which has been attributed to greater affinity to maintain in the gaseous state, the increment in void spaces coupled with higher energy state for gas mobility and diffusional jump contributes to increment in diffusivity and ultimately the gas permeance. Only the gas transport properties at smaller thickness are lower at higher operating temperature attributed to confined free volume when intrachain bonding plays a more dominant role within the ultrathin film. With regards to the operating pressure, the diffusivity, solubility and permeability properties of gas penetrants reduces with increment in operating pressure, which can be correlated with the decrement in free channels for gas transport. Our previous empirical models that are limited to describe thickness dependent confinement have been revised to accommodate the effect of operating temperature and pressure, which is found to be in good compliance with the simulated data. In addition, applicability of the improved empirical model has been validated through satisfactory agreement between interpolated predictions and published experimental results. The success in using molecular simulation to collect physical and gas transport property data has the potential to shed light on how computational tools can be used to circumvent limitation in experimental scale instrument. The developed empirical model can be used to optimize separation performance for specific membrane gas separation using multi-scale simulation via integration in macroscale membrane models within industrial process simulator.
Conflicts of interest
There are no conflicts of interest to declare.Acknowledgements
This work is done with the financial support from Universiti Teknologi PETRONAS.References
- P. Baskar and A. Senthilkumar, Eng. Sci. Technol. Int. J., 2016, 19, 438–443 Search PubMed.
- R. S. Murali, T. Sankarshana and S. Sridhar, Sep. Purif. Rev., 2013, 42, 130–186 CrossRef CAS.
- J. Fischer and L. J. Burnett, Membrane oxygen enrichment cost and application evaluation, California, 1979 Search PubMed.
- S. S. M. Lock, K. K. Lau, A. M. Shariff, Y. F. Yeong, Z. H. Ban and W. H. Tay, J. Chem. Technol. Biotechnol., 2019, 94, 2844–2868 CrossRef CAS.
- H. Lin, M. Zhou, J. Ly, J. Vu, J. G. Wijmans, T. C. Merkel, J. Jin, A. Haldeman, E. H. Wagener and D. Rue, Ind. Eng. Chem. Res., 2013, 52, 10820–10834 CrossRef CAS.
- R. W. Baker, Ind. Eng. Chem. Res., 2002, 41, 1393–1411 CrossRef CAS.
- X.-Y. Zhang and Y.-H. Ding, RSC Adv., 2014, 4, 44214–44222 RSC.
- L. Singh, P. J. Ludovice and C. L. Henderson, Thin Solid Films, 2004, 449, 231–241 CrossRef CAS.
- D. Wang, Z. Wang, L. Wang, L. Hu and J. Jin, Nanoscale, 2015, 7, 17649–17652 RSC.
- S. M. Kozlov, I. Demiroglu, K. M. Neyman and S. T. Bromley, Nanoscale, 2015, 7, 4361–4366 RSC.
- C. Mottet, in Mechanical Stress on the Nanoscale: Simulation, Material Systems and Characterization Techniques, ed. M. Hanbücken, P. Müller and R. B. Wehrspohn, Wiley-VCH Verlag GmbH & Co. KGaA, 2011 Search PubMed.
- R. Lu, Z. Meng, D. Rao, Y. Wang, Q. Shi, Y. Zhang, E. Kan, C. Xiao and K. Deng, Nanoscale, 2014, 6, 9960–9964 RSC.
- J. A. Forrest, K. Dalnoki-Veress, J. R. Stevens and J. R. Dutcher, Phys. Rev. Lett., 1996, 77, 2002–2005 CrossRef CAS PubMed.
- K. Binder, A. Milchev and J. Baschnagel, Annu. Rev. Mater. Sci., 1996, 26, 107–134 CrossRef CAS.
- J. Baschnagel, C. Mischler and K. Binder, J. Phys., 2000, 10, Pr7-9–Pr7-14 Search PubMed.
- C. Mischler, J. Baschnagel, S. Dasgupta and K. Binder, Polymer, 2002, 43, 467–476 CrossRef CAS.
- J. A. Torres, P. F. Nealey and J. J. de Pablo, Phys. Rev. Lett., 2000, 85, 3221–3224 CrossRef CAS PubMed.
- H. Liu, Y. Li, W. E. Krause, O. J. Rojas and M. A. Pasquinelli, J. Phys. Chem. B, 2012, 116, 1570–1578 CrossRef CAS PubMed.
- Y. Nie, Z. Zhou, T. Hao, X. Ye and W. Yang, Macromol. Theory Simul., 2016, 25, 187–195 CrossRef CAS.
- H. Frentrup, K. E. Hart, C. M. Colina and E. A. Müller, Membranes, 2015, 5, 99–119 CrossRef CAS PubMed.
- A. Ozcan, C. Perego, M. Salvalaglio, M. Parrinello and O. Yazaydin, Chem. Sci., 2017, 8, 3858–3865 RSC.
- M. Tong, Q. Yang, Q. Ma, D. Liu and C. Zhong, J. Mater. Chem. A, 2016, 4, 124–131 RSC.
- A. Ozcan, C. Perego, M. Salvalaglio, M. Parrinello and O. Yazaydin, Chem. Sci., 2017, 8, 3858–3865 RSC.
- J. Liu, Q. Xu and J. Jiang, J. Membr. Sci., 2019, 573, 639–646 CrossRef CAS.
- S. S. M. Lock, K. K. Lau, A. M. Shariff, Y. F. Yeong and A. M. Bustam, RSC Adv., 2017, 7, 44376–44393 RSC.
- S. S. M. Lock, K. K. Lau, A. M. Shariff, Y. F. Yeong and M. A. Bustam, J. Polym. Sci., Part B: Polym. Phys., 2018, 56, 131–158 CrossRef CAS.
- S. S. M. Lock, K. K. Lau, A. M. Shariff and Y. F. Yeong, J. Cleaner Prod., 2017, 162, 914–937 CrossRef CAS.
- A. Jamil, O. P. Ching and A. M. Shariff, Chem. Eng. Technol., 2016, 39, 1393–1405 CrossRef CAS.
- A. Fernández-Barquín, C. Casado-Coterillo, M. Etxeberria-Benavides, J. Zuñiga and A. Irabien, Chem. Eng. Technol., 2017, 40, 997–1007 CrossRef.
- H. Wang, R. Wang, D. T. Liang and W. Yang, J. Membr. Sci., 2004, 243, 405–415 CrossRef CAS.
- S. Smart, J. C. Diniz Da Costa, S. Baumann and W. A. Meulenberg, in Advanced Membrane Science and Technology for Sustainable Energy and Environmental Applications, ed. A. Basile and S. P. Nunes, Woodhead Publishing, 2011, pp. 255–292 Search PubMed.
- D. S. BIOVIA, Materials Studio, San Diego, Dassault Systèmes, 2019 Search PubMed.
- K. Golzar, S. Amjad-Iranagh, M. Amani and H. Modarress, J. Membr. Sci., 2014, 451, 117–134 CrossRef CAS.
- S. S. M. Lock, K. K. Lau, I. L. S. Mei, A. M. Shariff and Y. F. Yeong, Procedia Eng., 2016, 148, 855–861 CrossRef CAS.
- U. Philippe, T. Bernard and B. Anne, in Applications of Molecular Simulation in the Oil and Gas Industry: Monte Carlo Methods, Editions Technip, Paris, 2005, ch. 2, pp. 7–83 Search PubMed.
- W. Cai, J. Li and S. Yip, in Comprehensive Nuclear Materials, ed. R. J. M. Konings, Elsevier, Amsterdam, 2012, vol. 1, pp. 249–265 Search PubMed.
- M. Kim and J. Kim, Chem. Eng. Res. Des., 2018, 132, 853–864 CrossRef CAS.
- Á. A. Ramírez-Santos, M. Bozorg, B. Addis, V. Piccialli, C. Castel and E. Favre, J. Membr. Sci., 2018, 566, 346–366 CrossRef.
- S. Gilassi, S. M. Taghavi, D. Rodrigue and S. Kaliaguine, Int. J. Greenhouse Gas Control, 2019, 83, 195–207 CrossRef CAS.
- S. S. Hosseini, S. Najari, P. K. Kundu, N. R. Tan and S. M. Roodashti, RSC Adv., 2015, 5, 86359–86370 RSC.
- R. Rautenbach, R. Knauf, A. Struck and J. Vier, Chem. Eng. Technol., 1996, 19, 391–397 CrossRef CAS.
- F. Ahmad, K. K. Lau, A. M. Shariff and Y. F. Yeong, J. Membr. Sci., 2013, 430, 44–55 CrossRef CAS.
- M. Scholz, T. Harlacher, T. Melin and M. Wessling, Ind. Eng. Chem. Res., 2013, 52, 1079–1088 CrossRef CAS.
- National Institute of Standards and Technology (NIST), NIST Chemistry WebBook: NIST Standard Reference Database Number 69, U.S. Secretary of Commerce, United States of America, 2008 Search PubMed.
- F. Gorelli, M. Santoro, T. Scopigno, M. Krisch and G. Ruocco, Phys. Rev. Lett., 2006, 97, 245702 CrossRef CAS PubMed.
- G. G. Simeoni, T. Bryk, F. A. Gorelli, M. Krisch, G. Ruocco, M. Santoro and T. Scopigno, Nat. Phys., 2010, 6, 503–507 Search PubMed.
- P. Masi, D. R. Paul and J. W. Barlow, J. Polym. Sci., Part B: Polym. Phys., 1982, 20, 15–26 Search PubMed.
- E. S. Sanders, J. Membr. Sci., 1988, 37, 63–80 CrossRef CAS.
- Y. Kamiya, K. Mizoguchi, Y. Naito and T. Hirose, J. Polym. Sci., Part B: Polym. Phys., 1986, 24, 535–547 CrossRef CAS.
- R. Paterson, Y. Yampol’skii, P. G. T. Fogg, A. Bokarev, V. Bondar, O. Ilinich and S. Shishatskii, J. Phys. Chem. Ref. Data, 1999, 28, 1255–1450 CrossRef CAS.
- M. B. Shiflett and H. C. Foley, Science, 1999, 285, 1902 CrossRef CAS PubMed.
- V. E. Patil, L. J. P. van den Broeke, F. F. Vercauteren and J. T. F. Keurentjes, J. Membr. Sci., 2006, 271, 77–85 CrossRef CAS.
- Y. Kamiya, T. Hirose, K. Mizoguchi and Y. Naito, J. Polym. Sci., Part B: Polym. Phys., 1986, 24, 1525–1539 CrossRef CAS.
- A. M. Shishatskii, Y. P. Yampol'skii and K. V. Peinemann, J. Membr. Sci., 1996, 112, 275–285 CrossRef CAS.
- G. Q. Chen, C. A. Scholes, C. M. Doherty, A. J. Hill, G. G. Qiao and S. E. Kentish, Chem. Eng. J., 2012, 209, 301–312 CrossRef CAS.
- A. Bondi, Physical Properties of Molecular Crystals, Liquids and Glasses, John Wiley & Sons, New York, 1968 Search PubMed.
- D. W. Van Krevelen, in Properties of Polymers, Elsevier, Amsterdam, 1997, pp. 71–107 Search PubMed.
- A. Einstein, Autobiographical notes, Albert Einstein: Philosopher Scientist, 1949 Search PubMed.
- N. Metropolis, A. W. Rosenbluth, M. N. Rosenbluth, A. H. Teller and E. Teller, J. Chem. Phys., 1953, 21, 1087–1092 CrossRef CAS.
- M. Dehghani, M. Asghari, A. H. Mohammadi and M. Mokhtari, Comput. Chem. Eng., 2017, 103, 12–22 CrossRef CAS.
- J. M. Prausnitz and F. H. Shair, AIChE J., 1961, 7, 682–687 CrossRef CAS.
- P. G. Tait, Physics and Chemistry, 1988, 2, 1–76 Search PubMed.
- P. Zoller, J. Polym. Sci., Polym. Phys. Ed., 1978, 16, 1261–1275 CrossRef CAS.
- P. Zoller, J. Polym. Sci., Part B: Polym. Phys., 1982, 20, 1453–1464 CrossRef CAS.
- H. Vogel, Phys. Z., 1921, 22, 645–646 CAS.
- D. Prevosto, M. Lucchesi, S. Capaccioli, R. Casalini and P. A. Rolla, Phys. Rev. B: Condens. Matter Mater. Phys., 2003, 67, 174202 CrossRef.
- G. Adam and J. H. Gibbs, J. Chem. Phys., 1965, 43, 139–146 CrossRef CAS.
- R. Richert and C. A. Angell, J. Chem. Phys., 1998, 108, 9016–9026 CrossRef CAS.
- I.-S. Park, K. Saruta and S. Kojima, J. Phys. Soc. Jpn., 1998, 67, 4131–4138 CrossRef CAS.
- D. Prevosto, S. Capaccioli, M. Lucchesi, D. Leporini and P. Rolla, J. Phys.: Condens. Matter, 2004, 16, 6597 CrossRef CAS.
- C. A. Angell and R. D. Bressel, J. Phys. Chem., 1972, 76, 3244–3253 CrossRef CAS.
- C. Alba, L. E. Busse, D. J. List and C. A. Angell, J. Chem. Phys., 1990, 92, 617–624 CrossRef CAS.
- R. M. Barrer, Trans. Faraday Soc., 1942, 38, 322–330 RSC.
- G. J. V. Amerongen, J. Appl. Phys., 1946, 17, 972–985 CrossRef.
- X. Duthie, S. Kentish, C. Powell, K. Nagai, G. Qiao and G. Stevens, J. Membr. Sci., 2007, 294, 40–49 CrossRef CAS.
- C. A. Scholes, G. Q. Chen, G. W. Stevens and S. E. Kentish, J. Membr. Sci., 2010, 346, 208–214 CrossRef CAS.
- D. Sethi, R. Ram and D. Khastgir, Polym. Int., 2017, 66, 1295–1305 CrossRef CAS.
- J. H. Kim, J. Jang and W.-C. Zin, Langmuir, 2000, 16, 4064–4067 CrossRef CAS.
- P. H. Pfromm, in Materials Science of Membranes for Gas and Vapor Separation, John Wiley & Sons, Ltd, 2006, pp. 293–306 Search PubMed.
- T. Alfrey, G. Goldfinger and H. Mark, J. Appl. Phys., 1943, 14, 700–705 CrossRef CAS.
- D. Rigby, H. Sun and B. E. Eichinger, Polym. Int., 1997, 44, 311–330 CrossRef CAS.
- X.-G. Li, I. Kresse, Z.-K. Xu and J. Springer, Polymer, 2001, 42, 6801–6810 CrossRef CAS.
- J. Kang, B. Zhang and T. Kang, J. Nat. Gas Sci. Eng., 2018, 54, 65–71 CrossRef CAS.
- A. F. Ismail, B. C. Ng and W. A. W. Abdul Rahman, Sep. Purif. Technol., 2003, 33, 255–272 CrossRef CAS.
- B. C. Ng, A. F. Ismail, W. A. W. Abdul Rahman, H. Hasbullah, M. S. Abdullah and A. R. Hassan, J. Teknol., 2004, 41, 73–88 Search PubMed.
- H. Yang, M. Su, K. Li, L. Jiang, Y. Song, M. Doi and J. Wang, Langmuir, 2014, 30, 9436–9441 CrossRef CAS PubMed.
- Y. Huang and D. R. Paul, Macromolecules, 2005, 38, 10148–10154 CrossRef CAS.
Footnote |
| † Electronic supplementary information (ESI) available. See DOI: 10.1039/d0ra05836j |
| This journal is © The Royal Society of Chemistry 2020 |

