
 Open Access Article
 This Open Access Article is licensed under a
 Creative Commons Attribution 3.0 Unported Licence
Systematic investigation of CO2![[thin space (1/6-em)]](https://www.rsc.org/images/entities/h2_char_2009.gif) :NH3 ice mixtures using mid-IR and VUV spectroscopy – part 1: thermal processing†
:NH3 ice mixtures using mid-IR and VUV spectroscopy – part 1: thermal processing†
Rachel L. James *a,
Sergio Ioppolob,
Søren V. Hoffmannc,
Nykola C. Jonesc,
Nigel J. Masond and
Anita Dawesa
*a,
Sergio Ioppolob,
Søren V. Hoffmannc,
Nykola C. Jonesc,
Nigel J. Masond and
Anita Dawesa
aSchool of Physical Sciences, The Open University, Walton Hall, Milton Keynes, UK. E-mail: Rachel.James1@open.ac.uk; Fax: +44 (0)1908 654192; Tel: +44 (0)1908 332012
bSchool of Electronic Engineering and Computer Science, Queen Mary University of London, Mile End Road, London, UK
cISA, Department of Physics and Astronomy, Aarhus University, Ny Munkegade 120, DK-8000 Aarhus C, Denmark
dSchool of Physical Sciences, University of Kent, Canterbury, Kent, UK
First published on 12th October 2020
Abstract
The adjustment of experimental parameters in interstellar ice analogues can have profound effects on molecular synthesis within an ice system. We demonstrated this by systematically investigating the stoichiometric mixing ratios of CO2![[thin space (1/6-em)]](https://www.rsc.org/images/entities/char_2009.gif) :NH3 ices as a function of thermal processing using mid-IR and VUV spectroscopy. We observed that the type of CO2 bonding environment was dependent on the different stoichiometric mixing ratios and that this pre-determined the NH3 crystallite structure after phase change. The thermal reactivity of the ices was linked to the different chemical and physical properties of the stoichiometric ratios. Our results provide new details into the chemical and physical properties of the different stoichiometric CO2:NH3 ices enhancing our understanding of the thermally induced molecular synthesis within this ice system.
:NH3 ices as a function of thermal processing using mid-IR and VUV spectroscopy. We observed that the type of CO2 bonding environment was dependent on the different stoichiometric mixing ratios and that this pre-determined the NH3 crystallite structure after phase change. The thermal reactivity of the ices was linked to the different chemical and physical properties of the stoichiometric ratios. Our results provide new details into the chemical and physical properties of the different stoichiometric CO2:NH3 ices enhancing our understanding of the thermally induced molecular synthesis within this ice system.
1 Introduction
Despite over 200 molecules being detected in the interstellar medium (ISM), the formation pathways for most of these molecules remain elusive. However, processing of interstellar ices is believed to play an important role in the molecular synthesis of the majority of these astrochemical molecules. As a result, there exists extensive experimental investigations of condensed phase molecular films under ISM conditions.Typical to all experiments, regardless of application, a range of experimental parameters can be controlled. For astrochemical experiments investigating interstellar ice analogues, these experimental parameters include, but are not limited to, the following: deposition temperature, deposition rate, ice composition (and ratio), processing type, processing time, processing energy and substrate type. Adjusting these experimental parameters will change the chemical and physical properties of the interstellar ice analogues, the properties of which govern the molecular synthesis within the ice and requires comprehensive analysis.
To demonstrate the impact that one discrete experimental parameter can have on the chemical and physical properties of an interstellar ice system we investigated the stoichiometric mixing ratio of CO2:NH3 ices as a function of thermal processing. We chose the CO2:NH3 system as CO2 and NH3 are two of the most abundant molecules observed in interstellar ice and when combined contain the four most common elements to life. Furthermore, the two compounds do not share any of the elements between them, making identification of the origin of the constituents that make up the products easier, without the need for isotopic substitution. As such this is an attractive ice system to study and has been the subject of multiple previous studies which provide a benchmark to validate our systematic investigation of one discrete experimental parameter.1–9
Table 1 summarises the previous thermal processing studies of CO2:NH3 interstellar ice analogues. A consensus was that a thermally induced reaction within the CO2:NH3 ice mixture resulted in the formation of carbamic acid and/or ammonium carbamate. Of the nine experimental studies shown in Table 1 only three studies1,6,7 investigated the stoichiometric mixing ratio of CO2:NH3 ice, the discrete experimental parameter under focus in this paper. And, of these three studies, CO2-rich mixtures were investigated by Frasco who makes no comment about the CO2-rich mixtures1 and Noble et al. who reported no thermal reaction in CO2-rich mixtures.7 For equal parts or NH3-rich mixtures Noble et al. observed that ammonium carbamate formed first and converted to carbamic acid at temperatures above 150 K.7 Rodríguez-Lazcano et al. reported that their CO2:NH3 1:2 ratio produced the highest yield of products compared to their 1:3 & 1:1 ratios, but offered no explanation as to why this preference existed.6 As such the effect of the stoichiometric mixing ratio parameter on the CO2:NH3 ice system has potential for further investigation.
:NH3 ice mixtures
| Reference | CO2:NH3 ratio |
Deposition temperature (K) | Main products |
|---|---|---|---|
| a Ratios derived from partial pressures of the mixture in the gas line.b Method of determining ratio not specified.c Ratios derived from column density. AC = ammonium carbamate. CA = carbamic acid. | |||
| Frasco1 | Various (10 to 90% NH3)a | 195 | AC |
| Hisatsune2 | 1:3a |
83 | (NH3)2CO2 & AC |
| Bossa et al.3 | 1:1b |
10 | AC & CA |
| Bertin et al.4 | 1:1a |
10 | AC & CA |
| Lv et al.5 | 1:1a |
16 | AC & CA |
| Rodríguez-Lazcano et al.6 | 1:1, 1:2, 1:3c |
15 | AC & CA |
| Noble et al.7 | Various (including 20:1, 13:1, 4:1, 1:1, 1:1.5)c |
60 | AC & CA |
| Potapov et al.8 | 1:4c |
15 | AC |
| Potapov et al.9 | 1:4c |
15 | AC |
All of the studies shown in Table 1 employed IR spectroscopy, a powerful in situ technique commonly used for the investigation of the structure and composition of ice samples in the laboratory. Some of these studies also incorporated a second analytical technique, e.g. mass spectrometry3,7,8 or high resolution low energy electron loss spectroscopy,4 providing further characterisation of the ice. In addition to using mid-IR spectroscopy to investigate the thermal processing of CO2:NH3 ice mixtures in this paper, we also present a complementary study using vacuum-UV (VUV) spectroscopy. This is the first time that CO2:NH3 interstellar ice analogues have been investigated using VUV spectroscopy. Both mid-IR and VUV spectroscopy are used in situ and provide information on the end products allowing for the monitoring of the complex chemical and physical processes involved in forming these products.
This work is part of a wider, ongoing collection of experiments aimed at understanding how discrete experimental parameters impact both the chemical and physical properties of an interstellar ice analogue which govern molecular synthesis. In particular, this paper focusses on the influence that the stoichiometric mixing ratio has on the chemical and physical properties of CO2:NH3 mixtures when subjected to thermal processing. A corresponding paper will investigate the influence that the stoichiometric mixing ratio has on the chemical and physical properties of CO2:NH3 mixtures when subjected to both non-thermal and thermal processing.
In this paper, we present mid-IR spectra of the thermal processing of CO2:NH3 mixtures (3:1, 2:1, 1:1, 1:3 & 1:10) deposited at 20 K. We complement the mid-IR spectra with the first VUV spectroscopic study of CO2:NH3 mixtures (4:1, 1:1 & 1:3) which were deposited at 20 K and thermally processed. We characterise these stoichiometric mixing ratios in detail at 20 K and demonstrate that the stoichiometric mixing ratio has a significant impact on both the chemical and physical properties of the CO2:NH3 ice system at deposition and throughout thermal processing.
2 Experimental
Both the mid-IR and VUV experiments were performed using The Open University Portable Astrochemistry Chamber (PAC). The PAC set-up is described in detail in Section S1.1 of the ESI.† All samples were grown via physical vapour deposition onto a cooled substrate (mid-IR: ZnSe, Crystran; VUV: MgF2, Crystran) at a base temperature of 20 K and a base pressure of low 10−9 mbar. CO2 (99.8%, BOC) and NH3 (99.96%, ARGO International Ltd) were premixed in the gas line prior to deposition. The ice samples were thermally processed at a heating rate of approximately 0.1 K s−1 to a set temperature. The acquisition time for a mid-IR measurement was approximately 2 min. The acquisition time for a VUV measurement was dependent on the step size used, which for measurements taken at temperatures ≤ 80 K corresponded to ∼30 min and at temperatures ≥ 90 K corresponded to ∼10 min. As acquisition times were different for the mid-IR and VUV spectroscopic measurements, the samples were allowed to isothermally stabilise for 2 min before the spectroscopic measurement was taken at the set temperature.The mid-IR experiments were performed at The Open University Molecular Astrophysics Laboratory, UK, using a FTIR spectrometer (Nicolet Nexus 670) with an external MCT detector. All mid-IR spectra were acquired in absorbance over the wavenumber range of 4000–800 cm−1 at a resolution of 1 cm−1. Background scans were averaged over 512 scans and sample scans were averaged over 128 scans. All mid-IR spectra presented in this paper were obtained at an oblique angle (45°) to the IR radiation unless otherwise stated. For the VUV experiments, the PAC was attached to the AU-UV beam line at the ASTRID2 storage ring, Aarhus University, Denmark. All VUV spectra were acquired in absorbance over the wavelength range of 120–340 nm with 0.05 to 1 nm wavelength step size depending on the width of the spectral features to be resolved. The average photon flux per point was 2 ×10¹⁰ photons s−1 and collection time per point was 2.69 s. VUV processing (e.g. photoionisation) is wavelength dependent and given the low average photon flux and short collection time, any VUV processing during a measurement is negligible. All VUV spectra presented in this paper were obtained at an oblique angle (45°) to the UV radiation unless otherwise stated.
All mid-IR and VUV spectra are freely available on the Open Research Data Online (ORDO) Repository.10
2.1 Film thickness
Film thickness was determined from in situ laser interferometry measurements using a HeNe laser beam reflected off the substrate during deposition (see Section S1.2 of the ESI† for more details). The same deposition conditions were maintained for both mid-IR and VUV experiments and the deposition rates were between 0.8–1.8 nm s−1. On average, the film thickness of the mid-IR samples was 402 nm. Thinner films were required to prevent saturation of absorption peaks for the VUV samples compared to mid-IR samples and the average film thickness was 204 nm. Where comparisons were made between the mixtures, the spectra were normalised to specific film thickness, 400 nm for mid-IR spectra and 200 nm for VUV spectra, and is indicated in the figure captions. See Table S1 in the ESI† for the individual sample thickness and normalisation factors.2.2 Determining the CO2![[thin space (1/6-em)]](https://www.rsc.org/images/entities/h3_char_2009.gif) :NH3 mixing ratios
:NH3 mixing ratios
It is well known that discrepancies exist between the ratio of the partial pressures in the gas line and the resultant mixing ratio of the deposited sample. For the mid-IR samples the CO2:NH3 ratios were determined from the derived column densities of CO2 (ν3 absorption band) and NH3 (ν2 absorption band) when the substrate was positioned at normal incidence to the IR radiation. For specific details on the calculations used, integration range of the absorption peak and integrated band strengths see Section S1.3 of the ESI.† VUV spectroscopy does not have the same protocol for determining the ratios directly from the spectra as mid-IR spectroscopy. A method for determining the ratios from VUV spectra without needing to calculate photoabsorption cross sections is proposed in Section S1.4 of the ESI.† The VUV samples used the same mixing partial pressures as the mid-IR samples. While the partial pressures do not correlate with the deposited mixtures, a consistent mixing ratio was obtained from the corresponding partial pressures and this was used to check the validity of the method proposed.
3 Mid-IR results & discussion
3.1 Deposition at 20 K
Fig. 1 shows the mid-IR spectra of CO2:NH3 mixtures (3:1, 2:1, 1:1, 1:3 & 1:10) deposited at 20 K compared with pure CO2 (1:0) and pure NH3 (0:1) also deposited at 20 K. The band assignments and positions are given in Table 2.
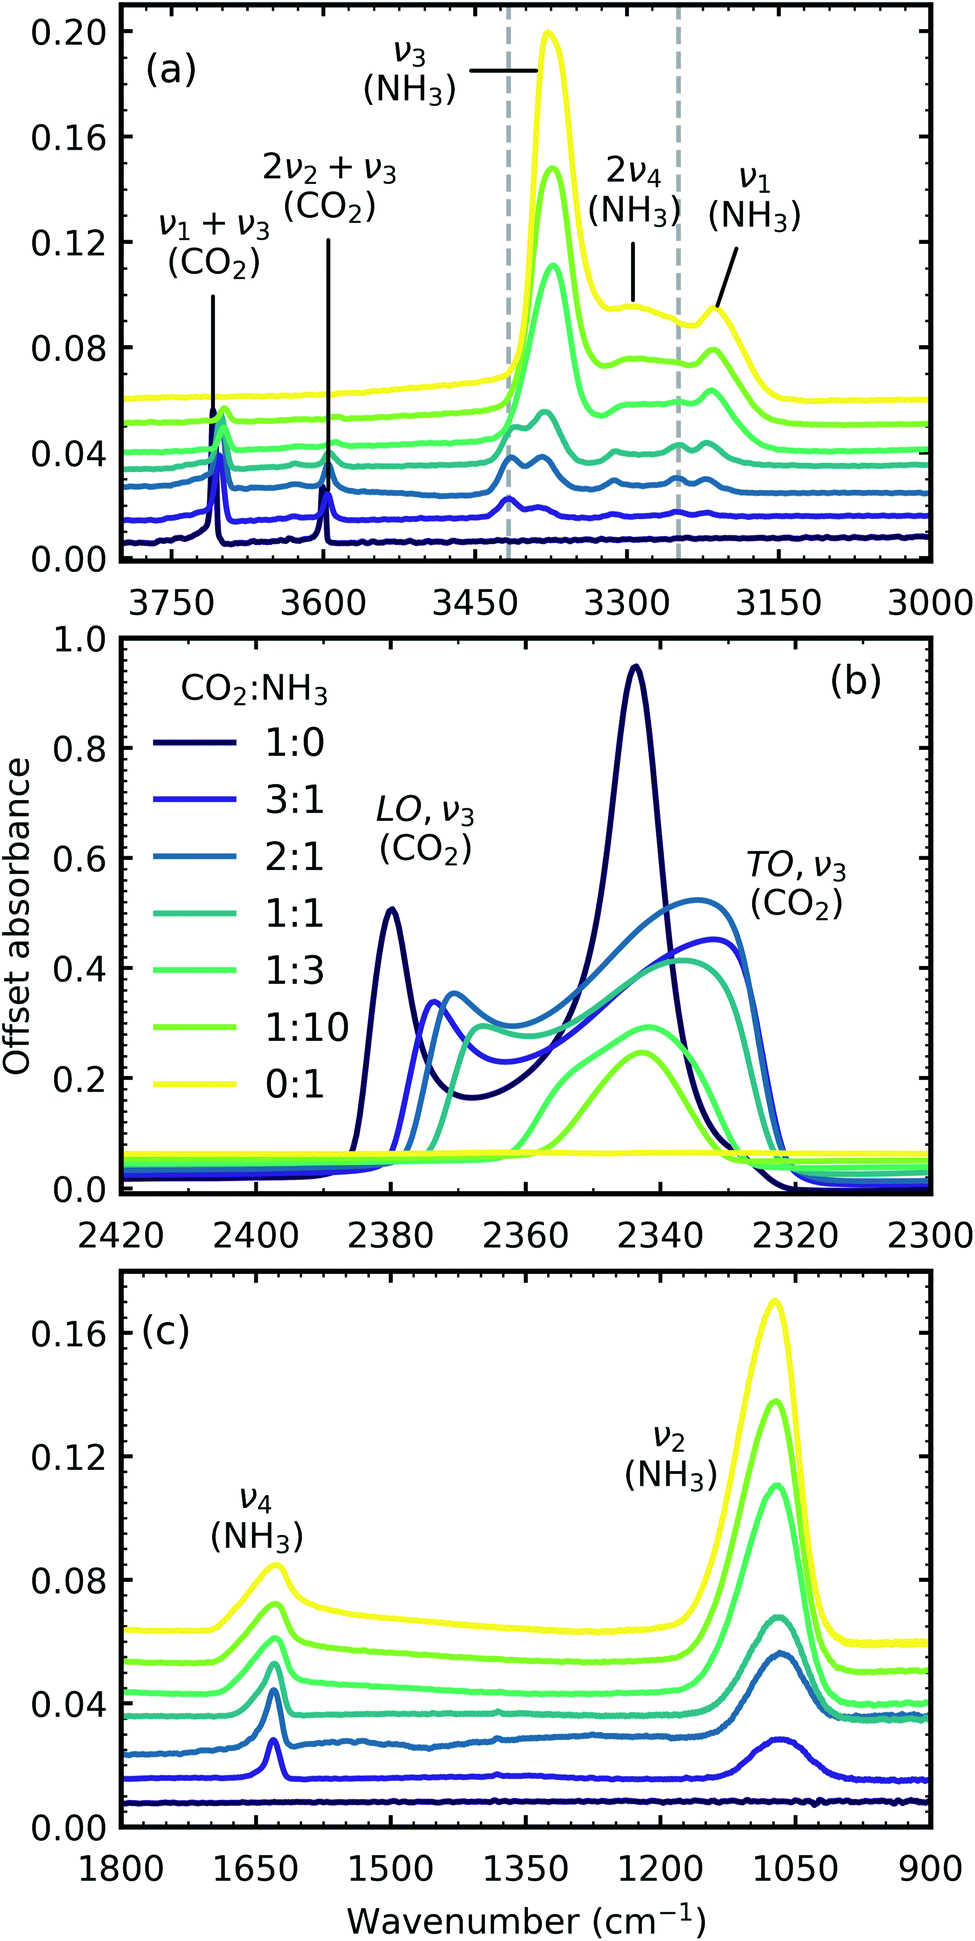 | ||
| Fig. 1 Mid-IR spectra of CO2:NH3 mixtures (3:1, 2:1, 1:1, 1:3 & 1:10) at 20 K compared with pure CO2 (1:0) and pure NH3 (0:1). (a) Dashed lines represent new features which formed upon deposition. (b) LO-TO splitting of the ν3 absorption band of CO2 (c) NH3 ν4 and ν2 absorption bands. Band assignments are given in Table 2. Spectra are offset on the y-axis for clarity. All spectra are normalised to a thickness of 400 nm. | ||
:0), pure NH3 ice (0:1) and CO2:NH3 mixtures (3:1, 2:1, 1:1, 1:3 & 1:10) deposited at 20 K
| Molecule | Vib. mode | Assignment | Ref. | Position (cm−1) | ||||||
|---|---|---|---|---|---|---|---|---|---|---|
| 1:0 |
3:1 |
2:1 |
1:1 |
1:3 |
1:10 |
0:1 |
||||
| CO2 | ν1 + ν3 | Combination | 11 | 3709 | 3703 | 3702 | 3701 | 3698 | 3697 | |
| 2ν2 + ν3 | Combination | 11 | 3601 | 3596 | 3596 | 3595 | 3590 | 3588 | ||
| ν3 | C=O asym. stretch (LO) | 12 | 2380 | 2374 | 2371 | 2366 | ||||
| ν3 | C=O asym. stretch (TO) | 11 and 12 | 2345 | 2332 | 2334 | 2337 | 2342 | 2343 | ||
| 13CO2 | ν3 | asym. stretch | 11 | 2283 | 2279 | 2279 | 2278 | 2277 | 2277 | |
| CO2:NH3 complex |
3 | 3417 | 3415 | 3413 | ||||||
| 3 | 3250 | 3251 | 3248 | 3248 | ||||||
| NH3 | ν3 | N–H asym. stretch | 13 | 3384 | 3382 | 3379 | 3373 | 3373 | 3377 | |
| 2ν4 | Overtone | 13 | 3313 | 3312 | 3311 | 3301 | 3298 | 3294 | ||
| ν1 | N–H sym. stretch | 13 | 3220 | 3220 | 3220 | 3215 | 3214 | 3212 | ||
| ν4 + νL | Combination | 13 | 1872 | 1872 | 1883 | |||||
| ν4 | Deformation | 13 | 1630 | 1630 | 1629 | 1629 | 1628 | 1627 | ||
| ν2 | Umbrella | 13 | 1066 | 1067 | 1069 | 1071 | 1073 | 1073 | ||
In addition to the vibrational modes associated with NH3 and CO2 two new vibrational modes were observed in the CO2:NH3 mixtures in Fig. 1(a) and are marked with dashed lines. The first vibrational mode at 3417 cm−1 was present for all ratios except the 1:3 and 1:10 ratios and the second vibrational mode at 3253 cm−1 was observed for all ratios except the 1:10 ratio. Previous studies have assigned these vibrational modes to a CO2:NH3 molecular complex in a ‘T-shape’ whereby the NH3 molecule is complexed to the C atom in the CO2 molecule via the lone pair of electrons on the N atom of NH3.3,14,15
Due to the oblique angle of the ice films to the incident IR radiation, longitudinal optical (LO)-transverse optical (TO) splitting of the ν3 vibrational mode of CO2 was observed for pure CO2 ice and the 3:1, 2:1 & 1:1 mixtures as shown in Fig. 1b.16,17 LO-TO splitting arises due to long-range dipole interactions in the CO2 lattice and the position of the LO mode is sensitive to defects within the CO2 lattice.17 The CO2 in the NH3-rich mixtures (1:3 & 1:10) can be thought of as defects within the NH3 ice and hence the LO mode was not observed. The shape of the LO mode can also give insight into the mixing environment of CO2 mixtures. For example, Cooke et al. noted that the LO mode would split when inhomogeneous mixing occurred.17 No splitting of the LO mode was observed for 3:1, 2:1 & 1:1 CO2:NH3 mixtures which suggested homogeneous mixing occurred.
Shifts in the position of the vibrational absorption bands in the mixtures compared to the respective pure ice vibrational absorption bands can also be seen in Fig. 1. A red shift is associated with an increase in bond length, and hence a weakening of the bond associated with the absorption band. The reverse is true for observed blue shifts in the spectra. Fig. 2 shows the difference between the position of the pure ice vibrational absorption band and the position of the ice mixture vibrational absorption band (Δ![[small nu, Greek, tilde]](https://www.rsc.org/images/entities/i_char_e0e1.gif) = pure ice − mixed ice) against the [CO2]/[NH3] ratio (R).
= pure ice − mixed ice) against the [CO2]/[NH3] ratio (R).
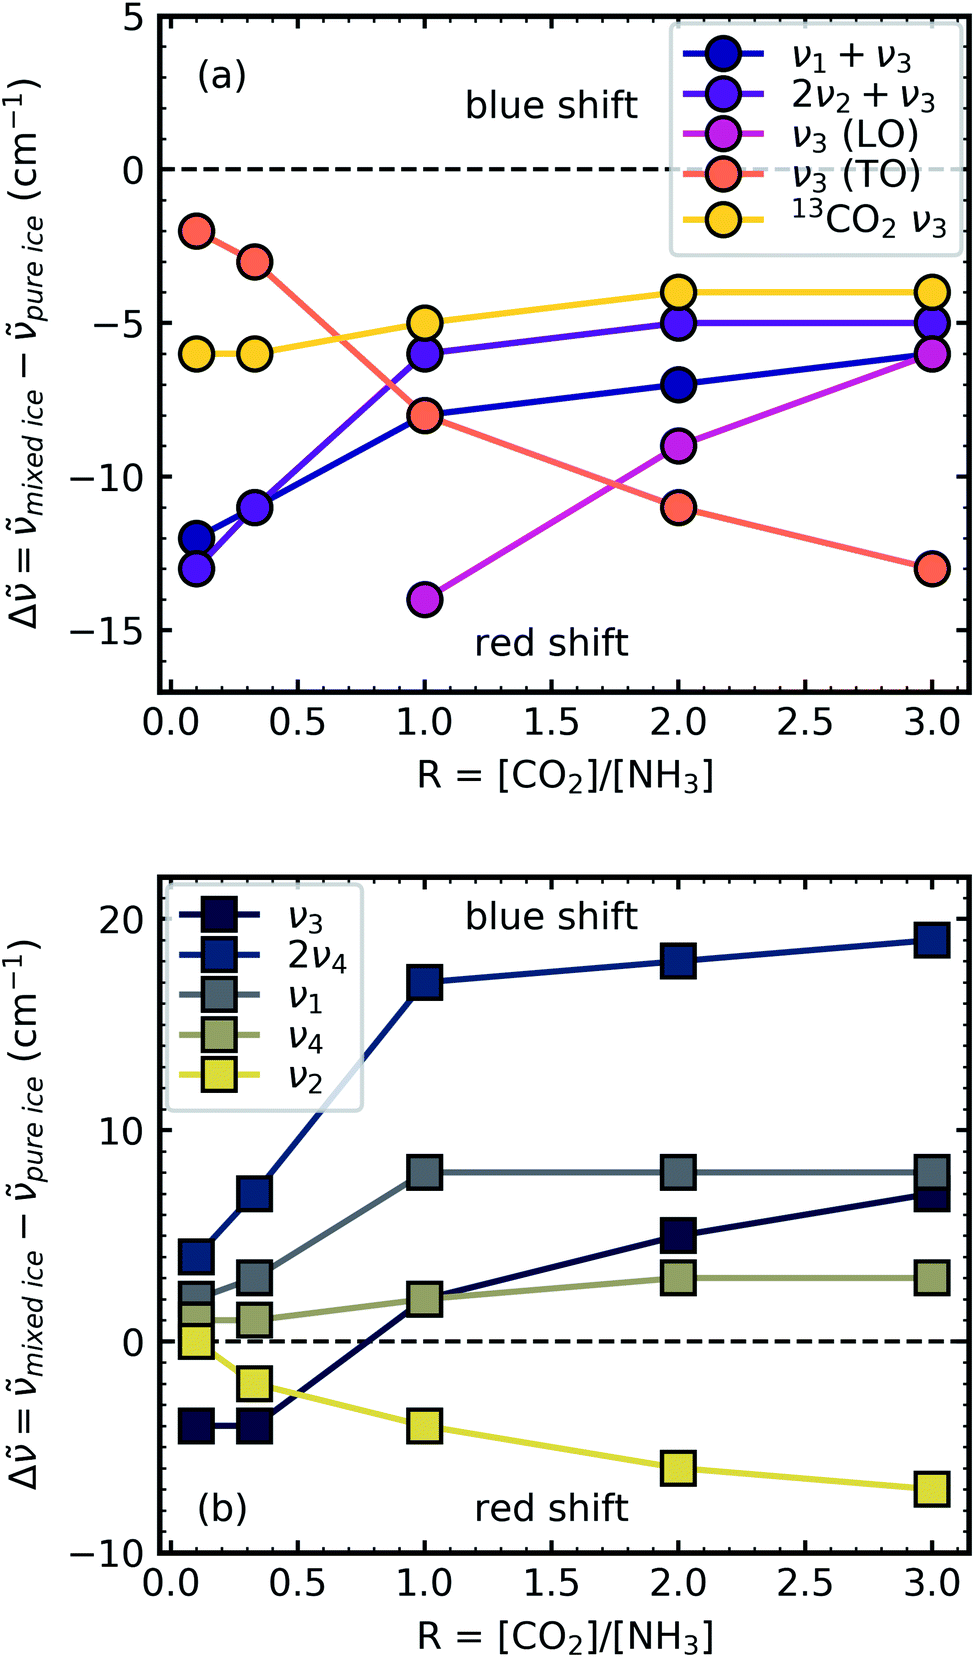 | ||
| Fig. 2 Scatter plots of the difference between the pure ice vibrational absorption band and the ice mixture vibrational absorption band (Δ = pure ice − mixed ice) against the [CO2]/[NH3] ratio (R) for (a) CO2 vibrational absorption bands and (b) NH3 vibrational absorption bands. Lines between the scatter points are to guide the eye only. | ||
All the CO2 vibrational absorption band positions in the mixtures (Fig. 2a) red shifted compared to the pure CO2 vibrational absorption bands. For all vibrational absorption bands, except for the ν3 TO mode, a progressive red shift was observed for increasing concentrations of NH3 (lower R values). This suggested a progressive weakening of the C![[double bond, length as m-dash]](https://www.rsc.org/images/entities/char_e001.gif) O bonds with increasing NH3 concentration. In contrast, a progressive red shift with decreasing concentrations of CO2 (higher R values) was observed for the ν3 TO mode.
O bonds with increasing NH3 concentration. In contrast, a progressive red shift with decreasing concentrations of CO2 (higher R values) was observed for the ν3 TO mode.
The ν3 TO mode absorption bands for the 3:1, 2:1 & 1:1 ratios also had a distinct broad, asymmetric profile which reduced in asymmetry for the NH3-rich mixtures, but not equivalent to the profile of pure CO2 ice. The asymmetry or inhomogeneous broadening of the TO mode absorption band suggested that the absorption band of the CO asymmetric stretch contained contributions from CO2 molecules in different bonding environments. In contrast, the relatively narrow profile of the TO mode absorption band for pure CO2 was indicative of a contribution from a largely single bonding environment and previous studies suggested that pure CO2 formed dimers upon deposition at 20 K.18,19 Where NH3 was dominant in the 1:10 ratio the CO2 molecules were akin to defects in the NH3 ice and were essentially matrix-isolated. This reduced CO2 dimerisation and thus presented a single bonding environment of the CO stretch as that of an isolated CO2 molecule. While NH3 was still in excess in the 1:3 ratio, evidence of the formation of CO2:NH3 molecular complexes were observed through the absorption band at 3253 cm−1. The shoulder on the TO mode absorption band at 2354 cm−1 also suggested that there were contributions from two bonding environments to the CO asymmetric stretch, most likely that of isolated CO2 and CO2:NH3 molecular complex. This was further supported by the increased asymmetry of the TO mode absorption band for the other mixtures which was likely a combination of several bonding environments that influenced the CO asymmetric stretch (e.g. CO2:NH3 molecular complex, CO2 dimers and isolated CO2 molecules). Therefore the progressive red shift in the peak position with decreasing concentration of CO2 reflected the change in asymmetry of the TO mode as a result of different local CO2 bonding environment, which arose due to the change in relative CO2 and NH3 concentrations. The combination modes of CO2 were considerably weaker and less sensitive to changes in the lattice compared to the ν3 asymmetric stretch of CO2. The progressive weakening of the CO2 combination modes with increasing NH3 concentration compared to pure CO2 reflected the changes in the CO2 bonding environments, as well as the relative decrease in the CO2 concentration.
For the NH3 vibrational modes in the mixtures (Fig. 2b) a progressive blue shift was observed as the CO2 concentration increased (higher R values) for the 2ν4, ν1 & ν4 absorption bands. This suggested a progressive strengthening of the N–H bonds with increasing concentrations of CO2. At lower concentrations of CO2 (1:10 & 1:3 ratios) the ν3 absorption band of NH3 was red shifted (Δ = −4 cm−1). However, a progressive blue shift was observed for increasing concentrations of CO2 for the other ratios. In addition, the NH3 vibrational modes in the CO2:NH3 mixtures also progressively narrowed with increasing concentration of CO2 compared to pure NH3 absorption bands. Pure NH3 ice has extensive intermolecular H-bonding present between the NH3 molecules.20 For the 1:10 ratio where the NH3 ice essentially has CO2 defects, the intermolecular H-bonding between the NH3 molecules was slightly perturbed. As the CO2 concentration increased the intermolecular H-bonding was progressively reduced and the formation of CO2:NH3 molecular complexes also occurred.
A progressive red shift was observed for increasing concentrations of CO2 for the ν2 absorption band in contrast to the behaviour of the other NH3 absorption bands which mainly blue shifted. At higher concentrations of CO2, NH3 molecules were likely to be bonded in a CO2:NH3 complex. The ‘T-shape’ of the CO2:NH3 complex resulted in a less restricted bending motion of the ν2 mode due to reduced intermolecular H-bonding in a CO2-rich environment.14
3.2 Thermal processing
After deposition at 20 K, the CO2:NH3 mixtures were thermally processed and analysed at discrete temperatures until desorption. Fig. 3 shows the mid-IR spectra of a CO2:NH3 mixture in a 1:1 ratio during thermal processing. Mid-IR spectra of the other ratios can be found in Section 2 of the ESI.† For reference, the thermal processing mid-IR spectra of pure CO2 and pure NH3 are shown in Fig. S8 and S9 of the ESI,† respectively.
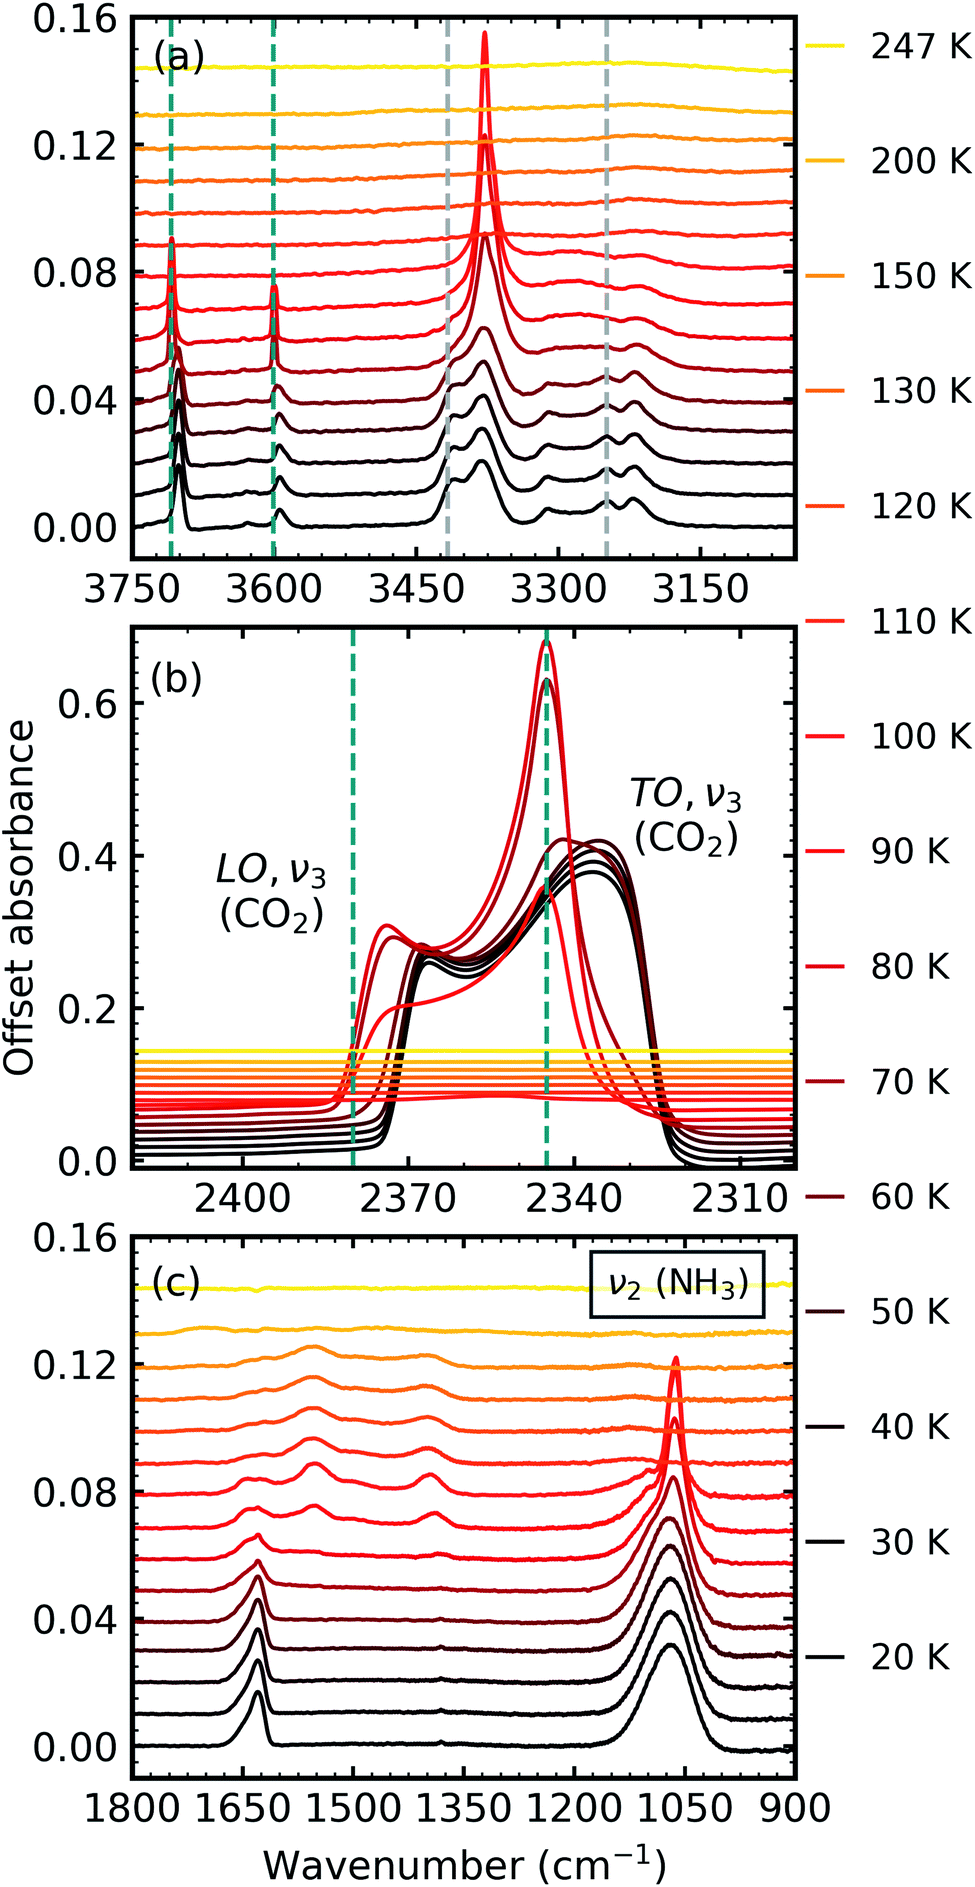 | ||
| Fig. 3 Mid-IR spectra of a CO2:NH3 mixture in a 1:1 ratio during thermal processing from 20 to 250 K. Spectra are offset on the y-axis for clarity. See Section S2 in the ESI† for the mid-IR spectra of the 3:1, 2:1, 1:3 & 1:10 ratios. (a) Segregation of the mixture was observed through the shift in the position of the CO2 absorption bands towards the position of pure CO2 absorption bands when deposited at 20 K which are indicated by blue dashed lines. Grey dashed lines indicate the CO2:NH3 molecular complex absorption bands which disappeared between 70–80 K. (b) LO-TO splitting of the ν3 absorption band of CO2. Segregation of the mixture was observed through the shift in the position of the LO and TO modes towards pure CO2 positions which are indicated by blue dashed lines. (c) A phase change was observed for NH3 through the splitting of the ν2 absorption band between 70–80 K. New bands between 1800–1200 cm−1 at 80 K indicated thermal reaction. | ||
Thermal processing induced several changes within the 1:1 CO2:NH3 mixtures as shown in Fig. 3. Segregation of the homogeneously mixed CO2:NH3 ice mixture was identified through a blue shift in the CO2 vibrational modes between 60–70 K towards the position of pure CO2 vibrational modes when deposited at 20 K (Fig. 3a and b). We note that the only IR absorption band of CO2 to shift during thermal processing was the LO mode of the ν3 asymmetric stretch which reached a maximum blue shift of ∼40 cm−1 at 80 K. Splitting of the ν2 fundamental mode of NH3 between 70–80 K signified a phase change in NH3 (Fig. 3c). A thermally induced reaction was initiated between 70–80 K and was observed through the appearance of new vibrational modes in the wavenumber region of 1800–1200 cm−1 (Fig. 3c). The vibrational modes of the CO2:NH3 complex also disappeared between 70–80 K (Fig. 3a). Both CO2 and NH3 desorbed between 110–120 K leaving behind a residue material which changed between 150–200 K before desorbing by 250 K.
The temperatures at which these changes occurred were dependent on the ratio and are listed in Table 3. Notably, no thermal reaction was observed for the 3:1 ratio and the mixture desorbed between 100–110 K.
:NH3 mixtures (3:1, 2:1, 1:1, 1:3 & 1:10)
| Observation | Ratio | ||||
|---|---|---|---|---|---|
| 3:1 |
2:1 |
1:1 |
1:3 |
1:10 |
|
| shshoulder | |||||
| CO2 segregation (K) | By 60 | 50–60 | 60–70 | 70–80 | 70–80 |
| NH3 phase change (K) | By 60 | 60–70 | 70–80 | 70–80 | 70–80 |
| New bands (K) | >90 | >80 | >80 | >80 | |
| New band positions (cm−1) | 1735 | 1734 | |||
| 1647 | 1647 | 1646sh | 1646 | ||
| 1620 | 1623 | 1627 | 1624sh | ||
| 1553 | 1554 | 1553 | 1554 | ||
| 1501sh | 1501 | 1506 | |||
| 1396 | 1396 | 1390 | 1389 | ||
| Disappearance of CO2:NH3 complex (K) |
80–90 | 70–80 | 70–80 | 70–80 | |
| CO2 desorption (K) | 90–100 | 90–100 | 100–110 | 100–110 | 110–120 |
| NH3 desorption (K) | 100–110 | 100–110 | 100–110 | 100–110 | 110–120 |
| Change in residue (K) | 150–200 | 150–200 | 170–200 | 170–200 | |
| Residue desorption (K) | 200–250 | 200–250 | 200–250 | 200–250 | |
:NH3 mixtures and pure NH3 deposited at 20 K and thermally processed to 90 K. Different splitting patterns were observed in the ν2 umbrella absorption band of NH3 for the CO2:NH3 mixtures compared to pure NH3 and also within the mixtures.
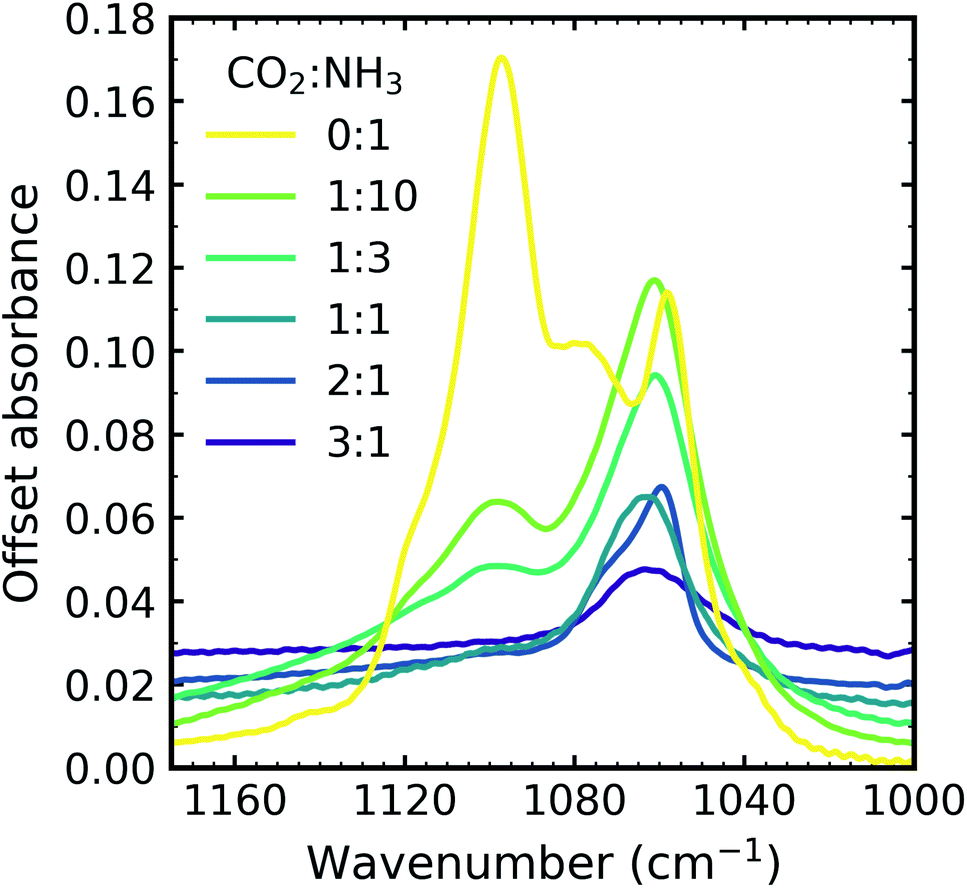 | ||
| Fig. 4 Mid-IR spectra of NH3 ν2 umbrella absorption band in the CO2:NH3 mixtures which were deposited at 20 K and thermally processed to 90 K compared with pure NH3 ice deposited at 20 K and thermally processed to 90 K. Spectra are offset on the y-axis for clarity and normalised to a thickness of 400 nm. | ||
Pure NH3 deposited at low temperatures (10–20 K) has been described as lacking long-range order or as ‘amorphous’.20,21 A more quantitative description has also been presented as containing nano-crystallites comprised of 64 NH3 molecules with a lower crystallite size limit of 1.58 nm at 20 K. Depositions at higher temperatures were comprised of larger crystallites (e.g. NH3 deposited at 60 K formed crystallites comprised of 756(±20%) molecules with a crystallite size of 3.62 nm).22 A phase change for pure NH3 deposited at 20 K and then thermally processed occurred at 57 K (ref. 21) and was signified by a complex splitting pattern similar to that presented in Fig. 4 for pure NH3 (0:1). Different splitting patterns have also been observed for NH3 deposited between 65–85 K and above 85 K.20 The splitting pattern of the 1:10 & 1:3 ratios were similar to that of pure NH3 deposited between 65–85 K and the splitting pattern of the other ratios was similar to that of pure NH3 deposited above 85 K.
The bending umbrella motion of the NH3 molecules described by the ν2 vibrational mode was highly perturbed by the surrounding environment. The deposition temperature affected the crystallite size and hence the number of crystallite grain boundaries present. A crystallite grain boundary can be considered as a defect within the ordered H-bonded crystal structure. Broader absorption bands for the ν2 vibrational mode were observed at lower deposition temperatures of NH3 as there were more defects within an ordered H-bonded crystal structure due to the larger surface-area-to-volume ratio of the crystallites. Narrower peaks were observed for NH3 deposited at higher temperatures as the crystallite sizes were larger resulting in fewer defects present with the H-bonded crystal (i.e. lower crystallite surface-area-to-volume area) and more long-range order. However, thermal processing of the low deposition temperature ices was unable to overcome pre-existing H-bonding within the crystallites that were already formed during deposition, hence forming an ice sample with more crystallite grain boundaries than the equivalent ice deposited at the thermal processing temperature.20 This was reflected in the profile of the ν2 absorption band in Fig. 4 with an extensive splitting pattern resulting from the formation of crystallites of random shapes and sizes.
In Section 3.1 we refer to the presence of CO2 within the mixtures disrupting the H-bonding network between NH3 molecules. As a consequence, larger NH3 crystallites were able to form (with fewer crystallite grain boundaries) in CO2:NH3 mixtures with higher concentrations of CO2. The difference in the splitting patterns within ν2 absorption band was a direct effect of the different concentrations of CO2 present within the mixtures and we propose that the NH3 crystallite formation is dependent on the CO2:NH3 ratio.
3.3 Residue
A thermal reaction was observed for all CO2:NH3 mixtures above ∼80 K, except for the 3:1 ratio where no thermal reaction was observed. Previous thermal processing studies of CO2:NH3 mixtures have identified ammonium carbamate and carbamic acid as thermal products above 150 K.3–7 However, discrepancies exist over the assignment of vibrational modes (see Table S2 in the ESI† for examples). The focus of this study was not to assign all the vibrational modes as this requires complementary theoretical calculations. Instead, differences between the functional groups which compose ammonium carbamate or carbamic acid were used e.g. ammonium carbamate is characterised by strong COO− asymmetric and symmetric stretches, while carbamic acid is characterised by CO and C–O stretches.
Fig. 5 shows the residue spectra at 150 and 200 K for the 2:1, 1:1, 1:3 and 1:10 ratios. The N–H and O–H stretching region is shown in Fig. 5a. Ammonium carbamate and carbamic acid were identified as products in the residue in Fig. 5b at 150 and 200 K and was in agreement with several previous studies.3,5,6 The intensity of the residues, and hence the amount of residue formed, was ratio-dependent with the 1:2 & 1:1 residues significantly weaker in intensity compared to the 1:3 & 1:10 ratios. The most intense residue was observed for the 1:3 ratio similar to a previous study which investigated CO2:NH3 mixtures (1:1, 1:2, 1:3) and observed that a 1:2 ratio had the largest amount of residue material.6 While we also observed a reaction in the 2:1 ratio, this residue had the least amount of residue material and no reaction was observed in our 3:1 ratio, agreeing with Noble et al. that CO2-rich mixtures hinder thermal reaction.7
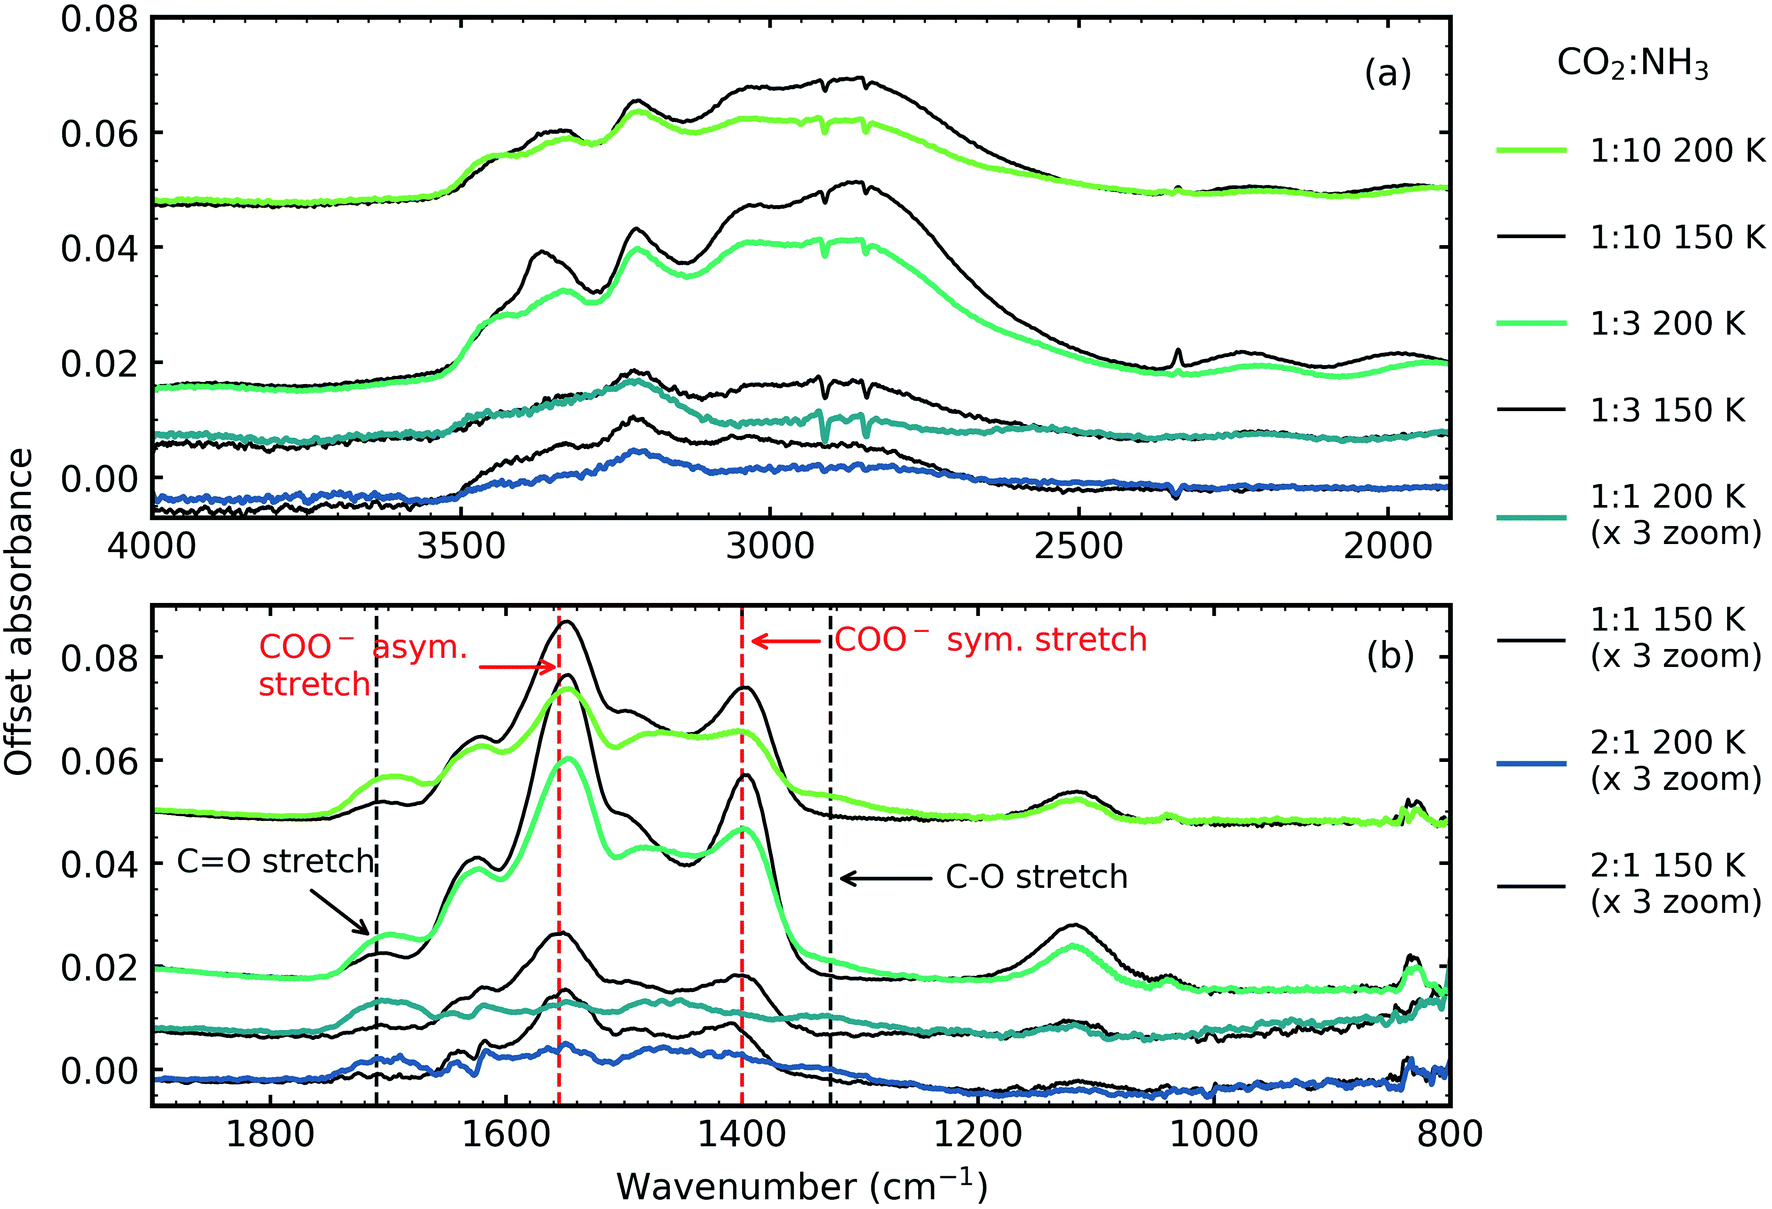 | ||
| Fig. 5 Mid-IR spectra of CO2:NH3 ices thermally processed to 150 K (black traces) and 200 K (coloured traces) (a) N–H and O–H stretching region (4000–1900 cm−1) and (b) 1900–800 cm−1 with dashed lines indicating COO− asymmetric and symmetric stretches and CO and C–O stretches. The 2:1 and 1:1 ratios have been magnified by a factor of 3 for clarity. All spectra are normalised to a thickness of 400 nm and offset on the y-axis for clarity. | ||
Two NH3 molecules per one CO2 molecule are required to form ammonium carbamate, so it is not surprising that our 1:3 ratio had the most intense residue. Yet, the 1:10 ratio that was comprised of only 9% CO2 produced a more intense residue than the 1:1 & 2:1 ratios indicating a complex interplay between the different chemical and physical properties of the mixtures and is discussed further in Section 5.
4 VUV results & discussion
4.1 Deposition at 20 K
Fig. 6 shows the VUV spectra of CO2:NH3 mixtures (4:1, 2:1, 1:3) deposited at 20 K compared with pure CO2 (1:0) and pure NH3 (0:1) also deposited at 20 K.
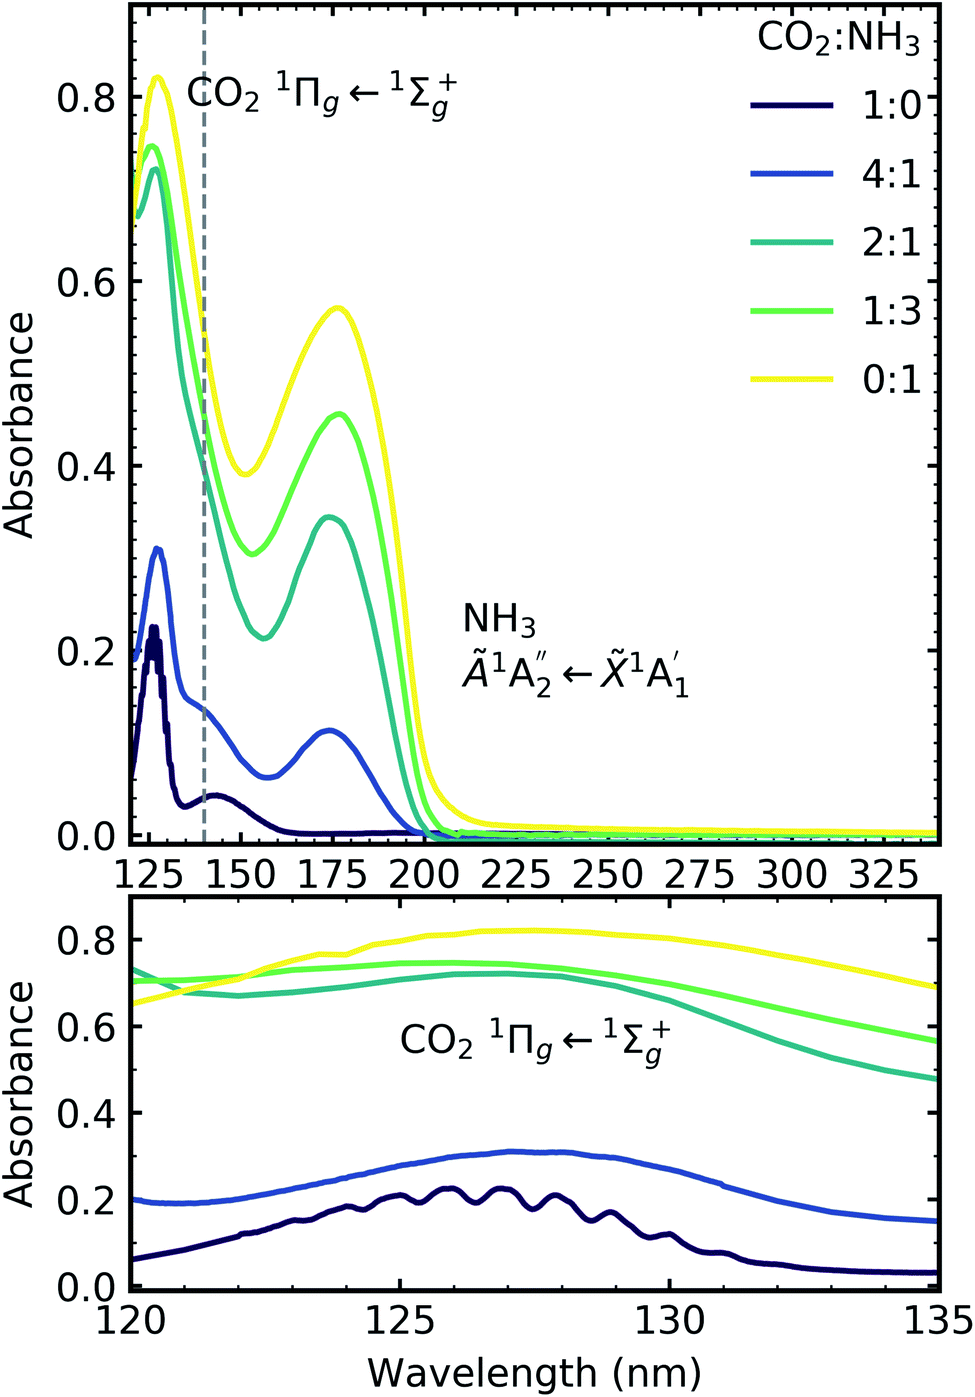 | ||
| Fig. 6 VUV spectra of CO2:NH3 mixtures (4:1, 2:1 & 1:3) compared with pure CO2 (1:0) and pure NH3 (0:1) between 120–340 nm (top plot). Dashed line highlights the 1Δu ← 1Σ+g electronic transitions of CO2 at ∼140 nm for the 4:1 and 2:1 ratios. Bottom plot shows the vibrational structure of the CO2 1Πg ← 1Σ+g transition between 120–135 nm. Spectra are normalised to a thickness of 200 nm. | ||
Pure CO2 deposited at 20 K has an absorption band centred around 126 nm due to the 1Πg ← 1Σ+g electronic transition and exhibits extensive vibrational bands.23 The average separation between the vibrational bands was 619 cm−1 in keeping with previous studies23–25 and corresponded to the ν2 bending mode of CO2 suggesting a change in geometry of the molecule from linear to bent upon excitation.25 A second, weaker absorption band was observed centred around 143 nm due to 1Δu ← 1Σ+g electronic transition.23 Pure NH3 deposited at 20 K has an absorption band centred at 128 nm which was likely due to contributing D, E, F and G ← X Rydberg transitions.22 A second, weaker absorption band centred at 178 nm was observed due to the  electronic transition.20
The positions of the absorption bands of the 1Πg ← 1Σ+g and 1Δu ← 1Σ+g electronic transitions of CO2 and the  electronic transition of NH3 overlap between 120–150 nm. The NH3 electronic transitions have a higher cross section compared to that of the CO2 electronic transitions and for the 1:3 ratio,
  electronic transition of NH3 largely obscures the CO2 electronic transitions. For the 4:1 & 2:1 ratios, the 1Πg ← 1Σ+g electronic transition of CO2 was observed centred at 127 nm. Unlike pure CO2, no vibrational bands were observed in the 1Πg ← 1Σ+g transition for the 4:1 and 2:1 mixtures at 20 K. The 1Δu ← 1Σ+g electronic transition of CO2 was observed as a shoulder on the absorption band of the contributing D, E, F and G ← X Rydberg transitions of NH3 at 141 nm for the 4:1 & 2:1 ratios. The
  transition of NH3 was observed in all CO2:NH3 mixtures and slightly blue shifted compared to the pure NH3 band.
4.2 Thermal processing
Fig. 7, 8 and 9 show the thermal processing VUV spectra of CO2:NH3 mixtures in ratios of 4:1, 2:1 & 1:3 respectively.
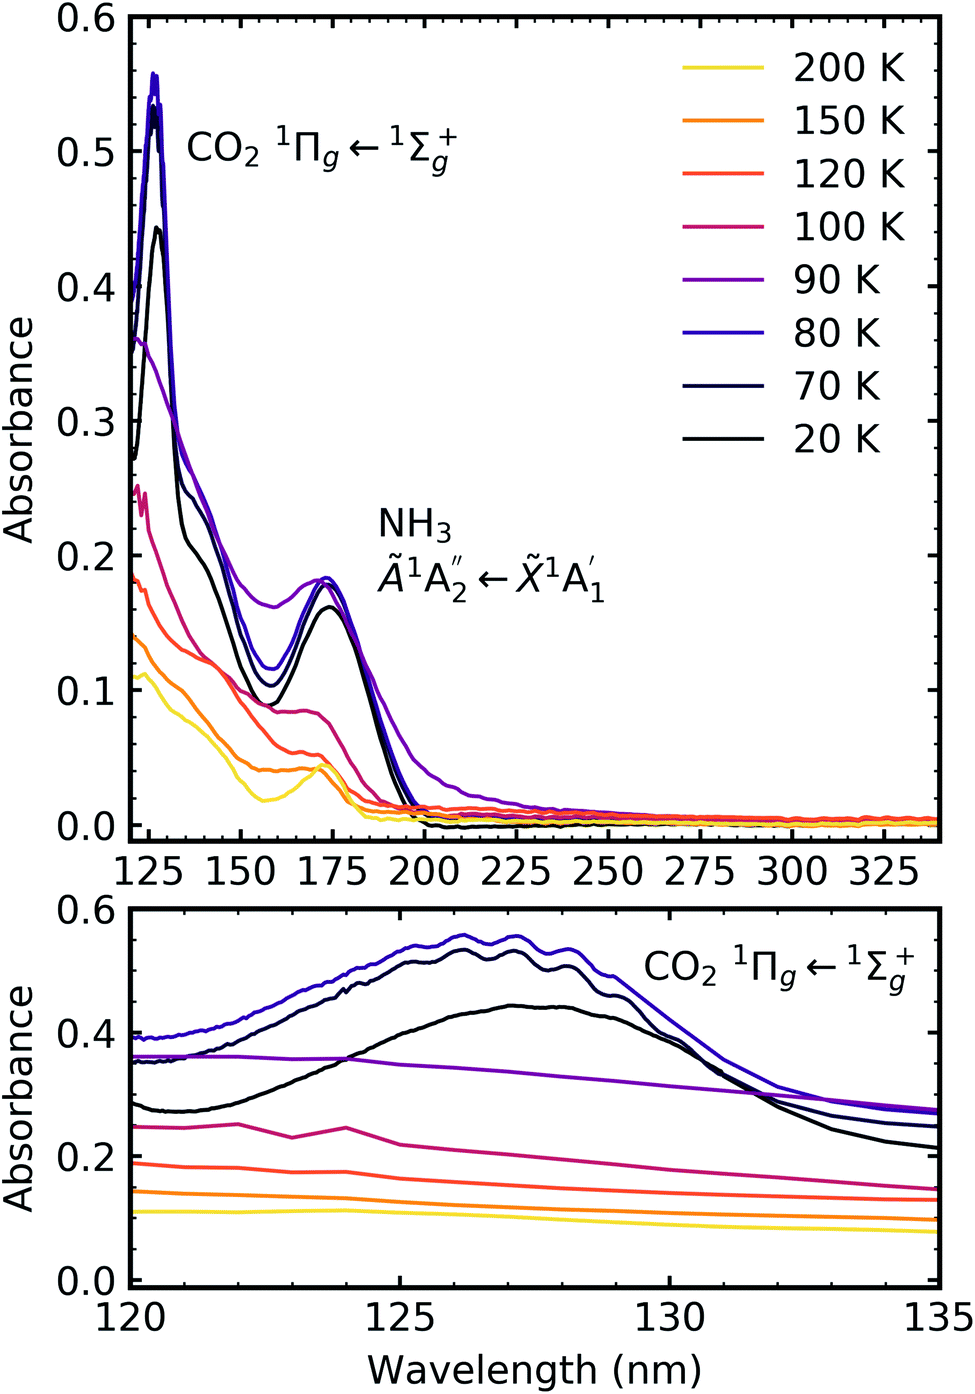 | ||
| Fig. 7 VUV spectra of the thermal processing of a 4:1 CO2:NH3 mixture from 20–200 K between 120–340 nm (top plot). Bottom plot shows the vibrational structure of the CO2 1Πg ← 1Σ+g transition between 120–135 nm. | ||
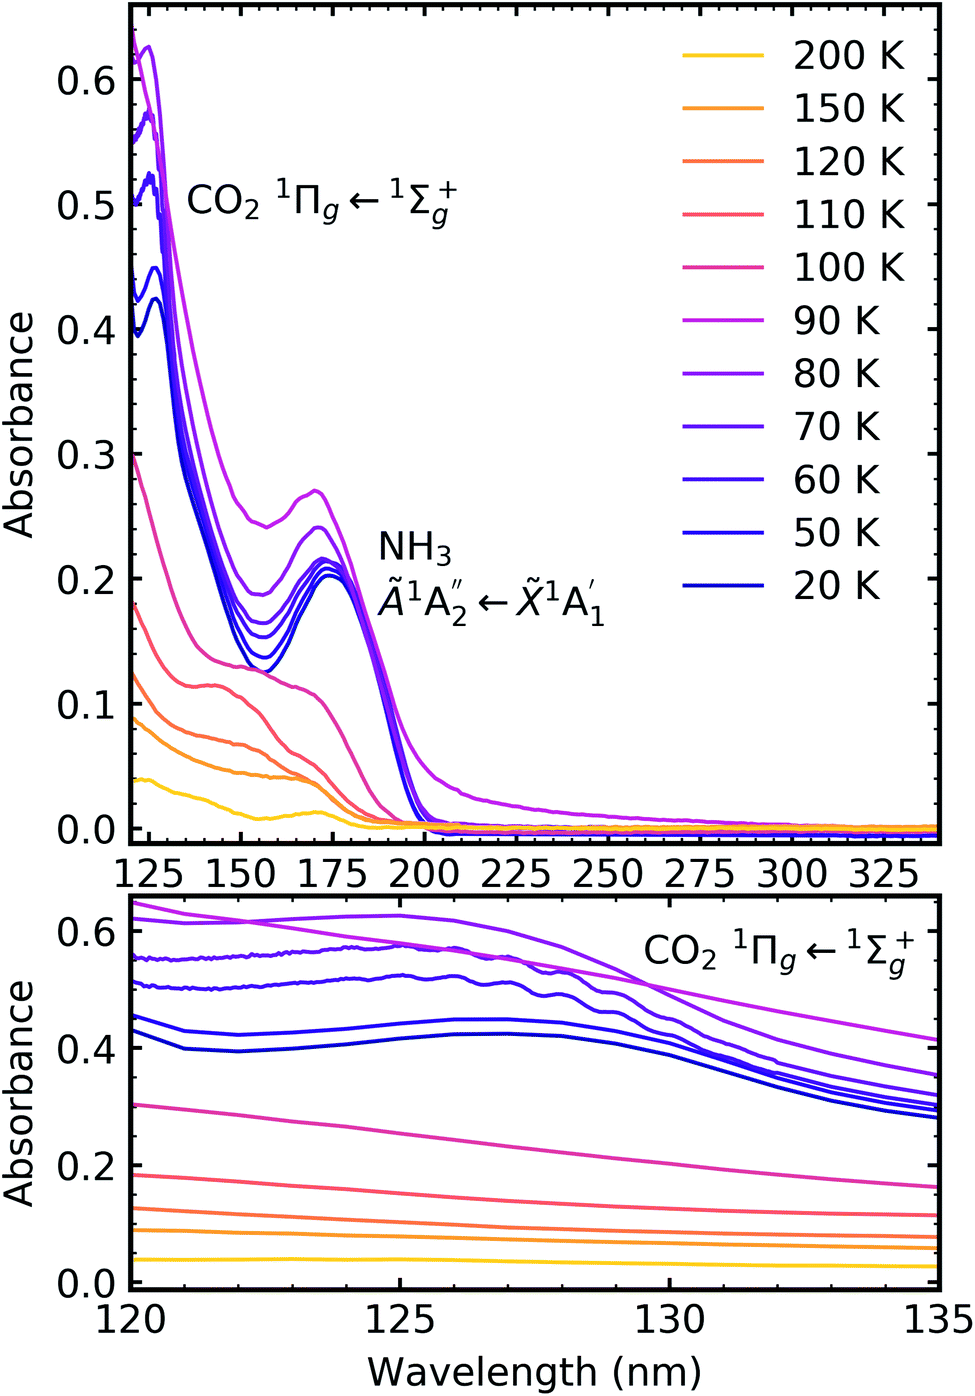 | ||
| Fig. 8 VUV spectra of the thermal processing of a 2:1 CO2:NH3 mixture from 20–250 K between 120–340 nm (top plot). Bottom plot shows the vibrational structure of the CO2 1Πg ← 1Σ+g transition between 120–135 nm. | ||
 | ||
| Fig. 9 VUV spectra of the thermal processing of a 1:3 CO2:NH3 mixture from 20–200 K between 120–340 nm (top plot). Bottom plot shows the lack of vibrational structure of the CO2 1Πg ← 1Σ+g transition between 120–135 nm. | ||
Thermal processing VUV spectra of pure CO2 and pure NH3 ices are shown in Fig. S9 and S10 of the ESI,† respectively and the results are summarised briefly here. For pure CO2, vibrational structure was observed on the 1Δu ← 1Σ+g transition of CO2 at 70 and 80 K with an average space separation of 1484 cm−1 at 70 K and 1444 cm−1 at 80 K. This vibrational structure was not observed at deposition (20 K). For pure NH3, factor-group (Davydov) splitting of the  transition of NH3 was observed at 70 K indicating a phase change.20
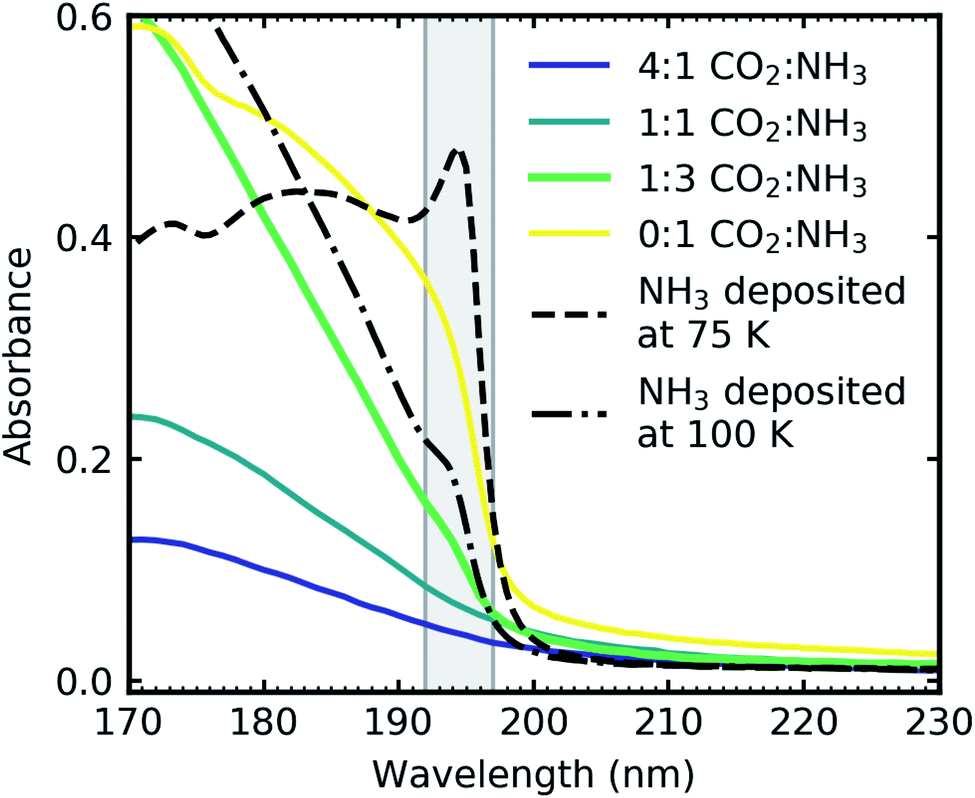
For the CO2:NH3 mixtures at 20 K no vibrational structure was observed for the 1Πg ← 1Σ+g transition of CO2 for the 4:1 & 2:1 ratios (obscured in the 1:3 ratio). However, vibrational structure was observed upon thermal processing to 70 K for the 4:1 ratio and 60 K for the 2:1 ratio (VUV spectra below 70 K were not obtained for the 4:1 ratio). In agreement with the mid-IR results (see Table 3), desorption of CO2 occurred between 90–100 K and was observed through the disappearance of the 1Πg ← 1Σ+g transition for both the 4:1 & 2:1 ratios.
For all ratios, a blue shift in the  transition of NH3 upon thermal processing was observed. Factor-group splitting observed in the
  transition of pure NH3 in Fig. S11† of the ESI was not observed in the mixtures. However, a shoulder at 194 nm was observed on the absorption band of the
  for the 1:3 ratio which was not observed in pure NH3 ice, vide infra. The
  transition of NH3 disappeared by 100 K revealing new absorption bands due to thermal reaction for all ratios including the 4:1 ratio where the equivalent mid-IR 3:1 ratio did not have an observable residue.
4.3 Crystallisation of NH3 in the binary mixtures
It was established in Section 3.2.1 that the phase change that occurred between 60–80 K was dependent on the ratio of the CO2:NH3 mixtures. Mixtures with higher concentrations of CO2 formed larger crystallites and so had a more crystalline structure compared to mixtures with high concentrations of NH3.
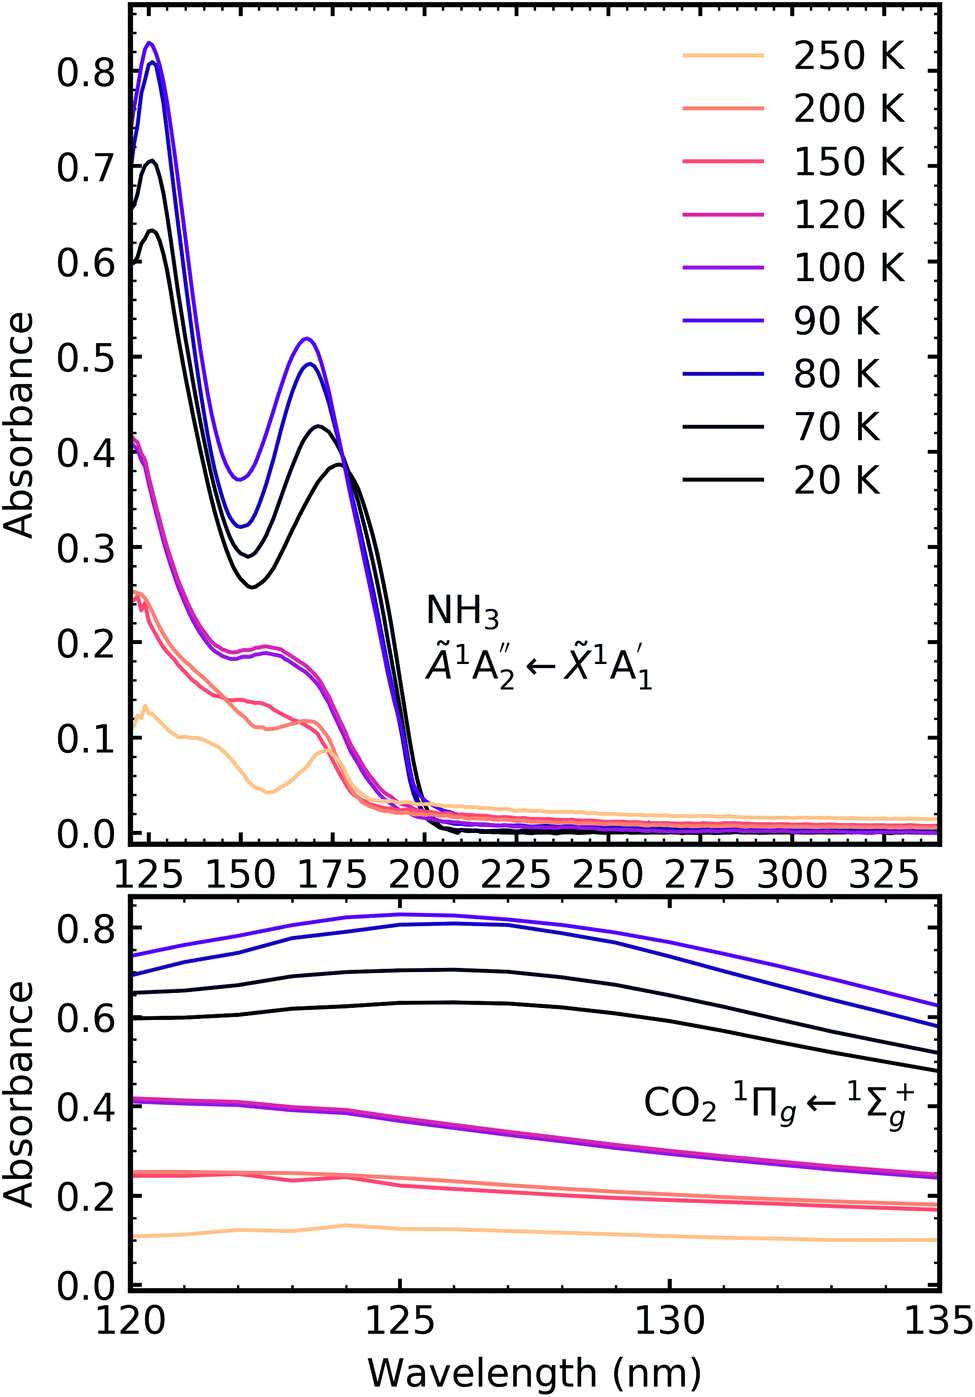
The subtle morphological changes observed in the mid-IR spectra were more difficult to observe in the VUV spectra. A shoulder observed at 194 nm on the  transition of NH3 in the 1:3 ratio was assigned as a Wannier–Mott exciton.20 Wannier–Mott excitons were observed in NH3 ices deposited above 65 K and are linked to the morphology of the ice with it being most prominent in ices with more crystallites.20
Fig. 10 shows the VUV spectra of the Wannier–Mott exciton peak for the 1:3 CO2:NH3 mixture compared to Dawes et al. data of pure NH3 deposited at 75 K and 100 K (ref. 20) and the 2:1 & 1:3 CO2:NH3 mixtures where no Wannier–Mott exciton peak was observed. The exciton peak was much more pronounced for pure NH3 ice deposited at 75 and 100 K compared to the exciton peak observed in the 1:3 ratio as shown in Fig. 10. The intensity of the exciton peak has been linked to NH3–NH3 crystallite boundaries which is why we observed an exciton peak in the 1:3 ratio. However, the exciton peak in the 1:3 ratio was considerably less intense than the exciton peak in pure NH3 ices shown in Fig. 10. As the mixture exists as regions of segregated NH3 interspersed between regions of segregated CO2 ice, there are fewer crystallite grain boundaries for the exciton to propagate similar to a thickness dependence observed in pure NH3.24
 | ||
| Fig. 10 VUV spectra CO2:NH3 mixtures (4:1, 2:1 & 1:3) deposited at 20 K and thermally processed to 90 K and pure NH3 deposited at 75 K (dash) and 100 K (dash-dot) from Dawes et al.20 The grey shading indicates the area of the Wannier–Mott exciton which was observed in only the 1:3 CO2:NH3 mixture (green) and pure NH3 deposited at 75 K and 100 K. Spectra are normalised to a thickness of 200 nm and the pure NH3 deposited at 75 and 100 K are further scaled by 0.3. | ||
4.4 Residue
Ammonium carbamate and carbamic acid were identified at 150 K and 200 K for all mid-IR ratios apart from the 3:1 ratio (Fig. 5) with evidence of thermal conversion of ammonium carbamate to carbamic acid between 150–200 K. Fig. 11 shows the residue VUV spectra at 150 and 200 K for the 4:1, 2:1 & 1:3 ratios. At 150 K all ratios had a peak at ∼150 nm which decreased upon thermal processing to 200 K. We have tentatively assigned this peak to an electronic transition of ammonium carbamate from the analysis of the mid-IR results which showed that vibrational absorption bands associated with ammonium carbamate decreased between 150–200 K. A dash-dot line in Fig. 11 indicates a shoulder at 170 nm which resolved into a more distinct peak upon thermal processing from 150 to 200 K. We tentatively assigned this to an electronic transition of carbamic acid as mid-IR results indicated that carbamic acid formation increased between 150–200 K.
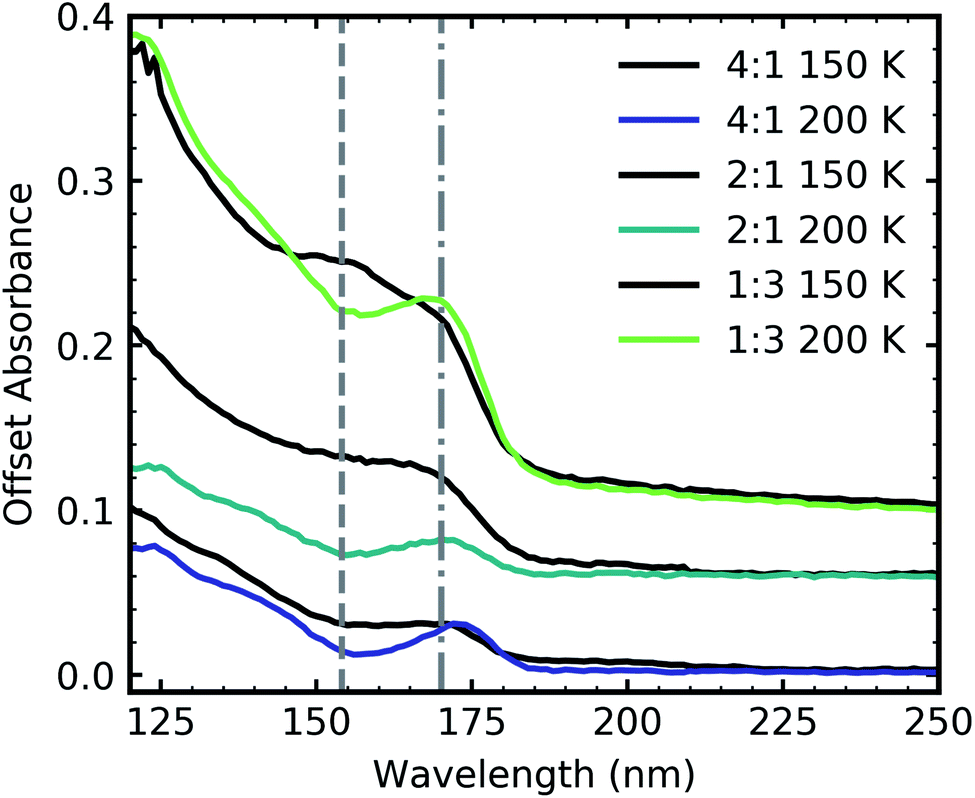 | ||
| Fig. 11 VUV residue spectra of CO2:NH3 mixtures (4:1, 2:1 & 1:3) at 150 and 200 K after thermal processing from deposition at 20 K. The dash-dot line highlights a feature at 152 nm and the dashed line highlights a feature at 170 nm. Spectra are normalised to a thickness of 200 nm and offset on the y-axis for clarity. | ||
A noticeable difference between the mid-IR and VUV residue spectra was the presence of a residue for the VUV 4:1 ratio. The almost equivalent mid-IR 3:1 ratio showed no observable residue. However, a residue material could have been present but in trace amounts below the sensitivity of mid-IR spectroscopy. Even the observed mid-IR 2:1 & 1:1 residues were significantly less intense than the mid-IR 1:3 & 1:10 ratios indicating less residue material.
4.5 Rayleigh scattering tails
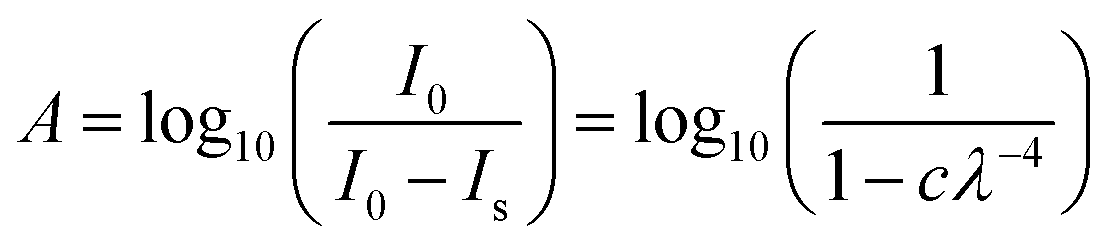
Rayleigh scattering tails have been observed in VUV spectra of several astrophysical ices which did not fully wet the substrate and provided information on the morphology of the ice.26,27 Rayleigh scattering tails were observed in the VUV thermal processing spectra (Fig. 7–9). While the ices used in this work were of a thickness where coverage of the surface is expected, if the surface of the ice film was not uniformly smooth then a rough, clumpy surface can scatter the light causing a scattering tail to be observed.Rayleigh scattering tails occur when particle sizes are less than λ/10 and the intensity of scattered light (Is) is proportional λ−4 such that:28,29
| Is = I0 × c × λ−4 | (1) |
In the VUV absorption spectra at λ > 215 nm, where no absorption peaks were observed, the only contribution to the loss of intensity in transmitted intensity (It) was due to scattering. Therefore, by treating the It as equal to I0 minus Is and using the Beer–Lambert Law, the following simple Rayleigh model was fitted:
 | (2) |
A more meaningful way of representing the changes observed in the scattering from the ice samples is to calculate the fractional change in the constant of proportionality of the processed ice relative to the constant of proportionality at deposition (Δc):
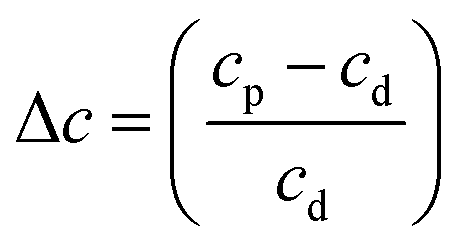 | (3) |
Fig. 12 shows the thermal evolution of Δc for pure NH3 and the CO2:NH3 mixtures. The scattering tails for pure CO2 ice were outside the Rayleigh regime. The Rayleigh scattering for pure NH3 and the CO2:NH3 indicated the presence of particles suggesting that both pure NH3 and the mixtures did not cover the substrate as uniformly smooth films and instead formed rough ices with ‘clumps’ on the surface. This probably arose due to the non-wetting behaviour of NH3, investigated previously on Au and amorphous water substrates.30 Single peaks from temperature-programmed desorption studies indicated that multilayers formed due to the preference of NH3 to bind to neighbouring molecules rather than the substrate. While CO2 ice is also known to exhibit non-wetting behaviour at low coverages, eventually CO2 will cover the entire substrate in a uniform film,31 with a smooth surface or with particles that are outside of the Rayleigh regime and no Rayleigh scattering tails could be fitted using eqn (2) for CO2 ice.
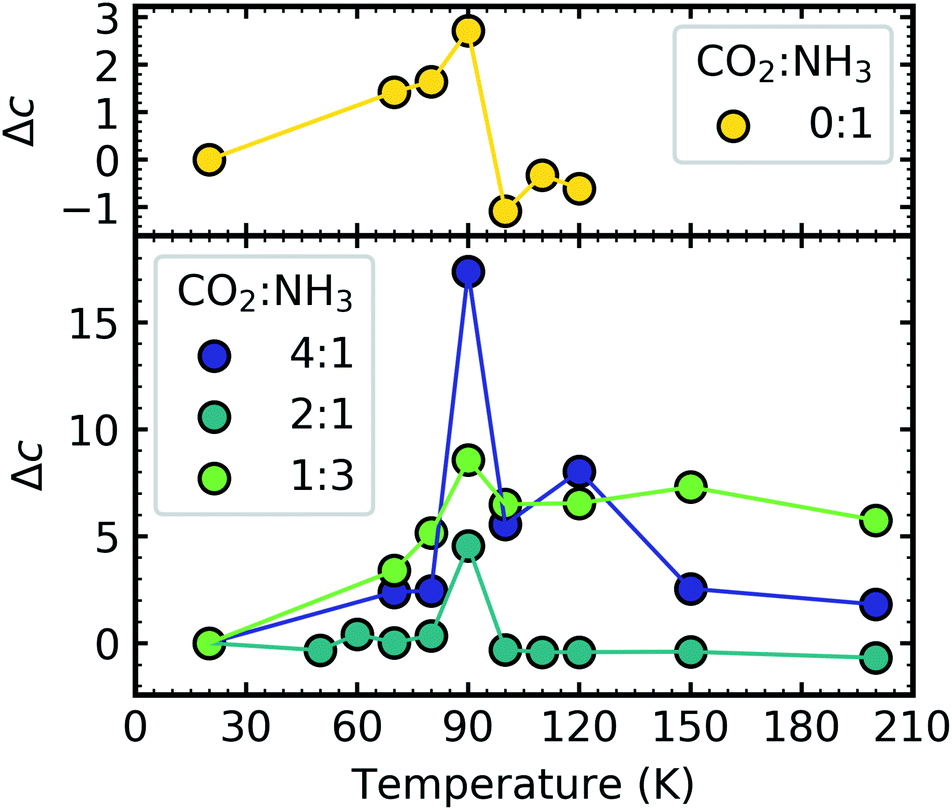 | ||
| Fig. 12 Comparison of the fractional change (Δc) in the constant of proportionality of the processed ice (cp) relative to the constant of proportionality at deposition (cd) versus thermal processing temperature after deposition at 20 K for pure NH3 ice (0:1) and CO2:NH3 mixtures (3:1, 2:1, 1:1, 1:3, 1:10). Δc are normalised to a thickness of 200 nm. | ||
For pure NH3 (0:1) and the CO2:NH3 mixtures a spike in the Δc value at 90 K was observed. We suggest that the spike in the Δc value for NH3 was due to molecular rearrangement and macroscopic change of morphology initiated by the phase change. However, the spike in the Δc value of the CO2:NH3 mixtures at 90 K is unlikely to be due to an NH3 phase change. Table 3 tells us that the observed phase change of NH3 in the CO2:NH3 mixtures in the mid-IR study, while ratio-dependent, occurred below 80 K. This was corroborated in Fig. 12 where a slight increase in the value of Δc was observed between 20–80 K. Segregation can also be ruled out as this, while also ratio-dependent, occurred below 80 K. This is further supported by the fact that the largest Δc spike was observed in the 4:1 ratio which had segregation and NH3 phase temperatures below 60 K. We suggest that the spike in the Δc value was due to CO2 desorption. The 4:1 and 2:1 ratios have the largest amount of CO2 in the mixtures and the lowest CO2 desorption temperatures (Table 3). Whereas, the CO2 in the 1:3 ratio desorbed at the same temperature as NH3 between 100–110 K likely due to the CO2 being embedded within the NH3 ice. Desorption of CO2 will change the structure of the CO2:NH3 mixture and possibly the refractive index of the ice which may cause the spike in Δc. The subsequent macroscopic smoothing of the surface could be attributed to the thermal reaction which is initiated around 80 K causing rearrangement of the ice surface and hence a decrease in the Δc value after CO2 desorption.
5 Discussion
We set out with the aim of demonstrating the impact that one discrete experimental parameter, the stoichiometric mixing ratio, had on the chemical and physical properties of the CO2:NH3 ice system and the subsequent consequence that this may have on thermally induced molecular synthesis.
From our combined mid-IR and VUV spectroscopic results we were able to conclude that CO2-rich, equal-parts and NH3-rich mixtures had a thermally induced reaction at ∼80 K. A thermally induced reaction at ∼80 K was in agreement with several previous studies which deposited CO2:NH3 mixtures at low temperatures (10–20 K).3,5,6 For other studies which deposited at higher temperatures1,2,7 and/or involved isothermal studies,8,9 direct comparison with our results is more difficult when concerning the temperature at which thermal reaction was initiated. For example, Potapov et al. reported a lower thermal reaction temperature of 65 K for a KBr substrate.9 It is uncertain what the cause of this discrepancy is, although it may be attributed to the different experimental conditions used.
Our residue material at 150–200 K was identified as a mixture of ammonium carbamate and carbamic acid from the literature3–7 which underwent a further reaction between 150–200 K as a conversion of ammonium carbamate to carbamic acid.6,7 We also identified a ratio-dependence on the amount of residue material present at 150 and 200 K with the largest amount observed in the 1:3 ratio and the least amount observed in the CO2-richest ratios (i.e. mid-IR 3:1 and VUV 4:1). While it could simply be put that ammonium carbamate was the major product at 150 K and to form it requires two NH3 molecules per every one CO2 molecule, then stoichiometrically the 1:3 ratio was the most ideal. However, we observed differences within both the physical and chemical properties of the CO2:NH3 mixtures which provided a comprehensive understanding of how thermally induced molecular synthesis occurred within this system.
We present the first mid-IR study of CO2:NH3 mixtures with the substrate at an oblique angle with respect to the IR radiation. This allowed us to probe the LO and TO modes of the ν3 absorption band of CO2 and further characterise the bonding environment of CO2 within the mixtures. The absence of a LO mode in the 1:10 & 1:3 ratio led us to suggest that the CO2 molecules were largely matrix isolated in an NH3 matrix. Additional vibrational modes associated with the CO2:NH3 molecular complex in the 1:3 ratio also suggested the presence of CO2:NH3 molecular complexes. LO-TO splitting and the asymmetry of the TO absorption bands suggested that the 3:1, 2:1 & 1:1 ratios had bonding environments which included CO2 dimers, isolated CO2 and CO2:NH3 molecular complexes.
This detailed characterisation of the CO2:NH3 mixtures at deposition aided our interpretation of the differing NH3 crystallite structures observed during thermal processing between the CO2:NH3 mixtures. A schematic diagram of the different NH3 crystallite structures for pure NH3 and the CO2:NH3 mixtures is shown in Fig. 13. The NH3-rich ratios were identified as having smaller crystallites of similar shapes and sizes (i.e. more crystallite grain boundaries) and equal-parts and CO2-rich mixtures were identified as having larger crystallites or crystalline structure (i.e. less crystallite grain boundaries).
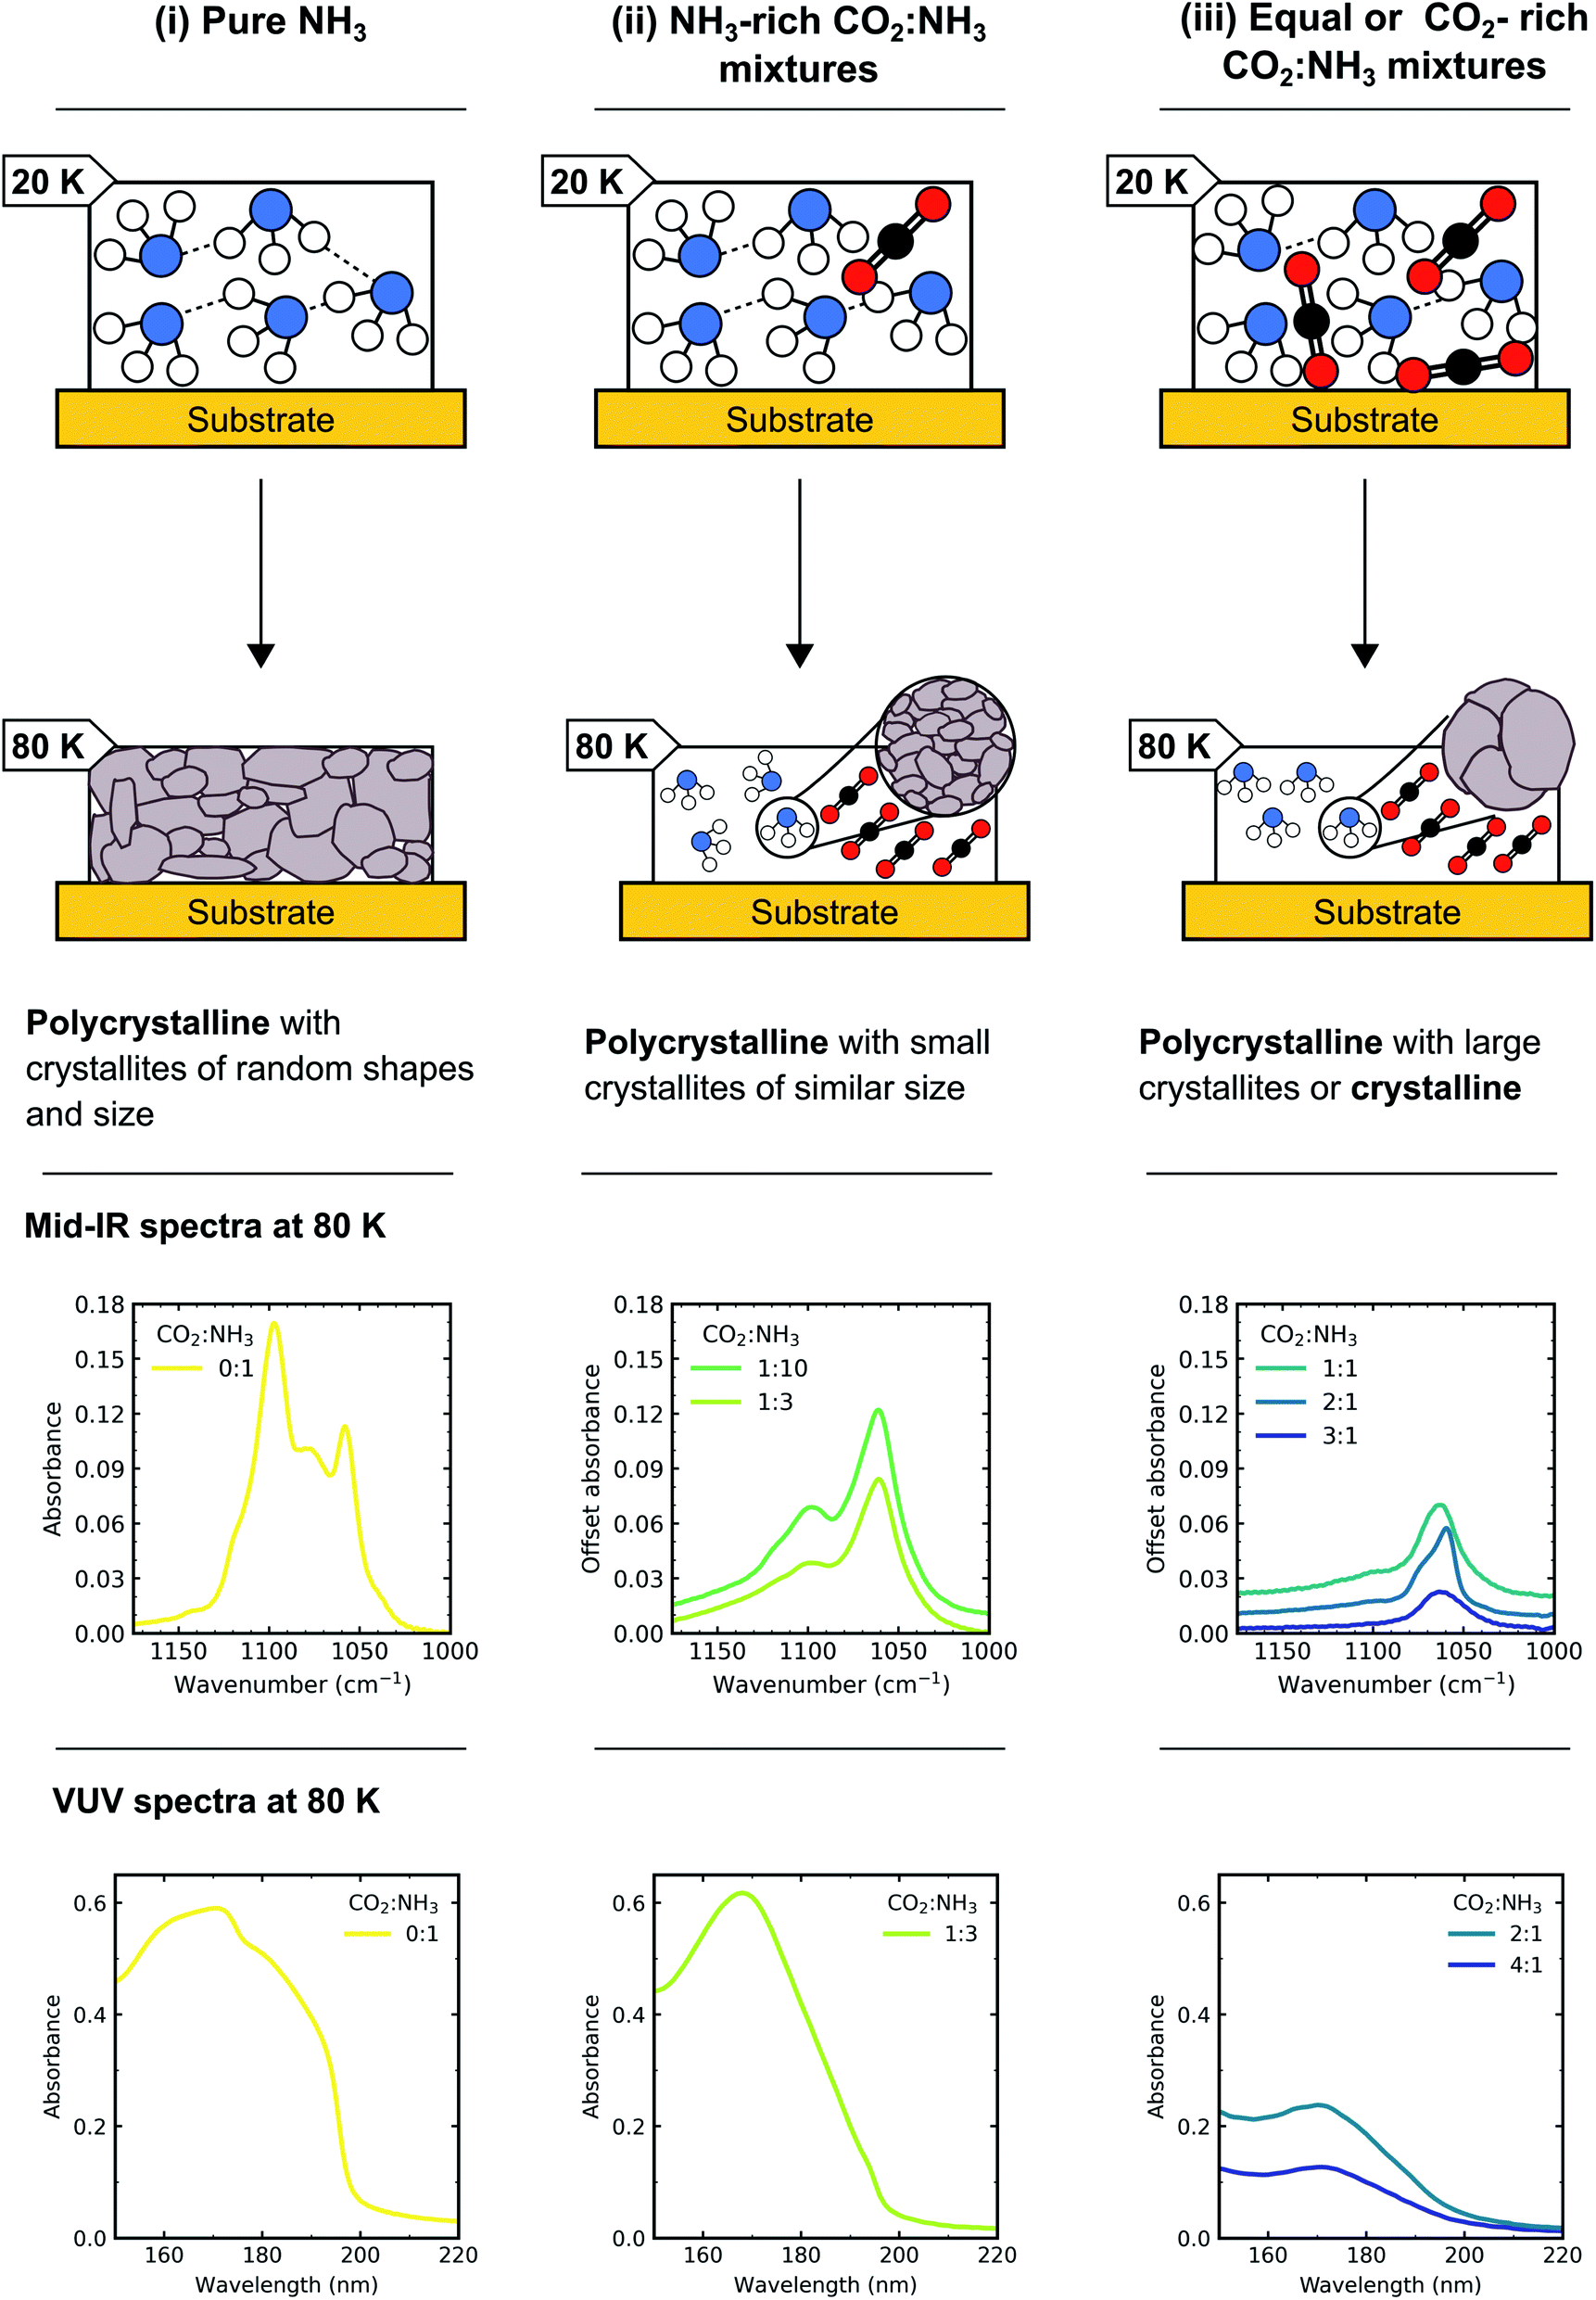 | ||
| Fig. 13 Schematic diagram of how the morphology of NH3 changed depending on the ratio of the CO2:NH3 mixture. (i) Pure NH3 (0:1) forms extensive H-bonds at 20 K some of which remain intact upon heating to 80 K so that a polycrystalline structure with crystallites of random shapes and sizes formed. (ii) CO2:NH3 1:10 and 1:3 ratios formed less extensive H-bonding than pure NH3 at 20 K due to the presence of CO2 and so upon heating to 80 K, a polycrystalline with small crystallites of similar sizes formed. (iii) CO2:NH3 1:1, 2:1 and 3:1 ratios form even less extensive H-bonding than 1:10, 1:3 and pure NH3 at 20 K due to the presence of CO2 and so upon heating to 80 K a polycrystalline with large crystallites or crystalline structure formed. Partly adapted from Dawes et al.20 | ||
Further physical change in the CO2:NH3 mixtures were observed in the Rayleigh scattering tails which tells us that the VUV 4:1 ratio underwent a large change in the Δc value at the desorption temperature of CO2 at 90 K. This was observed to a lesser extent in the 2:1 ratio and only slightly in the 1:3 ratio.
If we return to the differing amounts of residue material in the CO2:NH3 we now have a deeper understanding of the molecular synthesis occurring within the CO2:NH3 mixtures presented in this paper. For example, smaller amounts of residue material were observed in the CO2-rich and equal part mixtures. These mixtures mainly consisted of CO2 bonded as CO2-dimers and to a lesser extent CO2:NH3 molecular complexes and isolated CO2. Noble et al. observed no reaction in their CO2-rich mixtures and attributed it to high reaction barriers which caused the CO2 to desorb too quickly before a reaction could take place.7 While a comparison between our results and Noble et al. must be done with caution as they deposited their mixtures at a much higher deposition temperature (60 K) we do also see a large amount of CO2 desorption within our CO2-rich mixtures. We suggest here that this large desorption of CO2 was that of CO2-dimers leaving trace amounts of CO2:NH3 molecular complexes and isolated CO2 to undergo thermal reaction. CO2-dimers are less prevalent in the mid-IR 1:1 ratio compared to the 2:1 (& 3:1) ratio which may explain the slightly larger amounts of residue material observed for this ratio. Looking at the NH3-rich mixtures, the 1:10 ratio consists mainly of isolated CO2 and the 1:3 ratio consists of isolated CO2 and CO2:NH3 molecular complexes. This may suggest that the presence of CO2:NH3 molecular complexes within the 1:3 ratio enhanced the reactivity of the ice.
However, again it was probably not as simple as that. Larger amounts of residue material from the mid-IR study were observed in ratios with more NH3 crystallite grain boundaries (1:3 & 1:10) compared to mixtures with less NH3 crystallite grain boundaries (1:1 & 2:1). In non-astrophysical solids, it is well known that diffusion along crystallite grain boundaries is generally enhanced compared to the crystal or mineral equivalent.32,33 Experimental data34 and astrochemical models35,36 have suggested that structural diffusion within the bulk ice may actually enhance reactivity. This would suggest that CO2 diffusion along the crystallite grain boundaries was higher in the NH3-rich mixtures which may also have increased reactivity.
6 Conclusions
We systematically investigated the stoichiometric mixing ratio in CO2:NH3 ices as a function of thermal processing using mid-IR and VUV spectroscopy. This was the first time that CO2:NH3 ice mixtures were studied using VUV spectroscopy which revealed a better sensitivity to the residue material. We showed that the CO2 bonding environment within the CO2:NH3 mixtures were highly dependent on the stoichiometric mixing ratio and that this bonding environment pre-determined the NH3 crystallite structures within the CO2:NH3 mixtures. By understanding the different chemical and physical properties within the CO2:NH3 we were able to extend our understanding of the thermally induced reactions in CO2:NH3 mixtures. There was a complex interplay between the different physical and chemical properties of the CO2:NH3 mixtures that drove the thermally induced molecular synthesis observed in the CO2:NH3 mixtures.
Conflicts of interest
There are no conflicts to declare.Acknowledgements
The research leading to this result has been supported by the project CALIPSOplus under the Grant Agreement 730872 from the EU Framework Programme for Research and Innovation HORIZON 2020. R. L. J. acknowledges the STFC for her PhD Studentship under grant no. ST/N50421X/1. S. I. acknowledges the Royal Society for financial support. All mid-IR and VUV spectra are available on the ORDO Repository (https://doi.org/10.21954/ou.rd.12950255).Notes and references
- D. Frasco, J. Chem. Phys., 1964, 41, 2134–2140 CAS.
- I. C. Hisatsune, Can. J. Chem., 1983, 62, 945–948 Search PubMed.
- J. B. Bossa, F. Duvernay, P. Theulé, F. Borget and T. Chiavassa, Chem. Phys., 2008, 354, 211–217 CrossRef CAS.
- M. Bertin, I. Martin, F. Duvernay, P. Theule, J. B. Bossa, F. Borget, E. Illenberger, A. Lafosse, T. Chiavassa and R. Azria, Phys. Chem. Chem. Phys., 2009, 11, 1383–1845 RSC.
- X. Y. Lv, P. Boduch, J. J. Ding, A. Domaracka, T. Langlinay, M. E. Palumbo, H. Rothard and G. Strazzulla, Phys. Chem. Chem. Phys., 2012, 16, 3433–3441 RSC.
- Y. Rodríguez-Lazcano, B. Maté, V. J. Herrero, R. Escribano and Ó. Gálvez, Phys. Chem. Chem. Phys., 2014, 16, 3371–3380 RSC.
- J. A. Noble, P. Theule, F. Duvernay, G. Danger, T. Chiavassa, P. Ghesquiere, T. Mineva and D. Talbi, Phys. Chem. Chem. Phys., 2014, 16, 23604–23615 RSC.
- A. Potapov, P. Theulé, C. Jäger and T. Henning, Astrophys. J., 2019, 878, L20 CrossRef CAS.
- A. Potapov, C. Jäger and T. Henning, Astrophys. J., 2020, 894, 110 CrossRef.
- R. L. James, S. Ioppolo, S. V. Hoffman, N. C. Jones, N. J. Mason and A. Dawes, Systematic investigation of CO2:NH3 ice mixtures using mid-IR and VUV spectroscopy – Part 1: thermal processing dataset, https://doi.org/10.21954/ou.rd.12950255, 2020 Search PubMed.
- P. A. Gerakines, W. A. Schutte, J. M. Greenberg and E. F. van Dishoeck, Astron. Astrophys., 1995, 296, 810 CAS.
- G. A. Baratta and M. E. Palumbo, J. Opt. Soc. Am. A, 1998, 15, 3076–3085 CrossRef CAS.
- F. P. Reding and D. F. Hornig, J. Chem. Phys., 1951, 19, 594–601 CrossRef CAS.
- B. Jonsson and B. Nelander, Chem. Phys., 1977, 25, 263–269 CrossRef CAS.
- G. T. Fraser, K. R. Leopold and W. Klemperer, J. Chem. Phys., 1984, 81, 2577–2584 CrossRef CAS.
- R. M. Escribano, G. M. Muñoz Caro, G. A. Cruz-Diaz, Y. Rodríguez-Lazcano and B. Maté, Proc. Natl. Acad. Sci. U. S. A., 2013, 110, 12899–12904 CrossRef CAS.
- I. R. Cooke, E. C. Fayolle and K. I. Öberg, Astrophys. J., 2016, 832, 5 CrossRef.
- B. Sivaraman, B. N. Raja Sekhar, D. Fulvio, A. Hunniford, B. McCullough, M. E. Palumbo and N. Mason, J. Chem. Phys., 2013, 139, 074706 CrossRef.
- G. A. Baratta and M. E. Palumbo, Astron. Astrophys., 2017, 608, A81 CrossRef.
- A. Dawes, R. J. Mukerji, M. P. Davis, P. D. Holtom, S. M. Webb, B. Sivaraman, S. V. Hoffmann, D. A. Shaw and N. J. Mason, J. Chem. Phys., 2007, 126, 244711 CrossRef.
- W. Zheng and R. I. Kaiser, Chem. Phys. Lett., 2007, 440, 229–234 CrossRef CAS.
- A. Cassidy, R. L. James, A. Dawes and D. Field, ChemistryOpen, 2020, 9, 983–990 CrossRef.
- K. M. Monahan and W. C. Walker, J. Chem. Phys., 1974, 61, 3886–3889 CrossRef CAS.
- N. J. Mason, A. Dawes, P. D. Holtom, R. J. Mukerji, M. P. Davis, B. Sivaraman, R. I. Kaiser, S. V. Hoffmann and D. A. Shaw, Faraday Discuss., 2006, 133, 311–329 RSC.
- H.-C. Lu, H.-K. Chen, B.-M. Cheng and J. Ogilvie, Spectrochim. Acta, Part A, 2008, 71, 1485–1491 CrossRef.
- A. Dawes, N. Pascual, S. V. Hoffmann, N. C. Jones and N. J. Mason, Phys. Chem. Chem. Phys., 2017, 19, 27544–27555 RSC.
- A. Dawes, N. Pascual, N. J. Mason, S. Gärtner, S. V. Hoffmann and N. C. Jones, Phys. Chem. Chem. Phys., 2018, 20, 15273–15287 RSC.
- J. D. Jackson, Classical Electrodynamics, Wiley, New York, 2nd edn, 1975 Search PubMed.
- D. J. Lockwood, in Rayleigh and Mie Scattering, ed. M. R. Luo, Springer New York, New York, NY, 2016, pp. 1097–1107 Search PubMed.
- M. P. Collings, M. A. Anderson, R. Chen, J. W. Dever, S. Viti, D. A. Williams and M. R. S. McMcoustra, Mon. Not. R. Astron. Soc., 2004, 354, 1133–1140 CrossRef.
- J. A. Noble, E. Congiu, F. Dulieu and H. J. Fraser, Mon. Not. R. Astron. Soc., 2012, 421, 768–779 CAS.
- R. Dohmen and R. Milke, Rev. Mineral. Geochem., 2010, 72, 921–970 CrossRef CAS.
- G. Stechauner and E. Kozeschnik, J. Mater. Eng. Perform., 2014, 23, 1576–1579 CrossRef CAS.
- P. Ghesquière, A. Ivlev, J. A. Noble and P. Theulé, Astron. Astrophys., 2018, 614, A107 Search PubMed.
- C. N. Shingledecker, A. Vasyunin, E. Herbst and P. Caselli, Astrophys. J., 2019, 876, 140 CAS.
- C. N. Shingledecker, T. Lamberts, J. C. Laas, A. Vasyunin, E. Herbst, J. Kästner and P. Caselli, Astrophys. J., 2020, 888, 52 CrossRef CAS.
Footnote |
| † Electronic supplementary information (ESI) available. See DOI: 10.1039/d0ra05826b |
| This journal is © The Royal Society of Chemistry 2020 |