
 Open Access Article
 This Open Access Article is licensed under a
 Creative Commons Attribution 3.0 Unported Licence
Structural evolution of water and hydroxyl groups during thermal, mechanical and chemical treatment of high purity natural quartz
Bartłomiej A. Gaweła,
Anna Ulvensøena,
Katarzyna Łukaszukb,
Bjørnar Arstadc,
Astrid Marie F. Muggerudb and
Andreas Erbe*a
aDepartment of Materials Science and Engineering, NTNU, Norwegian University of Science and Technology, 7491 Trondheim, Norway. E-mail: quartz-heat-treatment@the-passivists.org; Tel: +47 73 594048
bThe Quartz Corp, Strandveien 50, 1366 Lysaker, Norway
cSINTEF Industri, Pb. 124 Blindern, 0314 Oslo, Norway
First published on 5th August 2020
Abstract
Fused silica crucibles are commonly used in the fabrication process of solar grade silicon ingots. These crucibles are manufactured from high purity natural quartz sand and as a consequence, their properties are influenced by the presence of water and hydroxyls in the raw quartz. In this work, diffuse reflectance IR, 1H magic angle spinning NMR, and Raman spectroscopy were used to investigate the influence of thermal treatment on water and hydroxyl groups in high purity natural quartz sand. Most of the water in dry sand is present in the form of closed inclusions within the quartz grains which were detected in Raman imaging studies, even after thermally treating the samples at 600 °C. Only after heating to 900 °C did this water completely vanish, most likely as a result of rupturing of the inclusions. However, newly formed OH groups, identified as isolated and hydrogen bound OH were observed as products of the reaction between water and quartz. Similarly, liquid water was observed in NMR spectra even after treatment at 600 °C while at temperatures >900 °C, only non-interacting silanol groups were present. The comparison of the temperature dependence of the IR and NMR spectra also yields insight into the assignment of the OH stretching mode region of the IR spectrum in this system. The intensity of water related bands decreases while the intensity of OH bands first increases and then decreases with increasing temperature. The band intensity of Al-rich defects as well as the characteristic feature at 3200 cm−1 does not follow the temperature dependence of typical water peaks. It is also shown that leaching the quartz sand in HF solution helps to remove water from inclusions, likely by forming pathways for fluid flow inside the quartz grains. Milling of the samples caused formation of an additional type of hydroxyl group, possibly due to partial amorphisation of the surfaces of the quartz grains surface during the process. The results improve the basis for a knowledge-based processes development for the processing of high purity natural quartz.
1 Introduction
High purity quartz sand is used as the raw material for manufacturing crucibles used in the Czochralski (CZ) production process of high purity crystalline silicon for photovoltaic application. This application demands that the level of contaminants in the quartz sand must be extremely low.1,2 Current requirements are typically <20 ppm of metal impurities incorporated in the quartz lattice. Other important impurities include hydroxyl groups and water, at internal and external interfaces, in defects or in inclusions.3–6 At the temperatures of the CZ process, the presence of water can lead to hydrolytic weakening by hydrolysis of Si–O bonds, Si–O–Si + H2O → 2Si–OH.7,8 The consequence of hydrolytic weakening is a lowering of the quartz glass viscosity, rendering crucibles more susceptible to deformation when held at the CZ process temperature of >1500 °C for typical process times of several hundred hours. Hydroxyl groups and molecular water are also responsible for bubble growth in the crucible during the CZ process.9 These unwanted features decrease the production yield and reduce the quality of the silicon ingots.9,10Refining of quartz ore into high purity quartz sand comprises several process steps such as mechanical crushing and milling, screening, froth flotation, chemical leaching and thermal treatment.1 Flotation and chemical leaching are used to remove most of the metal impurities, which are present as mineral impurities or exist at the quartz grain surface as a result of the milling process. Calcination is used primarily to dry the quartz sand and volatilise any residual organic impurities. Studies of dehydration behaviour in chalcedonic quartz showed that water is mainly located within intergranular spaces and is rapidly removed at 500 °C.3 Water removal is mainly associated with water diffusion through incompletely connected grain boundary regions at temperatures above 300 °C.4 Other studies emphasised that the presence of water at high temperatures triggers the formation of new hydroxyl groups and dislocations associated with hydrolytic weakening.8 However, the characterisation methodology of water and hydroxyl groups in quartz powder is not well established. Thus, the structural evolution of water and hydroxyl groups on natural quartz during different processing steps is not well understood.
Within this scope given by knowledge needs in the field of minerals processing, diffuse reflectance infrared (IR) spectroscopy in the OH stretching mode region, 1H magic angle spinning (MAS) nuclear magnetic resonance (NMR) and Raman spectroscopy were used to study the transformation of water in natural α-quartz after heat treatment at different temperatures, different mechanical treatment and different acid treatment. In Section 2, the state of the literature on the correlation between IR absorption features and structure of OH/H2O shall be reviewed; a reader only interested in the resulting assignments from this work may skip this section. Section 3 contains experimental details. Section 4.1 shows images and Raman maps of the samples. Spectral features observed in IR and NMR are assigned in detail in Section 4.2, before the effects of milling (Section 4.3), heat treatment (Section 4.4) and acid leaching (Section 4.5) are described. D2O exchange experiments (Section 4.6) enable differentiation between external and internal OH. Finally, Section 4.7 discusses the implications of the observed changes in the spectra with different processing parameters.
2 OH stretch region in vibrational spectra of hydroxyl groups and water
Since the interpretation of the IR spectra in the region of the OH stretching modes (3000–3800 cm−1) of the α-quartz samples is crucial for this paper, we shall briefly discuss the relation between structure and vibrational frequencies, based on experimental, computational and theoretical results. OH stretching modes are expected from bound OH groups or hydroxide ions. This category contains mainly Si–OH groups, but also any contribution from OH groups bound to impurities such as Al–OH. Table 1 summarises some important spectral interpretations associated with relevant species from selected literature. In addition, OH bonds from adsorbed water or water inclusions will also contribute to the OH stretching modes. These are compiled in Table 2.| Peak (cm−1) | System | Method | Description | Ref. |
|---|---|---|---|---|
| 3824–3688 | 19/26 Si–OH of am-SiO2 + H2O(ads) | DFT (harm.) | Isolated Si–OH | 11 |
| 3800–3600 | α-Al2O3(0001) + H2O(ads) | DFTMD | op Al–OH HBD to H2O(ads) | 12 |
| 3780 | am-SiO2 | DFTMD | Isolated Si–OH at low OH coverage | 13 |
| ≈3750 | α-Al2O3(0001) + H2O(ads) | DFTMD | Isolated op Al–OH | 14 |
| ≈3750 | Div. SiO2 | IR, SFG | Isolated Si–OH in air | 15 |
| 3750 | am-SiO2 | DFTMD | Isolated Si–OH at intermediate OH coverage | 13 |
| 3747–3737 | am-SiO2 | IR | Isolated Si–OH | (11) |
| 3735 | am-SiO2 | DFTMD | Isolated Si–OH at full OH coverage | 13 |
| ≈3700 | α-Al2O3(0001) + H2O | SFG | Isolated Al–OH | 16 |
| 3700–3400 | am-SiO2 | DFTMD | Interacting Si–OH at high OH coverage | 13 |
| ≈3680 | am-SiO2 + H2O | IR, SFG | Isolated Si–OH in H2O | 15 |
| 3610 | am-SiO2 | DFTMD | Interacting Si–OH at high OH coverage | 13 |
| ≈3600 | α-Al2O3(0001) + H2O(ads) | DFTMD | Isolated ip Al–OH | 14 |
| 3600–3000 | α-SiO2 + H2O(ads) | DFTMD | Overlapping ip and op Si–OH HBD/HBA with H2O(ads) | 12 |
| 3536–3520 | am-SiO2 | IR | Si–OH involved in HB | (11) |
| 3535–3329 | 7/26 Si–OH of am-SiO2 + H2O(ads) | DFT (harm.) | Si–OH involved in HB | 11 |
| 3500–3350 | α-Al2O3(0001) + H2O(ads) | DFTMD | ip Al–OH HBA from H2O(ads) | 12 |
| ≈3400 | α-Al2O3(0001) + H2O(ads) | DFTMD | op Al–OH HBD to H2O(ads) | 14 |
| 3670 | Porous silica | Internal Si–OH species, grain boundaries | 17 | |
| 3638 | Natural muscovite | TR-IR | Structural OH | 18 |
| 3610 | Natural α-SiO2 | TR-IR | Possibly Al3+ related defect | 19 |
| 3595 | Natural and B-doped α-SiO2 | TR-IR | OH in B3+ related defect | 19 |
| 3585 | Natural α-SiO2 | TR-IR | OH in Al3+ related defect or OH groups in dislocations | 8 and 19 |
| 3511 | Natural α-SiO2 | TR-IR | OH in Li+ related defect | 19 |
| 3486 | Natural α-SiO2 | TR-IR | OH in H+ related defect | 19 |
| 3470 | Natural α-SiO2 | TR-IR | OH in H+ related defect | 19 |
| 3430 | Natural and Al- doped α-SiO2 | TR-IR | OH in Al3+ related defect | 19 |
| 3378 | Natural and Al- doped α-SiO2 | TR-IR | OH in Al3+ related defect | 19 |
| 3313 | Natural and Al- doped α-SiO2 | TR-IR | OH in Al3+ related defect | 19 |
| 3311 | Natural muscovite | TR-IR | Structural OH | 18 |
| 3200 | Natural α-SiO2 | TR-IR | Si–O overtone | 19 |
| 3146 | Natural muscovite | TR-IR | Structural OH | 18 |
| 3035 | Natural muscovite | TR-IR | Structural OH | 18 |
| Peak (cm−1) | System | Method | Description | Ref. |
|---|---|---|---|---|
| 3756 | H2O (gas) | IR, Raman | Antisym. str. (H2O) | (20) |
| 3730 | H2O/D2O (liq.) | ATR-IR, FA | ν3 + νL2 (H2O) | 21 |
| 3657 | H2O (gas) | IR, Raman | Sym. str. (H2O) | (20) |
| 3640 | [Ge(100)–H] + H2O | ATR-IR | Non-H bound H2O on hydrophobic surface | 22 and 23 |
| 3629 | H2O (liq.) | ATR-IR, Gauss fit | “Free” OH | 24 |
| 3620 | H2O/D2O (liq.) | ATR-IR, FA | ν1 + νL2 (H2O) | 21 |
| 3600–3300 | α-SiO2(0001) + H2O(ads) | DFTMD | H2O(ads) HBD to ip Si–OH | 12 |
| 3600–3200 | α-Al2O3(0001) + H2O(ads) | DFTMD | H2O(ads) HBA from op Al–OH | 12 |
| 3584 | H2O (liq.) | TR-IR + thermodynamics | H2O, coord. numb. <3 | 25 |
| 3535 | H2O (liq.) | ATR-IR, Gauss fit | OH “bond ordering” 0, 1 | 24 |
| 3528 | H2O/D2O (liq.) | ATR-IR, FA | ν3 + νT2 (H2O) | 21 |
| 3475 | H2O (liq.) | Electr. struct. calc. + MD | Collective OH str. | 20 |
| 3462 | H2O (liq.) | TR-IR + thermodynamics | H2O, coord. Numb. ≈3 | 25 |
| ≈3450–3400 | α-SiO2(0001)/am-SiO2 + H2O (liq.) | SFG | “Liquid-like” H2O(ads) | 15 and 26 |
| ≈3450–3430 | α-Al2O3(0001) + H2O | SFG | “Liquid-like” H2O(ads) | 16 |
| 3390 | H2O (liq.) | ATR-IR, Gauss fit | OH “bond ordering” 2 | 24 |
| 3389 | H2O/D2O (liq.) | ATR-IR, FA | ν3 (H2O) | 21 |
| 3375 | H2O (liq.) | Electr. struct. calc. + MD | Collective OH str. | 20 |
| 3350 | [Ge(100)–OH] + H2O | ATR-IR + transition model | H2O(ads) in contact with OH and bulk water | 23 |
| 3304 | H2O (liq.) | TR-IR + thermodynamics | Tetrahedrally coordinated H2O | 25 |
| ≈3300 | α-SiO2(0001) + H2O(ads) | DFTMD | H2O(ads) HBD to ip Si–OH (“liquid-like”) | 27 |
| 3300–3000 | α-SiO2(0001) + H2O(ads) | DFTMD | H2O(ads) HBA from op Si–OH | 12 |
| 3300–3000 | α-Al2O3(0001) + H2O(ads) | DFTMD | H2O(ads) HBD to ip Al–OH | 12 |
| 3250 | H2O (liq.) | Electr. struct. calc. + MD | Collective OH str. | 20 |
| 3246 | H2O (bulk) | ATR-IR, Gauss fit | OH “bond ordering” 3 | 24 |
| 3240 | [Ge(100)–OH] + H2O | ATR-IR + transition model | H2O(ads) in contact with OH and bulk water | 23 |
| 3222 | H2O/D2O (bulk) | ATR-IR, FA | ν1 (H2O) | 21 |
| ≈3200 | α-Al2O3(0001) + H2O | SFG | “Ice-like” H2O(ads) | 16 |
| ≈3200–3100 | α-SiO2(0001)/am-SiO2 + H2O (liq.) | SFG | “Ice-like” H2O(ads) | 15 and 26 |
| ≈3160 | α-SiO2(0001) + H2O(ads) | DFTMD | H2O(ads) HBA from op Si–OH (“ice-like”) | 27 |
| 3134 | H2O (bulk) | ATR-IR, Gauss fit | OH “bond ordering” 3′ | 24 |
| 3079 | H2O/D2O (bulk) | ATR-IR, FA | ν1 − νT2 (H2O) | 21 |
| 3045 | H2O (bulk) | ATR-IR, Gauss fit | OH “bond ordering” 4 | 24 |
Vibrational modes are affected by hydrogen bonds (HBs). Harmonic DFT calculations of 26 different Si–OH groups on amorphous “fused silica” (am-SiO2) in the presence of adsorbed water showed a gap of ca. 150 cm−1 in between frequencies of populations involved in H-bonds (3535–3329 cm−1) and those not involved in H-bonds (3824–3688 cm−1).11 Varying the OH surface coverage on amorphous SiO2 models showed, however, absorption in the intermediate region around 3600 cm−1, attributed to interacting silanols.13 H-bound species show up to more than one order of magnitude higher absorption coefficients than non-H-bound Si–OH.11 The absorption coefficient of the latter population is also more homogeneous. The high absorption coefficients, in particular from Si–OH groups which are HB-donors only,11 are expected to dominate measurements. Harmonic frequencies in general may not quantitatively reproduce experimental results. They are, however, likely reproduce important trends.
Very detailed insight is available from DFT-based molecular dynamics (MD) simulations of adsorbed water on OH-terminated α-SiO2(0001) and α-Al2O3(0001),12,14,27 and also for models for amorphous surfaces.13 A remarkable result from the comparison of the two systems is that the nature of the H-bond connecting adsorbed water and surface OH is reversed between the two oxide surfaces. As a consequence, a certain vibrational signature is not a unique characteristic of a certain type of adsorbed water molecule.12 A further important result from these computational studies is that the second layer of adsorbed water already gives a spectroscopic signature very close to that of bulk water.12,22,27 We shall thus refer to water molecules directly bound to the oxide as “adsorbed water” and further layers as “molecular water”. On the other hand, experimental analysis of water in mesoporous silica indicated differences in spectra up to tens of nm pore diameter.28
The interpretation of the stronger H-bound surface hydroxyl species is complicated by the superposition of the absorption from molecular water, for which a number of different interpretations exist. For example, 6 components in the OH stretch region of water have been assigned to 6 differently H-bound species in liquid water.24 While it is well recognised that different degrees of H-bonding affect OH stretching positions, a particular complication of the interpretation of the water spectra stems from the fact that molecular water must have two fundamental normal modes in the spectral region in question. To that end, on the basis of a factor analysis of spectra from H2O/D2O mixtures, the complete OH stretch region was assigned to the water normal modes and combinational modes.21,29 Using a singular value decomposition based transition model for the analysis of the electrode potential induced changes of the water spectrum at a Ge(100) electrode near a transition from a hydrophobic to a hydrophilic surface, our group found two main components.23
Detailed line shape calculations including coupling between different water molecules point to the importance of collective components in the OH stretching modes; in particular, such models appear as a compromise between the different mutually exclusive views of the OH stretching region of the water spectrum described in the previous paragraph.20 A comparison between temperature dependent vibrational spectra and thermodynamic data lead to models with the presence of predominantly two30 or three25 differently H-bound species while multivariate curve resolution of Raman spectra points to coupling of modes well beyond the first hydration shell.31 Strong intermolecular coupling which affects the intramolecular modes by the presence of collective modes is also in line with 2D IR experiments and simulations.32–34 The coupling has been interpreted as giving rise to phonon-like modes which propagate to nm length scales.35 Even for individual OH oscillators in clusters, the feature at 3400 cm−1 is accompanied by a lower frequency, phonon-like mode.36 The widely distributed and frequency dependent vibrational relaxation times have been interpreted in the picture of a strong structural heterogeneity of H2O.37 Using the superposition of cluster spectra leads to a surprisingly good reproduction of the liquid water spectrum.38 For bulk water, mapping calculated frequencies with local bond situation may provide insight into the relation between spectroscopic properties and bonding, with limitation.39 Many details in this process are just beginning to be unravelled by novel techniques.40
We do not set out in this work to unravel the controversies about interpretation of the OH stretching modes. Not surprisingly, many different models reproduce the experimental spectra quite well. For this work, a closer look into the different interpretations is important as differently H-bound components in H2O, as used e.g. in ref. 24 and 25 can easily change with environment and at an interface. However, the normal modes as used in ref. 21 cannot change with the environment though their frequencies may be slightly modified.
The possible confinement in interfacial systems would lower the length of propagation of phonon-like modes as suggested in ref. 35, consequently affect the absorption frequency and thus explain differences observed between experiments and computations in the extent to how far water vibrational spectra are modified by the presence of an interface.27,28 Such considerations need to be kept in mind in our attempts to describe the spectrum of adsorbed and molecular water.
Near interfaces, vibrational spectra often show peaks at ≈3200 cm−1, resembling the dominating feature in the spectrum of solid ice.41 Because of this similarity, this feature is often referred to as “ice-like”,15,16,25–27 which unfortunately sometimes leads to misunderstandings of the actual H-bonding situation of interfacial water. For example, electric fields—intrinsically present across interfaces—also lead to more “ice-like” spectra.42 while pressure, and consequently stress, present in minerals shift OH stretching modes typically to lower wavenumbers.27,43 On the other hand, confinement of water in pores leads to a breakdown of part of the H-bond network, thus leading to modes at higher frequencies.44,45
The peaks of liquid water and adsorbed water strongly involved in H-bonding have also been found to be very broad, both experimentally,15,16,21,24–26,46 and computationally.11,12,14,27 Different reasons may exist for the observed broadness, such as thermal fluctuations, conformational flexibility or broadening upon H-binding.11,12,27
In addition to H2O molecules, different forms of the hydrated proton and the hydrated hydroxide ion also contribute to the broad OH stretch peaks of strongly H-bound species with conformational flexibility and the presence of different isomers as shown e.g. by spectroscopy from isolated clusters.47–49 The unusually low vibrational life times for the hydrated proton may also contribute to the broadness of some features.50
3 Experimental
3.1 Materials
The quartz samples used in this work originated from the Spruce Pine deposit, North Carolina, USA. The highest purity quartz sand used in these experiments was obtained by submitting the mined ore to a series of controlled processing steps including mechanical, chemical and thermal treatments. The samples used in this study, had, originally, 230 μm median diameter, with <10% of particles larger than 400 μm and <10% smaller than 120 μm. In this article, we study the effect of different particle size, acid leaching strength and temperature on the content of water and OH groups in the quartz samples. An overview of important sample parameters is listed in Table 3.| Sample name | d10a | d50b | d90c | Leaching | Heat treatment |
|---|---|---|---|---|---|
| a d10 – 10% of particles in the cumulative distribution below this diameter.b d50 – median; 50% of the particles below this diameter.c d90 – 10% of particles above this diameter. | |||||
| 1 | 120 | 230 | 400 | High | — |
| 1_100 | 120 | 230 | 400 | High | 100 °C |
| 1_600 | 120 | 230 | 400 | High | 600 °C |
| 1_900 | 120 | 230 | 400 | High | 900 °C |
| 1_1100 | 120 | 230 | 400 | High | 1100 °C |
| 2 | 120 | 230 | 400 | Low | — |
| Micro 1 | 2 | 12 | 30 | High | — |
| Micro 2 | — | 12 | — | Low | — |
The purpose of milling as a mechanical treatment is to reduce the size of the ore to the point where quartz can be recovered from other minerals such as mica, feldspar and garnet which are also present. The samples Micro 1 and Micro 2 were additionally modified using a fine autogenous milling technique to reduce the particle size of the material. Acid leaching as a chemical treatment was performed by using hydrofluoric acid at elevated temperature to efficiently etch away surface impurities. Samples 1 and 2 were obtained under different acid leaching conditions in which the HF/quartz ratio of sample 2 was reduced to 34% of the HF/quartz ratio used for sample 1. The final step of high purity quartz processing is thermal treatment, drying, that removes moisture and improves melting behaviour by alteration of any fluid inclusions, leading to a significant reduction in the bubble count in the silica glass.
The trace element content determined by inductively coupled plasma mass spectrometry (ICP-MS) after dissolution in HF is listed in Table 4. The total trace element content (except hydrogen) was below 20 wt ppm.
| Sample | Al | B | Ca | Co | Cr | Cu | Fe | K | Li | Mg | Mn | Na | Ni | Ti |
|---|---|---|---|---|---|---|---|---|---|---|---|---|---|---|
| 1 | 13 | 0.1 | 0.5 | 0.01 | 0.01 | 0.01 | 0.2 | 0.5 | 0.4 | 0.1 | 0.1 | 0.8 | 0.01 | 1.2 |
| 2 | 15 | — | 1.4 | — | — | — | 0.5 | 1.1 | 0.5 | — | — | 1.2 | — | 1.3 |
3.2 Methods
Raw data associated with this study is available online.51The obtained spectra were converted to absorbance by taking their negative decadic logarithm, and will be displayed in this paper in the region above 3000 cm−1. The used processing is a common strategy for data treatment of diffuse reflectance spectra of minerals. It shows good linear response with concentration and, in contrast to the Kubelka–Munk transformation, tends to be less affected by baseline corrections.52–55 Linearity with concentration was found in a dilution series in KBr of the samples investigated here.56 The spectral region below 3000 cm−1 could not be investigated in detail by IR, because of the large absorption of Si–O modes and their overtones.
D2O exchange experiments were conducted with similar conditions as standard diffuse reflectance IR measurements. A drop of D2O (Sigma-Aldrich, 99% of D) was placed on sample 1_100 and spectra were recorded during drying by argon purging of the cell. For this experiment, an in-house built feed through system was used to enable purging of the Praying Mantis cell inside the evacuated sample compartment of the spectrometer.
Absorbance spectra were fitted using the software package Fityk.57 First, a spectrum of sample 1_1100 was fitted using Gaussian peaks. Subsequently, other spectra were fitted using the same parameters as a starting point. The positions of the “sharp” peaks have been read from the graph and allowed to vary slightly in the fitting procedure. Peak positions which are present as shoulders were initially estimated based on literature values. Fitting attempts showed that further broad background peaks needed to be considered, as will be described in Section 4.2. In the final stage of the fitting, peak positions have been fixed and peak width and absorbance were allowed to vary, except for the peaks of liquid water. For those peaks, the peak widths were also fixed.
Before Fourier transform of the averaged FIDs, zero filling and apodization were applied to improve line shape definitions and signal-to-noise ratio. The apodization was done by multiplying the FIDs with a decaying exponential window function with a processing line broadening (LB) factor of 20 Hz. All NMR spectra were then adjusted by proper signal phasing and baseline corrections.
Due to very weak proton signals, we ran identical experiments as described above but with an empty MAS rotor. This spectrum was then subtracted from the sample spectrum to obtain the final spectrum. The peak from air moisture shows up as a negative peak in the spectra at a chemical shift of ≈0.35 ppm.
4 Results and discussion
4.1 Raman maps of the OH stretching mode region
Fig. 1 shows light microscopy images of 1 and 2, and corresponding Raman maps. The Raman maps show the distribution of features associated with liquid water. In the micrographs, there is no clear indication of inclusions. The grain surfaces look smooth, especially in sample 1. However, Raman mapping of the framed area in Fig. 1 indicates clearly the presence of microinclusions with a diameter on the order of 1 μm (Fig. 1B). In sample 2 (Fig. 1C) the detected inclusions have a different shape. Moreover, water was present also in cracks or intercrystallite domains within quartz grains (Fig. 1D).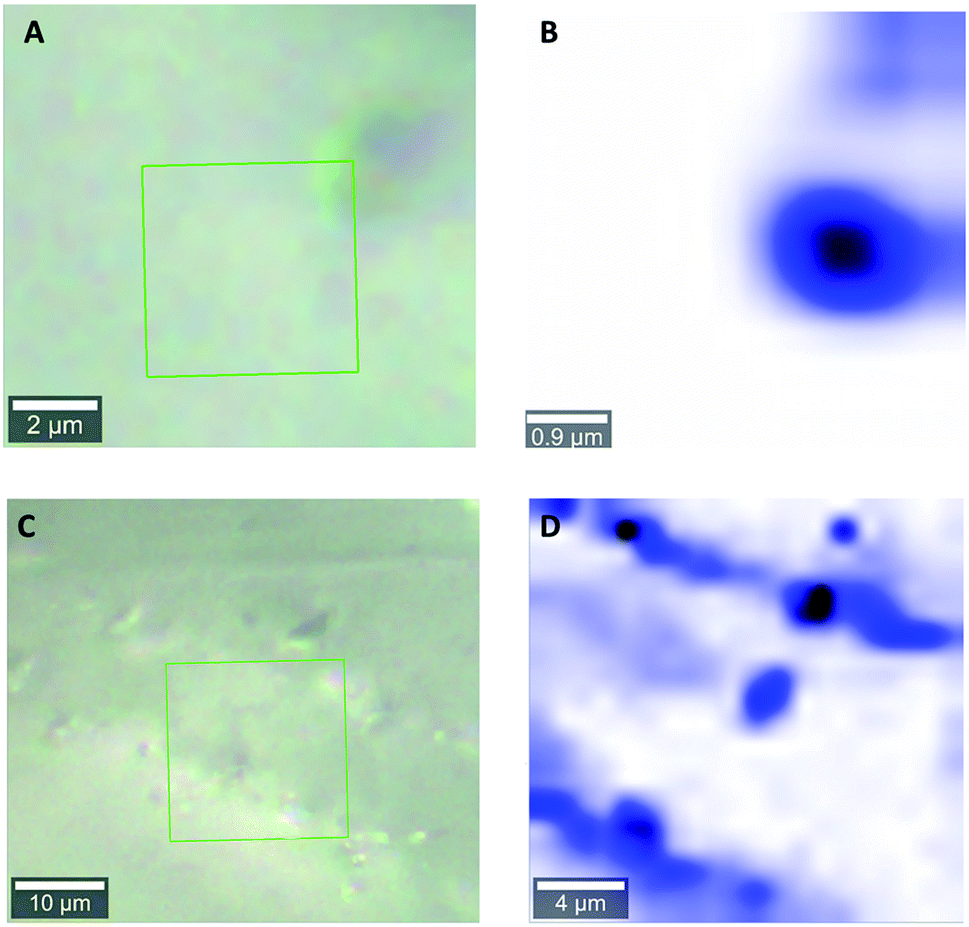 | ||
| Fig. 1 Micrograph of quartz grain of Sample 1 (A) and 2 (C) with corresponding Raman scanning maps (B and D) of the area indicated by a green square in (A) and (C). Raman maps represent false colour images obtained as output of the Raman software's true component analysis. Blue colour represents spectral features of liquid water. | ||
4.2 Band assignment in IR and NMR
An analysis of the NMR spectrum of a representative sample (Fig. 2) is a good starting point. Three major peaks are observed in the spectra. The peaks at 0.8 and 1.25 ppm likely originate from internal, non-H bound and H-bound hydroxyl groups, respectively.58 The sharp peak at 4.7 ppm corresponds to bulk water in inclusions. The negative peak at −0.4 ppm represents water vapour in the empty sample cell. In the spectrum there is no indication of Al–OH related peaks, which are expected to be in the range 2.5–3 ppm.58 Overall, as confirmed by modelling,11,59 weakly H-bound species show peaks towards lower frequencies, i.e. to the right in the spectrum, relative to their H-bound forms. From this NMR spectrum, we can expect at least two different OH species in the IR spectrum.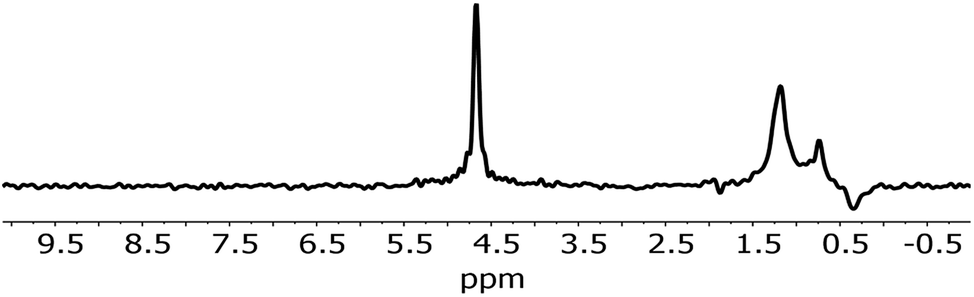 | ||
| Fig. 2 NMR spectrum of 1. | ||
Fig. 3 shows the IR spectrum of a representative sample, together with a peak fit. Disregarding a few exceptions highlighted below, similar components with different absorbance relative to each other were found in all samples. The spectrum shows significantly more than the 2 components. A detailed comparison of samples is presented later. All IR peak assignments in the range between 3800 and 3000 cm−1 are summarised in Table 5, in line with Section 2. The reasoning for the assignment shall be given below, and some of it may become apparent only after looking at the trends observed with sample treatment.
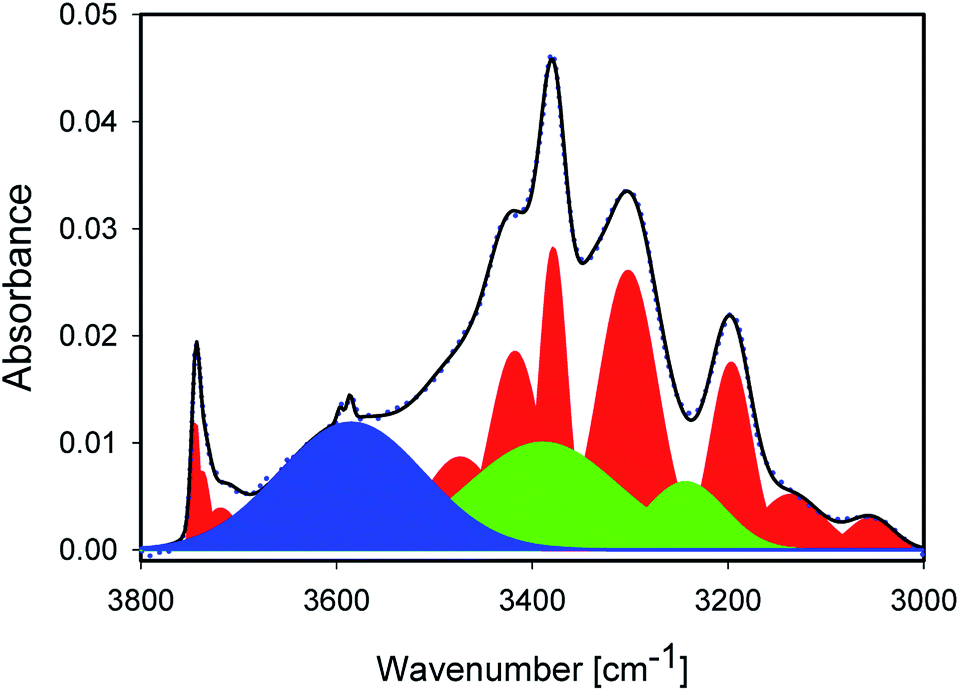 | ||
| Fig. 3 IR spectrum of 1_600 (blue dots) with peak fitting by a superposition of Gaussian peaks (black line). Peaks in red have been assigned to Si–OH or other mineral vibrations. Green peaks represent OH stretching modes of liquid water. The blue peak was assigned to an OH stretching mode of interfacial water. | ||
| Peak | NMR | Description | Ref. IR |
|---|---|---|---|
| a The “?” indicates a tentative assignment. | |||
| 3750 | 1.25 | Isolated Si–OH | 11, 13 and 15 |
| 3720 | 1.25 | “Bridged” Si–OH | 11 and 15 |
| 3680 | n.d. | HB Si–OH species at grain boundaries | 17 |
| 3650 | n.d. | HB Si–OH species at grain boundaries, structural OH | 17 and 18 |
| 3380–3610 | n.d. | Adsorbed water, H2O(ads) HBD to ip Si–OH or undercoord. H2O | 12, 13 and 25 |
| 3595 | n.d. | OH in B3+ related defect | 19 |
| 3585 | n.d. | OH in Al3+ related defect or OH groups in dislocations | 8 and 19 |
| 3470 | n.d. | Si–OH involved in HB | 19 |
| 3420 | n.d. | OH in Al3+ related defect | 19 |
| 3378 | n.d. | OH in Al3+ related defect | 19 |
| 3375 | 4.7 | Liq. H2O inclusion | 20, 21 and 24 |
| 3313 | n.d. | OH in Al3+ related defect | 19 |
| 3246 | 4.7/5.2?a | Liq. H2O inclusion | 20, 21 and 24 |
| 3200 | n.d. | Natural Si–O overtone? | 18 and 19 |
| 3146 | n.d. | Structural OH in clay-like defects | 18 |
| 3035 | n.d. | Structural OH in clay-like defects | 18 |
There is general consensus that the high wavenumber side of the OH stretching mode region shows absorption of OH groups not involved in any H-bonding (Table 2). NMR shows no evidence for the presence of non-H bound Al–OH groups while a clear signal for Si–OH groups is present. We reason thus that the peaks at 3750 and 3720 cm−1 originate predominantly from isolated (“free”) and bridged Si–OH groups, respectively.15,17
In IR spectra of sample 1_100 (Section 4.4), peaks at 3680 cm−1 and 3650 cm−1 are also observed, which likely represents internal –OH at grain boundaries.60 Alternatively, they may be associated with the presence of aluminosilicate impurities (e.g. muscovite).17,61–63 This is a region of the spectrum where typically OH donor groups interacting with other OH via H-bonds are observed, while acceptors of H-bonds show broad a peak at 3480 cm−1.11 The weak sharp peak at 3595 cm−1 is identified as the B–OH stretching mode,19 while the sharp weak band at 3585 cm−1 is associated with the hydrogarnet substitution or presence OH groups in dislocations.64,65 Both features are commonly present in quartz minerals.19 The broad peak at 3480 cm−1 indicates OH involved in H-bonding. The peaks at wavenumbers 3420, 3375 and 3313 cm−1 are believed to be –OH stretching modes related to the presence of Al-rich defects,5,8 although similar peaks are observed for some natural aluminosilicates (e.g. muscovite, cf. Table 1). These bands are also commonly observed in alumosilicate based synthetic heterogeneous structures.66
All of these peaks are sharp which is typical for highly ordered structures. The presence of clay like inclusions in natural quartz is quite common.61–63 If the size of their grains is in the nm range, they are difficult to detect using other methods than spectroscopy, especially if their concentration is very low.
The sharp peaks discussed so far are not sufficient to describe the experimental spectra. NMR spectra and Raman maps (Section 4.1) show evidence for the presence of liquid water. Thus, the main peaks at ≈3375 and ≈3250 cm−1 needed to be included,20,21,24,25 while the minor peaks in the typical water intensity ratios did not affect the fit quality very much. Maxima were manually slightly varied in the early stages of the fitting for these two peaks; the water peaks are marked in green in Fig. 3. It should be stressed that other possibilities would exists to describe the absorbance under the sharp, mineral-related peaks. However, for a consistent interpretation, the inclusion of liquid water is needed, and doing so with peaks fixed to approximately literature maxima appears to us as the most reasonable approach.
With the inclusion of the two main peaks of liquid water, there is still a significant broad background on the high wavenumber side, described with a very broad peak centred at ≈3610 cm−1, marked in blue in Fig. 3. The maximum of this peak also varies by about 10 cm−1 from sample to sample. From the position, the highest wavenumber mode of the water is located in this region, but the absorbance observed here is significantly higher than in liquid water, so that only the interpretation of weakly H-bound, undercoordinated water would apply. Furthermore, modes of adsorbed, interacting water molecules and confined water are found in this region.12,13,45 Because of the decrease observed with increasing treatment temperature (Section 4.4), we consider this mode to be related to adsorbed or confined water. The presence of confinement follows from the features observed in the Raman images (Section 4.1), where water in channel-like structures at grain boundaries was observed.
Finally, the peaks at 3200, 3146 and 3035 cm−1 are difficult to assign unambiguously. They may be related to strongly H-bound water. Indeed, the first band is typically attributed to “ice-like”, strongly H-bound water in SFG experiments. Si–O overtones may also play a role in this region. Moreover, in alumosilicates, the structural OH peaks appear this part of the spectrum as well. The absence of a change in temperature of the integrated absorbance for this mode (Section 4.4) makes it likely that this peak is related to overtones or structural OH. On the other hand, the peak is affected by milling (Section 4.3), which would not be immediately obvious, although not impossible, for an Si–O overtone.
The comparison to experimental 1H-NMR spectra available here enables a comment on the terminology of “ice-like” water. When looking at the spectra obtained here and comparing them to calculations for liquid water and ice,59 we do not find any evidence for the presence of “ice-like” water ‘identified’ by NMR. Because of the H-bond dynamics in ice, if this was present, a significant peak broadening would be expected in the experiments here, at a chemical shift slightly higher than that of liquid water. While the presence of small amounts of “ice-like” water in NMR below the detection limit cannot be excluded, we prefer to abstain from using the term for the IR peak observed here.
When comparing IR to NMR in this work, it is also important to have in mind that the OH stretching mode absorption coefficients for different species can be significantly different.11,19,67 Interestingly, evidence exists showing that the absorption coefficient is an extremely sensitive probe for the local structure around an OH bond, while the frequency is also strongly influenced by longer range interactions in the water network.34 Here, we shall not attempt to quantify absolutely the different species observed.
The spectral region below 3000 cm−1 cannot be investigated in detail by IR, because of the large absorption of Si–O modes and their overtones.
4.3 Effect of milling on silanol groups
Milling of the samples significantly altered the IR and NMR spectra of the samples (Fig. 4). The samples with 230 μm median particle diameter (d50 in Table 3) show much more pronounced Al-related IR peaks at 3420, 3378 and 3313 cm−1 compared to fine-milled samples (Micro 1 and Micro 2, Table 3). Moreover, fine-milled samples show significantly increased peaks, in IR at 3750 cm−1 and in NMR at ≈1.25 ppm. These peaks correspond to terminal hydroxyl groups. They are significantly more prominent in milled samples because of the significantly larger specific surface area for the (non-porous) milled sample with lower particle diameter.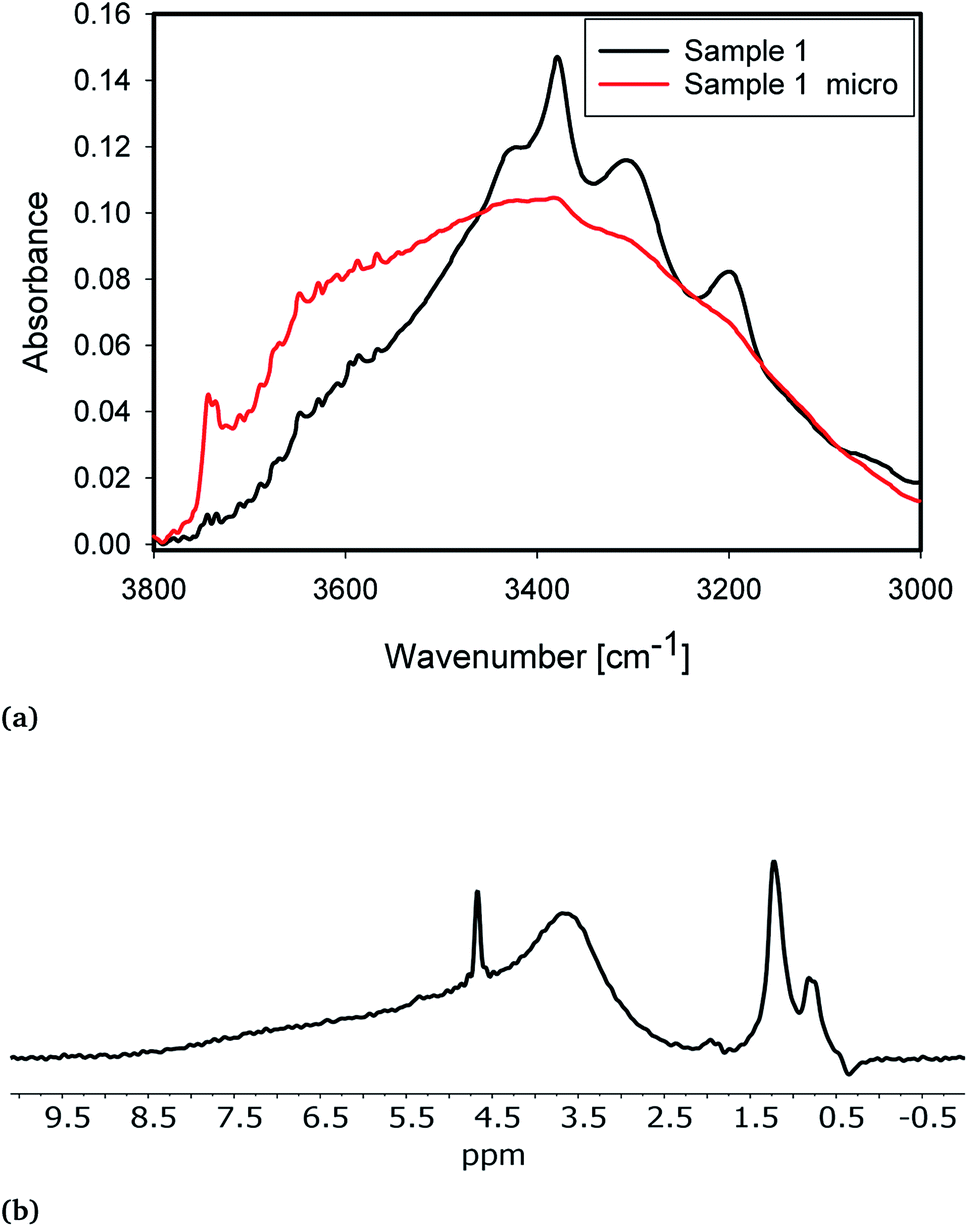 | ||
| Fig. 4 (a) IR spectra of sample 1 (black) and Micro 1 (red). (b) NMR spectra of Micro 1. For comparison, the NMR spectrum of 1 is shown in Fig. 2. | ||
IR shows the presence of a new peak at 3660 cm−1. The NMR spectrum of fine-milled samples shows a new broad peak at ≈3.7 ppm. The additional peaks in both IR and NMR are likely to originate from the same species. Peak positions point to the formation of new H-bound hydroxyl groups of a nearly fully covered surface. From comparison with the peak positions presented from simulations,13,68 these groups are likely associated with the formation of new fully hydroxylated surfaces during milling. The IR absorbance of the water bands in both classes of samples is similar. Increased absorbance on the high wavenumber side can be attributed to a change in the internal structure of grains.8 In the NMR, the sharp peak at 4.7 ppm from liquid water is slightly weaker, which indicates a mechanical rupture of inclusions and removal of water during milling to a certain extent. This water then transforms into silanol groups covering the surface, as evidenced by the increased absorbance from free and bridged silanols after milling.
4.4 Effect of heat treatment
Fig. 5 shows IR spectra of samples thermally treated at different temperatures, but measured at room temperature. Peak positions and integrated absorbance obtained from peak fitting are presented in Fig. 6. Corresponding NMR spectra are presented in Fig. 7. IR absorbance between 3400 and 3600 cm−1 decreased significantly with an increase of calcination temperature. After treatment at 900 °C, the broad features in the region between 3550 and 3700 cm−1 have completely disappeared. The spectra at the highest two temperatures can be described without inclusion of the components from molecular water, though the fit for the spectra from 900 °C are benefit from an inclusion of little residual water. In NMR, the water feature at 4.7 ppm has almost vanished at the same preparation temperature. The peak at 1.25 ppm, assigned to bridged hydroxyls, became significantly less intense at 600 °C but did not reduce at even more elevated temperatures. The decrease in both techniques thus shows a diminishing content of water and bridged hydroxyls (Tables 1, 2 and 5) with increasing temperature of thermal treatment.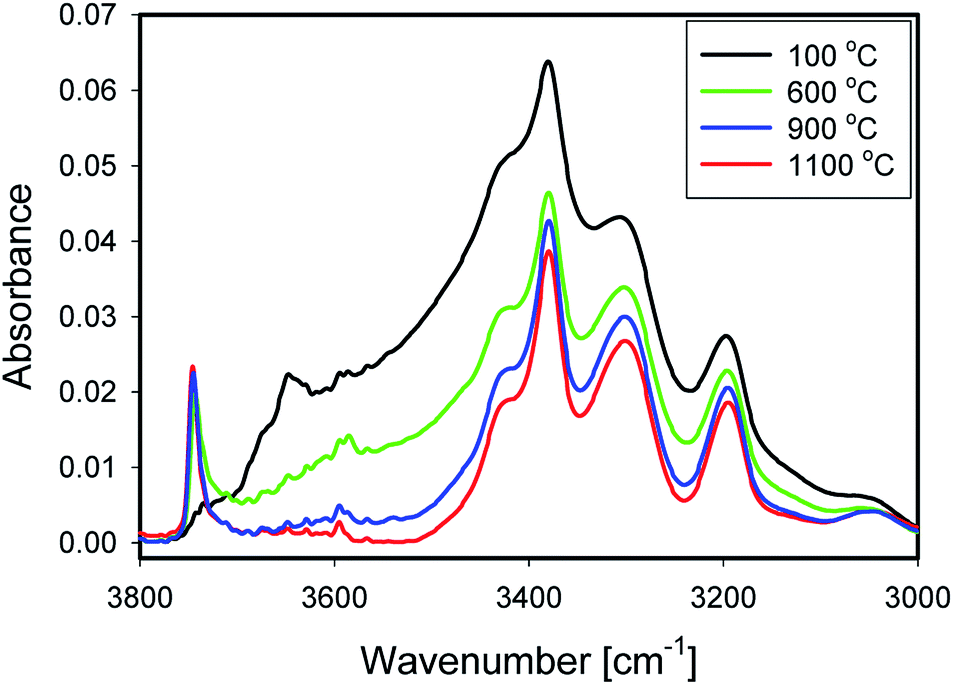 | ||
| Fig. 5 Spectra of 1_100 (black), 1_600 (green), 1_900 (blue) and 1_1100 (red). | ||
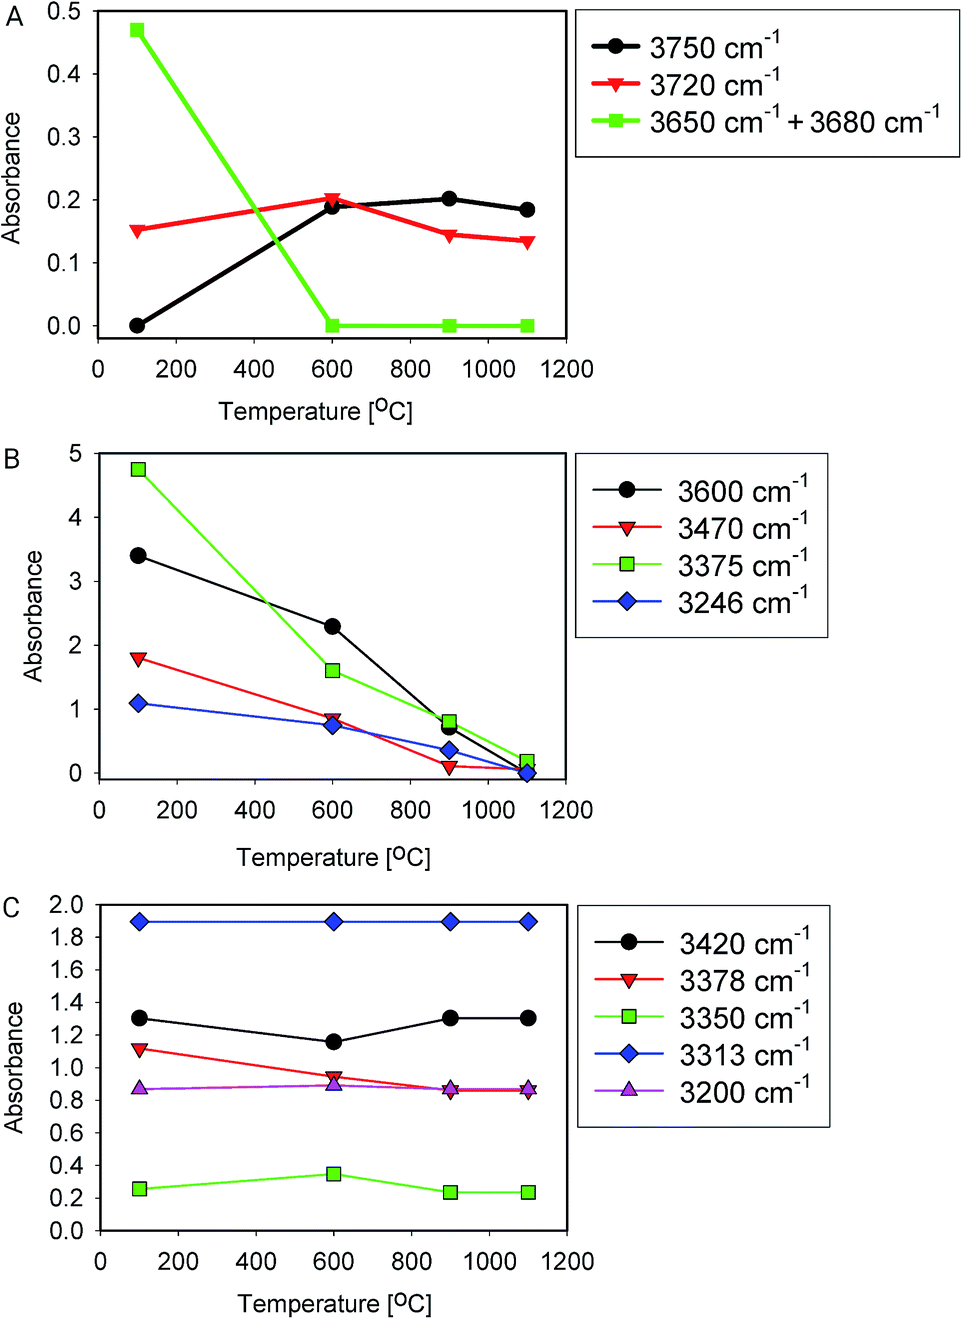 | ||
| Fig. 6 Peak fitting results (area) of heat-treated samples. (A) Si–OH groups, (B) water and bound hydroxyls, (C) Al related –OH groups. | ||
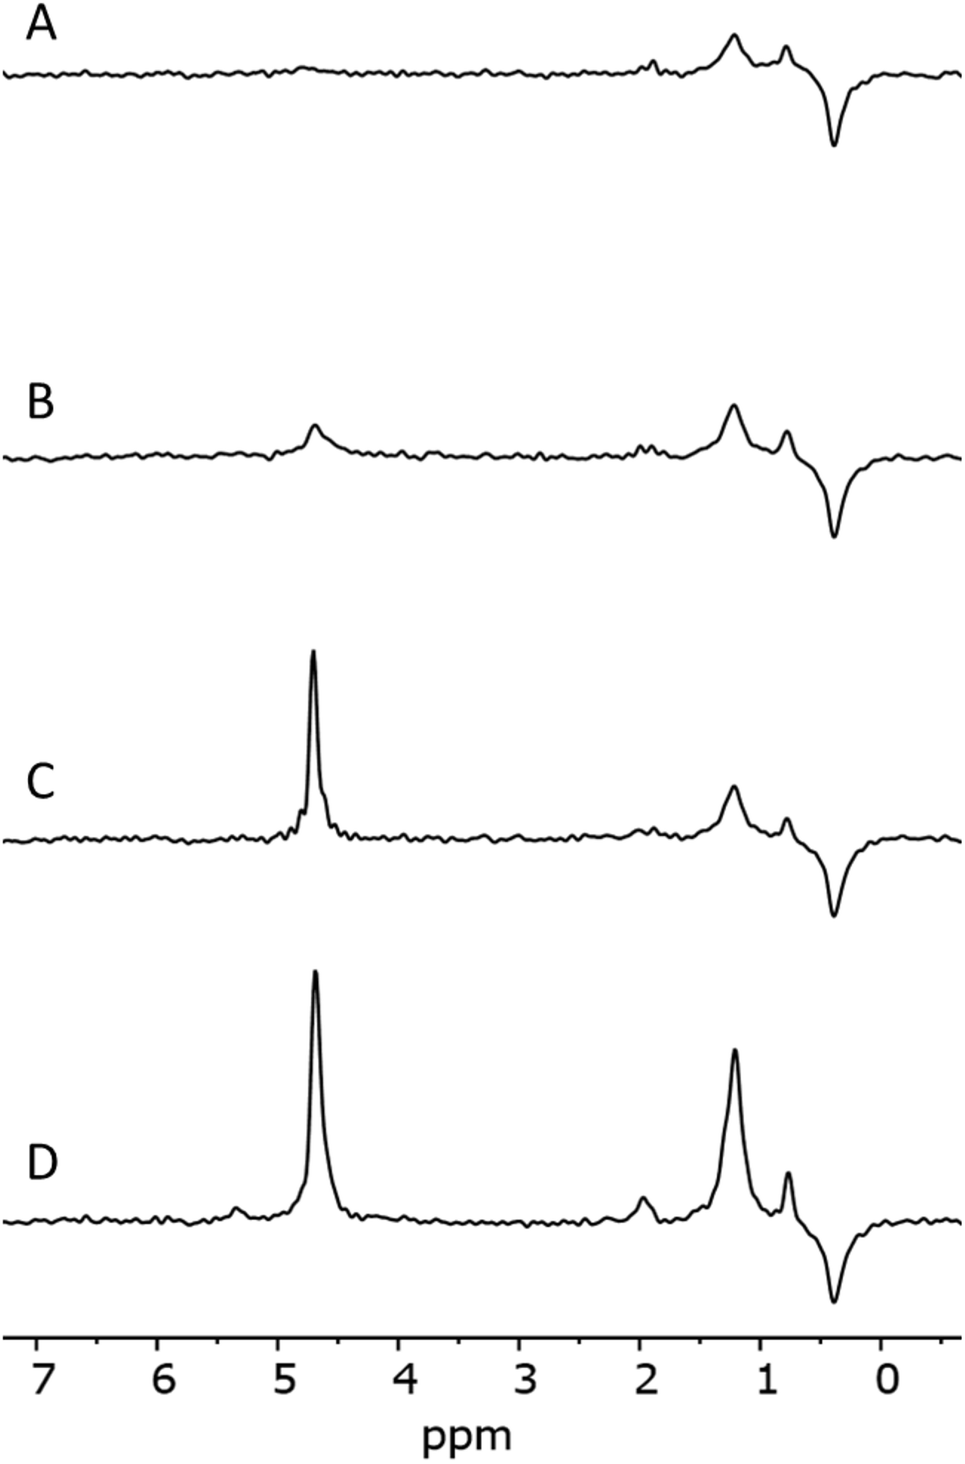 | ||
| Fig. 7 NMR spectra of samples 1_1100 (A), 1_900 (B), 1_600 (C) and 1_100 (D). | ||
In IR, after heat treatment at 600 °C, new peaks at 3750 and 3720 cm−1 appeared. These peaks are assigned to formation of non-interacting and H-bound hydroxyls groups. Absorbance of the latter peak decreases after treatment at 900 °C, likely related to condensation reactions.60 Al-related peaks are largely preserved during heat treatment.
Moreover, the sharp peak at 3650 cm−1 was observed only in one sample, that corresponding to drying at 100 °C. It is likely that this peak is related to the presence of cracks with H-bound Si–OH species;17 the same species could explain the NMR peak observed at 2 ppm.
We infer that during heat treatment between 100 and 600 °C, water in most accessible voids and cracks was removed under formation of isolated surface hydroxyl groups. NMR indicates that other hydroxyls are removed at lower temperature compared to water. This observation could be related to the fact that most of the bridged hydroxyls are likely to be at the external surfaces which are relatively easy to evolve, leaving only molecular and adsorbed water in less accessible places remaining. The remaining water is likely present in small inclusions and at grain boundaries deep inside the grains. From the results, this water can be identified by the presence of peaks around 3375 and 3600 cm−1.21,24,25 Absorbance of both peaks reduces substantially at 600 °C and stabilise after treatment at 900 °C, with an absorbance of ≈25% of that obtained at 100 °C. This residual might be attributed to the presence of alkali defects (Na+ and Li+). These cations are present in the sample (Table 4), and might affect hydroxyl bond energy and thus lead to separate bands.69 The agreement in temperature trends led to the conclusion that the peak at 3600 cm−1 originates from adsorbed water acting as H-bond donor to Si–OH, and the peak at ≈3470 cm−1 from the Si–OH accepting this H-bond (Table 5).
A discrepancy observed between IR and NMR was the absence of Al–OH peaks in NMR spectra.
Water removal may to some extent be related to the quartz α–β transition at 573 °C because of the reorganisation of the crystal structure and possible formation of new pathways for water removal. However, it is noted that most of the water was removed only after heating the samples to the considerably higher temperature of 900 °C. At 900 °C and above, isolated surface OH groups remain. Isolated OH groups cannot be removed by condensation.
From the viewpoint of assignment of spectral features in IR, it is worth noting that integrated absorbance of some features remain approximately constant with temperature, i.e. their change is unsystematic or less than 20% over the whole series (Fig. 6C), while typical water features decrease with temperature (Fig. 6B). Moreover, it is clear from this graph that band at 3470 cm−1 is also related to presence of water. It likely represents Si–OH species H-bound to water.11 The feature at 3200 cm−1, debated in some of the literature,15,16,27 does not change with temperature, which is why we do not assign it to surface-bound water here.
4.5 Effect of leaching
IR spectra of samples 1 and 2 which were leached with different recipes, but received the same thermal treatment, are presented in Fig. 8. In the spectral region dominated by liquid water, ≈3400 cm−1, sample 2 shows higher absorbance, while its absorbance is slightly lower at 3660 cm−1. Sample 1 exhibited a sharp peak at ≈3650 cm−1 which is often related to the presence of hydroxyls at grain boundaries,17 or clay-like impurities.18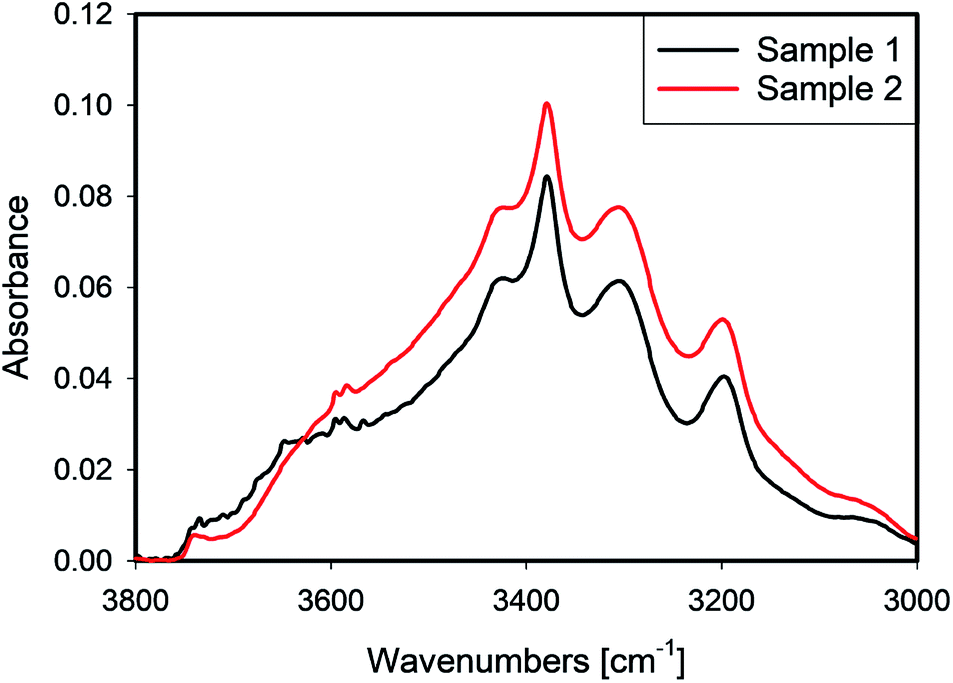 | ||
| Fig. 8 Spectra of 1 and 2 leached under with different acid concentrations conditions respectively. | ||
A comparison of the Raman maps for 1 and 2 (Section 4.1) suggests that more aggressive leaching conditions help to create paths for water transport, which enables more water to be removed at the same heat treatment. Because sample 1 was leached with a higher acid/quartz ratio, one can conclude that the leaching HF not only affects the external surface, but also penetrates deeper into the bulk of the quartz grains. In this process, cracks form and grain boundaries are affected. Moreover, deeper leaching causes more efficient transport of water from any inclusion.
4.6 D2O exchange
Accessibility of the surface OH groups has been tested by exposing one sample to D2O. A spectrum of the original sample and one after evaporation of D2O after 3 h of purging with dry argon are shown in Fig. 9. The difference between both spectra was very small. Consequently, the OH groups probed in this experiment are not accessible to D2O vapour during the experiment. This result is a strong indication that most of the water is placed inside quartz grains in inclusions and within grain boundaries rather than on the surface of the grain where it would have been accessible to the D2O vapour. Nevertheless, a minor decrease of peak intensity at 3650 cm−1 after D2O treatment was observed, which can be attributed to H-D exchange. Alternatively, this decrease could be due to water removal. Because of strong absorption from Si–O overtones, the OD stretching mode region is not accessible in these samples.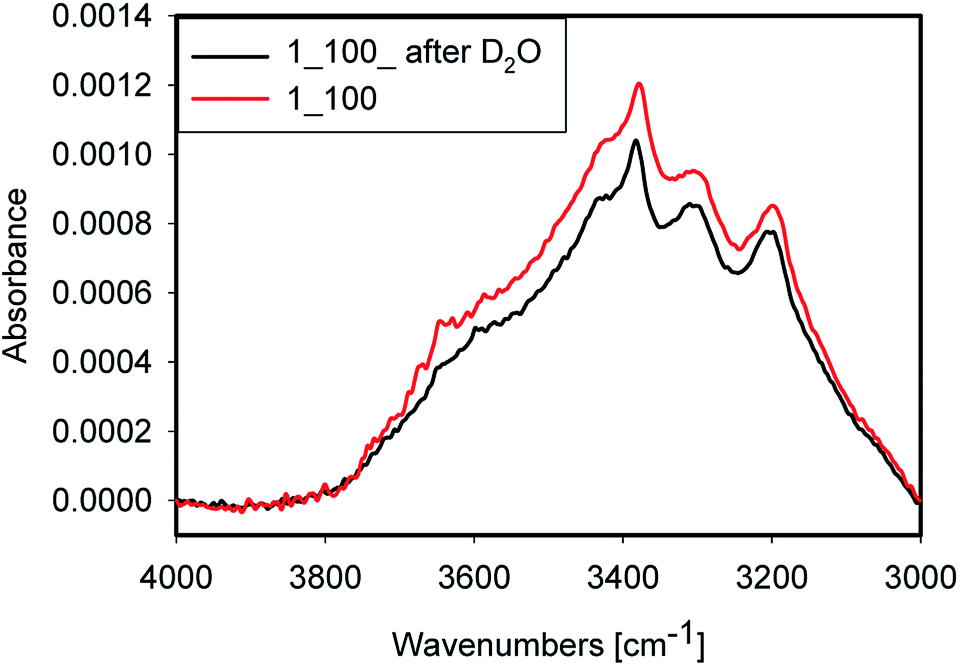 | ||
| Fig. 9 Sample 1_100 before (red) and after soaked with D2O (black) at room temperature. | ||
4.7 Structural evolution of the water and silanols during processing
Based on the presented results (Section 4.4), the heat treatment of quartz sand can be divided into 3 stages, as shown in Fig. 10. In the first stage, during drying at around 100 °C only external water is removed (Fig. 10B). In the next step, when the temperature is >100 °C but <600 °C, liquid water from grain boundaries from large inclusions is removed. Only in the third step, above 600 °C when α-quartz is no longer the stable phase, most of the water from the remaining inclusions is removed. Even at 900 °C traces of molecular water are still observed. New hydroxyls which are formed in stage 2 likely form due to reaction between water and SiO2; and are discovered to be stable up to 1100 °C. For isolated OH groups to be removed, (i) a high surface mobility is required, so that two groups diffuse until they are close enough to each other to react, or (ii) a homolytic bond breaking of the Si–O bond needs to happen. We hypothesise here, however, that isolated OH groups do not contribute to hydrolytic weakening.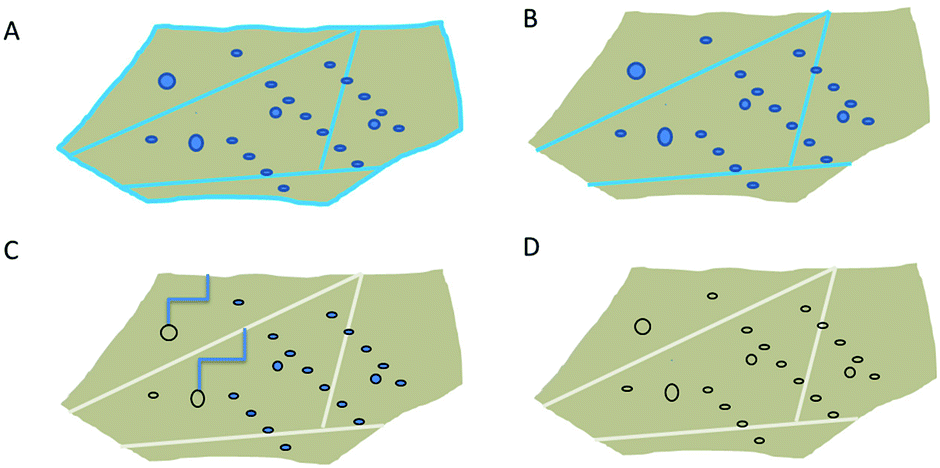 | ||
| Fig. 10 Scheme of drying process of high purity quartz. (A) Sample before drying process, (B) low temperature drying (100 °C), removal of external water, (C) medium temperature treatment (100–600 °C): removal of water from large inclusions and grain boundaries, formation of “free” hydroxyls and (D) high temperature treatment: removal of water from all inclusions, condensation between neighbouring bound hydroxyl groups. | ||
As far as milling as the most important micronisation process is concerned (Section 4.3), large forces during milling likely cause formation of fully hydroxylated surfaces, microcracks and dislocations. The weakest points in grains are often places where grain boundaries or inclusions are present. Therefore, broadening and vanishing of characteristic Al-related bands are expected because of destruction of these kind of local structures. Moreover, the substantial decrease in Al-related features in the spectrum after milling suggests the presence of solid, Al-rich inclusions with submicrometer size (rather than atomic size), randomly distributed defects. These inclusions break during milling and their spectral signature thus becomes less prominent.
The results obtained after leaching in HF (Section 4.5) show that enhanced transport of water along grain boundaries occurs. Also HF leaching decreases the amount of water in the samples, likely by opening alternative transport pathways for the water to exit the grain, and also by generating an osmotic pressure for water outward transport.
In a recent vibrational spectroscopic imaging study, a μm thick interfacial layer between SiO2 and H2O in a cavity was observed, showing the development of a “diffuse” interface even at room temperature.70 It is possible that the transport paths discussed here along grain boundaries and including smaller inclusions occurs according to a mechanism involving similar “swollen” interfacial layers. With the results in this work, it is not possible to confirm or disprove that, however, the shape of the interfaces in Fig. 1D indicates that this is a serious possibility. In a study of water desorption from MCM-41, cavitation phenomena during water removal in pores were found to occur.71 The restructuring of the interface observed here suggests that such phenomena may also play a role during heat treatment. The fact that water in porous materials shows deviations from bulk water spectra up to tens of nm of pore sizes,28 complicates the IR interpretation.
In summary, the main source of water in high purity quartz is not adsorbed outer surface water, but water in inclusions within the grain. A method to fracture such inclusion by microwaves has recently been developed.72 For quartz sand from the deposit used here, however, such a treatment is typically not considered to be necessary.
5 Conclusions
Raman mapping showed liquid water inclusions of several μm in size in dry high purity quartz sand, but also “lines” of water, presumably along intercrystallite boundaries. Both were not visible in ordinary micrographs. Results of IR and NMR measurements indicate that most of the water is in the form of closed inclusions. D2O exchange experiments show that most of the OH groups are inaccessible from the outside atmosphere. After heating to or above 900 °C, water vanishes from the quartz, probably because of a reaction of the quartz enabling the out transport of the fluid. At these temperatures, only non-hydrogen bound silanol and aluminol groups survive. Aluminium-defect bound OH groups are present in the bulk of the grains, while bridged and free hydroxyl groups are present at their surface. In situ experiments may bring deeper insight into the processes at different temperatures.Milling of samples induces the formation of new forms of hydroxyl groups, most likely at the external grain surface. However the procedure does not cause a significant reduction of water inclusions. Strong leaching improves water removal from inclusions, possibly due to formation of pathways for water diffusion. There are thus different techniques available to remove water from natural quartz. However, the removal of residual, isolated surface OH groups appears to be a significant challenge.
With the presented method combination and the unique sample set, this work is able to provide a scientific base for understanding water inclusions, their modification and their role during different treatments of high purity natural quartz. This work thus presents an essential and significant step forward for knowledge-based processes development from the raw material to the mineral.
Conflicts of interest
There are no conflicts to declare.Acknowledgements
This work was performed as part of the EngQS project (No. 282341) supported by the Research Council of Norway. We thank Benny Hallam, The Quartz Corp, for many helpful comments on the manuscript.Notes and references
- J. Götze and R. Möckel, Quartz: Deposits, mineralogy and analytics, Springer, Heidelberg, Germany, 2012, pp. 1–360 Search PubMed.
- P. Moore, Indian Miner., 2005, 8, 54–57 Search PubMed.
- J.-i. Fukuda, Water in Rocks and Minerals - Species, Distributions, and Temperature Dependences, in Infrared Spectroscopy - Materials Science, Engineering and Technology, ed. T. Theophanides, IntechOpen, Rijeka, Croatia, 2012, ch. 4 Search PubMed.
- J. Fukuda, T. Yokoyama and Y. Kirino, Mineral. Mag., 2009, 73, 825–835 CrossRef CAS.
- R. D. Aines, S. H. Kirby and G. R. Rossman, Phys. Chem. Miner., 1984, 11, 204–212 CrossRef CAS.
- T. Biró, I. J. Kovács, E. Király, G. Falus, D. Karátson, Z. Bendo, T. Fancsik and J. K. Sándorné, Eur. J. Mineral., 2016, 28, 313–327 CrossRef.
- M. A. Baron, R. Stalder, J. Konzett and C. A. Hauzenberger, Phys. Chem. Miner., 2015, 42, 53–62 CrossRef CAS.
- H. Stünitz, A. Thust, R. Heilbronner, H. Behrens, R. Kilian, A. Tarantola and J. D. Fitz Gerald, J. Geophys. Res., B, 2017, 122, 866–894 CrossRef.
- M. Di Sabatino, F. W. Thorsen, A. Lanterne, Y. Hu, J. A. Bones and E. Øvrelid, Investigation on quartz crucibles for monocrystalline silicon ingots for solar cells, in Energy Technology 2017 - Carbon Dioxide Management and Other Technologies, The Minerals, Metals & Materials Society/Springer, Cham, Switzerland, 2017, pp. 387–394 Search PubMed.
- K. Yamahara, X. Huang, S. Sakai, A. Utsunomiya, Y. Tsurita and K. Hoshikawa, Jpn. J. Appl. Phys., 2001, 40, 1178–1182 CrossRef CAS.
- M. Gierada, F. De Proft, M. Sulpizi and F. Tielens, J. Phys. Chem. C, 2019, 123, 17343–17352 CrossRef CAS.
- M.-P. Gaigeot, M. Sprik and M. Sulpizi, J. Phys.: Condens. Matter, 2012, 24, 124106 CrossRef PubMed.
- A. Comas-Vives, Phys. Chem. Chem. Phys., 2016, 18, 7475–7482 RSC.
- G. Melani, Y. Nagata, J. Wirth and P. Saalfrank, J. Chem. Phys., 2018, 149, 014707 CrossRef PubMed.
- L. Dalstein, E. Potapova and E. Tyrode, Phys. Chem. Chem. Phys., 2017, 19, 10343–10349 RSC.
- L. Zhang, C. Tian, G. A. Waychunas and Y. R. Shen, J. Am. Chem. Soc., 2008, 130, 7686–7694 CrossRef CAS PubMed.
- J.-P. Gallas, J.-M. Goupil, A. Vimont, J.-C. Lavalley, B. Gil, J.-P. Gilson and O. Miserque, Langmuir, 2009, 25, 5825–5834 CrossRef CAS PubMed.
- A. K. Kronenberg, H. F. B. Hasnan, C. W. Holyoke III, R. D. Law, Z. Liu and J. B. Thomas, Solid Earth, 2017, 8, 1025–1045 CrossRef.
- S.-M. Thomas, M. Koch-Müller, P. Reichart, D. Rhede, R. Thomas, R. Wirth and S. Matsyuk, Phys. Chem. Miner., 2009, 36, 489–509 CrossRef CAS.
- B. M. Auer and J. L. Skinner, J. Chem. Phys., 2008, 128, 224511 CrossRef CAS PubMed.
- J.-J. Max and C. Chapados, J. Chem. Phys., 2002, 116, 4626–4642 CrossRef CAS.
- F. Niu, R. Schulz, A. Castañeda Medina, R. Schmid and A. Erbe, Phys. Chem. Chem. Phys., 2017, 19, 13585–13595 RSC.
- F. Niu, M. Rabe, S. Nayak and A. Erbe, J. Chem. Phys., 2018, 148, 222824 CrossRef PubMed.
- D. A. Schmidt and K. Miki, J. Phys. Chem. A, 2007, 111, 10119–10122 CrossRef CAS PubMed.
- I. Bergonzi, L. Mercury, J.-B. Brubach and P. Roy, Phys. Chem. Chem. Phys., 2014, 16, 24830–24840 RSC.
- V. Ostroverkhov, G. A. Waychunas and Y. Shen, Chem. Phys. Lett., 2004, 386, 144–148 CrossRef CAS.
- M. Sulpizi, M.-P. Gaigeot and M. Sprik, J. Chem. Theory Comput., 2012, 8, 1037–1047 CrossRef CAS PubMed.
- J. Abe, N. Hirano and N. Tsuchiya, J. Mater. Sci., 2012, 47, 7971–7977 CrossRef CAS.
- J.-J. Max and C. Chapados, J. Chem. Phys., 2009, 131, 184505 CrossRef PubMed.
- Y. Maréchal, J. Mol. Struct., 2011, 1004, 146–155 CrossRef.
- A. A. Kananenka, N. J. Hestand and J. L. Skinner, J. Phys. Chem. B, 2019, 123, 5139–5146 CrossRef CAS PubMed.
- K. Ramasesha, L. De Marco, A. Mandal and A. Tokmakoff, Nat. Chem., 2013, 5, 935–940 CrossRef CAS PubMed.
- H. Ito and Y. Tanimura, J. Chem. Phys., 2016, 144, 074201 CrossRef PubMed.
- G. R. Medders and F. Paesani, J. Chem. Phys., 2015, 142, 212411 CrossRef PubMed.
- D. C. Elton and M. Fernández-Serra, Nat. Commun., 2016, 7, 10193 CrossRef CAS PubMed.
- N. Yang, C. H. Duong, P. J. Kelleher and M. A. Johnson, Nat. Chem., 2020, 12, 159–164 CrossRef CAS PubMed.
- S. T. van der Post, C.-S. Hsieh, M. Okuno, Y. Nagata, H. J. Bakker, M. Bonn and J. Hunger, Nat. Commun., 2015, 6, 8384 CrossRef CAS PubMed.
- N. Yang, C. H. Duong, P. J. Kelleher, A. B. McCoy and M. A. Johnson, Science, 2019, 364, 275–278 CAS.
- A. A. Kananenka, K. Yao, S. A. Corcelli and J. L. Skinner, J. Chem. Theory Comput., 2019, 15, 6850–6858 CrossRef CAS PubMed.
- M. Pastorczak, M. Nejbauer and C. Radzewicz, Phys. Chem. Chem. Phys., 2019, 21, 16895–16904 RSC.
- D. R. Moberg, S. C. Straight, C. Knight and F. Paesani, J. Phys. Chem. Lett., 2017, 8, 2579–2583 CrossRef CAS PubMed.
- G. Cassone, J. Sponer, S. Trusso and F. Saija, Phys. Chem. Chem. Phys., 2019, 21, 21205–21212 RSC.
- J. Catafesta, F. Alabarse, C. Levelut, A. Isambert, P. Hébert, S. Kohara, D. Maurin, J.-L. Bantignies, O. Cambon, G. Creff, P. Roy, J.-B. Brubach, T. Hammouda, D. Andrault and J. Haines, Phys. Chem. Chem. Phys., 2014, 16, 12202–12208 RSC.
- P. C. Burris, D. Laage and W. H. Thompson, J. Chem. Phys., 2016, 144, 194709 CrossRef PubMed.
- Y. Liao, P. Picot, M. Lainé, J.-B. Brubach, P. Roy, A. Thill and S. Le Caër, Nano Res., 2018, 11, 4759–4773 CrossRef CAS.
- K. C. Jena and D. K. Hore, J. Phys. Chem. C, 2009, 113, 15364–15372 CrossRef CAS.
- J. M. Headrick, E. G. Diken, R. S. Walters, N. I. Hammer, R. A. Christie, J. Cui, E. M. Myshakin, M. A. Duncan, M. A. Johnson and K. D. Jordan, Science, 2005, 308, 1765–1769 CrossRef CAS PubMed.
- Y. Ogata, Y. Kawashima, K. Takahashi and M. Tachikawa, Phys. Chem. Chem. Phys., 2015, 17, 25505–25515 RSC.
- N. Heine, M. R. Fagiani and K. R. Asmis, J. Phys. Chem. Lett., 2015, 6, 2298–2304 CrossRef CAS PubMed.
- F. Dahms, R. Costard, E. Pines, B. P. Fingerhut, E. T. J. Nibbering and T. Elsaesser, Angew. Chem., Int. Ed., 2016, 55, 10600–10605 CrossRef CAS PubMed.
- B. A. Gaweł, A. Ulvensøen, K. Łukaszuk, B. Arstad, A. M. F. Muggerud and A. Erbe, Spectroscopic data of water and hydroxyls in high purity natural quartz, BIRD, 2020, https://hdl.handle.net/11250/2670585.
- P. Griffith and J. Olinger, Sampling Techniques for Vibrational Spectroscopy, Continuum theories of diffuse reflection, in Handbook of Vibrational Spectroscopy, ed. J. Chalmers and P. Griffith, Wiley, Hoboken, USA, 2002, vol. 2, pp. 1–15 Search PubMed.
- R. E. Milliken and J. F. Mustard, J. Geophys. Res.: Planets, 2005, 110, 1–25 CrossRef.
- R. E. Milliken and J. F. Mustard, Icarus, 2007, 189, 574–588 CrossRef CAS.
- R. E. Milliken and J. F. Mustard, Icarus, 2007, 189, 550–573 CrossRef CAS.
- A. Ulvensøen, MSc thesis, NTNU, Norwegian University of Science and Technology, Trondheim, Norway, 2019.
- M. Wojdyr, J. Appl. Crystallogr., 2010, 43, 1126–1128 CrossRef CAS.
- G. Paul, C. Bisio, I. Braschi, M. Cossi, G. Gatti, E. Gianotti and L. Marchese, Chem. Soc. Rev., 2018, 47, 5684–5739 RSC.
- B. G. Pfrommer, F. Mauri and S. G. Louie, J. Am. Chem. Soc., 2000, 122, 123–129 CrossRef CAS.
- A. Burneau, O. Barres, J. Gallas and J. C. Lavalley, Langmuir, 1990, 6, 1364–1372 CrossRef CAS.
- N. V. Sokerina and N. N. Piskunova, Geochem. Int., 2011, 49, 181–190 CrossRef CAS.
- P. Gao, Z.-F. Zhao and Y.-F. Zheng, Asian J. Earth Sci., 2016, 123, 142–161 CrossRef.
- J.-i. Fukuda and I. Shimizu, Earth, Planets Space, 2019, 71, 136 CrossRef.
- R. Stalder and J. Konzett, Phys. Chem. Miner., 2012, 39, 817–827 CrossRef CAS.
- C. A. Geiger and G. R. Rossman, Am. Mineral., 2018, 103, 384–393 CrossRef.
- K. Hadjiivanov, Adv. Catal., 2014, 57, 99–318 CAS.
- S.-M. Thomas, K. Wilson, M. Koch-Müller, E. H. Hauri, C. McCammon, S. D. Jacobsen, J. Lazarz, D. Rhede, M. Ren, N. Blair and S. Lenz, Am. Mineral., 2015, 100, 1084–1092 CrossRef.
- F. Musso, M. Sodupe, M. Corno and P. Ugliengo, J. Phys. Chem. C, 2009, 113, 17876–17884 CrossRef CAS.
- R. D. Aines and G. R. Rossman, J. Geophys. Res., 1982, 89, 4059–4071 CrossRef.
- I. Bergonzi, L. Mercury, P. Simon, F. Jamme and K. Shmulovich, Phys. Chem. Chem. Phys., 2016, 18, 14874–14885 RSC.
- P. Maheshwari, D. Dutta, T. Muthulakshmi, B. Chakraborty, N. Raje and P. K. Pujari, J. Phys.: Condens. Matter, 2016, 29, 055003 CrossRef PubMed.
- A. J. Buttress, J. M. Rodriguez, A. Ure, R. S. Ferrari, C. Dodds and S. W. Kingman, Miner. Eng., 2019, 131, 407–419 CrossRef CAS.
| This journal is © The Royal Society of Chemistry 2020 |