 Open Access Article
Selective determination of Ag+ in the presence of Cd2+, Hg2+ and Cu2+ based on their different interactions with gold nanoclusters†
Rentian Guan,
Lixia Tao,
Yingying Hu,
Cong Zhang,
Yongping Wang,
Min Hong and
Qiaoli Yue
 *
*
Department of Chemistry, Liaocheng University, Liaocheng 252059, China. E-mail: yueqiaoli@yahoo.com
First published on 9th September 2020
Abstract
In this work, a fluorescence method was developed for selective detection of Ag+ in the presence of Cd2+, Hg2+, and Cu2+ based on gold nanoclusters (AuNCs). That is, bovine serum albumin (BSA) templated AuNCs with double emission peaks were synthesized using BSA as a protective agent. AuNCs with uniform distribution and average size between 2.0 and 2.2 nm were synthesized using a green and simple method, and showed bright orange-red fluorescence under ultraviolet light. AuNCs have two emission peaks at 450 nm and 630 nm with an excitation wavelength of 365 nm. Under alkaline conditions, Cd2+ can combine with the surface sulfhydryl groups of BSA–AuNCs to form Cd–S bonds, which cause AuNCs to aggregate, resulting in an increase in fluorescence intensity at 630 nm. Conversely, due to the d10–d10 metal affinity interaction, the addition of Hg2+ can reduce the fluorescence peak at 630 nm. Ag+ was reduced to Ag0 by gold nuclei in AuNCs, forming a stable hybrid Au@ AgNCs species with blue-shifted and enhanced fluorescence. Finally, the paramagnetic behavior of Cu2+ combined with BSA causes the excited electrons of the gold cluster to lose their energy via ISC, eventually leading to simultaneous quenching of the two emission peaks. The results show that the limit of detection (LOD) of Ag+, Hg2+, Cd2+ and Cu2+ is 1.19 μM, 3.39 μM, 1.83 μM and 5.95 μM, respectively.
Introduction
Metal nanoclusters (NCs), have been of great interest in nanomedicine for their use in biosensors,1,2 bioimaging2–4 and therapeutics.5–7 Their ultra-small size (<2 nm) is ideal for drug delivery because it combines the advantages of low toxicity, high renal clearance and long blood circulation time.5,6,8 Metal NCs consist of a few to about 100 atoms (usually gold (Au) or silver (Ag)) and differ from nanoparticles in that they exhibit molecular-like properties.9–11 They have long-lived fluorescence in the infrared or near-infrared region and are excited by two light groups, which makes them very suitable for in vitro and in vivo imaging. Fluorescent metal (Au, Ag) nanoclusters (NCs) have become one of the most important nanomaterials, and have been widely used in sensing, biomarkers and biological imaging due to their excellent optical properties.12–14Metal nanoclusters are very reactive in nature and tend to agglomerate without a protective base, and NCs are usually synthesized in solution by a fairly simple method using small organic molecules or polymers or biological templates.9,15 Proteins are used as templates and reducers to construct stable and biocompatible metal nanoclusters.16 Because the amines, carboxyls, and sulfhydryl groups in proteins can act as effective stabilizers for nanoparticles, proteins will play an important role in guiding the synthesis of functional nanomaterials under mild conditions.17 BSA was selected for its biocompatibility, water solubility, affordability, and ubiquity in self-assembly, imaging, and sensor applications.18–20 In addition, each BSA molecule has 28 cysteine and 20 tyrosine residues, resulting in greater capping and reduction capacity,21,22 gold nanoclusters,18,23 silver nanoclusters,24 copper nanoclusters,17,21 gold–silver bimetallic nanoclusters,22 cerium–gold bimetallic nanoclusters,25 and copper–zinc bimetallic nanoclusters26 have been synthesized with BSA. In a paradigm-shifting work, Xie et al.18 designed the first AuNCs for stable synthesis using BSA as a protein template. In recent years, the use of biological protein macromolecules (BSA,18,24 lysozyme27 and lactoferrin28) as stabilizers and reductants under alkaline conditions has been more popular.
Ag is widely used in jewelry, coins, medical, imaging, electrical and electronic equipment due to its excellent physical and chemical properties.29,30 However, due to improper treatment of silver-containing products, Ag+ pollution has become a major environmental problem.30 In addition, Ag+ has adverse effects on immune system, nervous system and digestive system.31 In animal experiments, silver seemed to be distributed in all organs of the organisms studied, and the highest levels were observed in the intestine and stomach.28 Therefore, it is of great significance to construct a simple and rapid method with high sensitivity and selectivity to detect these metal ions.
Various methods have been used to detect Ag+, including inductively coupled plasma mass spectrometry (ICP-MS),31,32 atomic absorption spectroscopy (AAS),33 and inductively coupled plasma emission spectroscopy (ICP-OES),34 and these methods can be used well in lab. In the past few years, several optical sensors based on small organic molecules (fluorophores or chromophores),35 biomolecules (proteins,36 antibodies,37 oligonucleotides,38 and DNA enzymes39) and various polymer40 and inorganic41–45 materials have been developed for the detection of heavy metal ions. In addition, it will be attractive to develop a label-free approach with improved features such as cost, speed, simplicity, sensitivity, selectivity, compatibility with water based environments, and miniaturization.46
The focus of our work is to construct a novel approach to detect Ag+ by using BSA as a template to synthesize AuNCs with double emission peaks. At the same time, it also has different response signals to Hg2+, Cd2+ and Cu2+. The experimental results show that the proposed method has a good sensitivity and selectivity for Ag+ detection in the presence of Hg2+, Cd2+ and Cu2+.
Experimental
Materials and reagents
BSA was purchased from Sigma-Aldrich (St. Louis, MO, U.S.A.). The metal salts were ordered from Aladdin Reagent Co., Ltd. (Shanghai, China, http://www.aladdin-e.com). There were NaOH, FeCl3, CuCl2, HgCl2, Ho(NO3)3·5H2O, AgNO3, ZnCl2, Mn(CH3COO)2, MgCl2, CrCl3, Ce(NO3)3·6H2O, La(NO3)3·6H2O, Dy(NO3)3·6H2O, TbCl3·6H2O, HAuCl4·3H2O, NaCl, CdCl2, CaCl2 and KCl. All chemicals from commercial sources were of analytical grade and used directly without further purification if no special instructions. All solutions were prepared and diluted by ultrapure water from Milli-Q water purified system.Instruments
Fluorescence spectra and intensity were obtained on an F-7000 spectrophotometer (Hitachi, Japan, https://www.hitachi-hightech.com). Absorption spectral measurements were carried out on a UV-750 ultraviolet spectrophotometer (Perkin-Elmer, USA, http://yeepart.com). Transmission electron microscope (TEM) images were performed on a JEM 2100 electron microscope (JEOL Ltd., Japan, https://www.jeol.co.jp). TEM worked with an acceleration voltage at 200 kV, and a carbon-coated copper grid was used for sample suspension. X-ray photoelectron spectroscopy (XPS) measurements were undertaken with a K-Alpha spectrometer (Thermo Scientific Ltd., USA, http://www.thermofisher.com). Circular dichroism spectral measurements were carried out on J-810 CD circular dichroism (Jasco, Japan, http://www.jasco.co.jp). In addition to this, there are ZF-6 three-purpose ultraviolet analyzer (Jintan Shenglan Instrument Manufacturing Co., Ltd., China, https://www.czshenglan.com/), ultracentrifuge (Hitachi, Japan, https://www.hitachi-hightech.com), DZ-2A vacuum drying oven (Tianjin Taisite Instrument Co., Ltd., http://www.taisite.cn/en_product-11.html), DF-101S collector type constant temperature heating magnetic stirrer, 12 kDa dialysis bag and ordinary carbon film copper mesh.Synthesis of gold nanoclusters
Fluorescent BSA–AuNCs synthesized through BSA-mediated reduction of HAuCl4 were based on a modification of a previously reported method.18 Wash all glassware used for the experiment with aqua regia. 30 mL BSA solution with a concentration of 50 mg mL−1 was prepared in deionized water at room temperature (25 °C). To the solution was added 30 mL of HAuCl4 (10 mM) under magnetic stirring. After two minutes, 1.0 M NaOH solution (5 mL) was added. The temperature was gradually raised to 60 °C, and the reaction was allowed to proceed under vigorous stirring 3 hours. The golden yellow solution gradually turned into a brown solution indicating the formation of red fluorescent AuNCs. After cooling to room temperature, the resulting AuNCs were dialyzed for 48 hours (water exchange every 12 hours) in a dialysis membrane having a molecular weight cut off of 12 kDa for purification. The as prepared BSA–AuNCs were stored at 4 °C for further use.Detection procedure
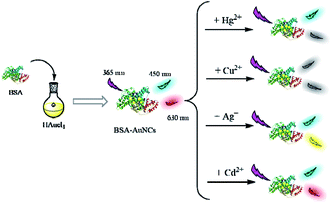
Detection of metal ions was performed in aqueous solution at room temperature. First, standard stock solutions of Ag+, Hg2+, Cd2+, Cu2+ with different concentrations were prepared by dissolving metal ions in deionized water. Subsequently, freshly prepared aliquots of AuNCs were added to 1.5 mL microcentrifuge tube and diluted twice. Then, different concentrations of different metal ion (Ag+, Hg2+, Cd2+, Cu2+) solutions were added and mixed solution in a vortex mixer. The fluorescence spectra of the resulting solutions was recorded (Ex = 360 nm). As can be seen from Scheme 1, AuNCs have dual emission peaks at 450 nm and 630 nm, respectively. When Ag+ was added, the peak at 450 nm remained unchanged, and the peak at 630 nm blue-shifted. After Hg2+ was added, the peak at 450 nm remained unchanged, and the fluorescence intensity at 630 nm gradually decreased with the increase of Hg2+. After adding Cu2+, the fluorescence intensity at the peak of 450 nm and 630 nm decreased gradually with the increase of Cu2+. After Cd2+ was added, the peak at 450 nm remained unchanged, and the fluorescence intensity at 630 nm increased with the increase of Cd2+.Results and discussion
Characterization of the AuNCs
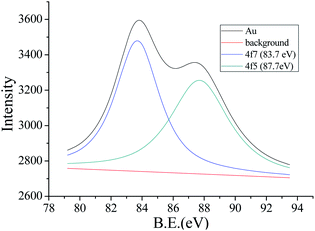
The template synthesis process for AuNCs is shown in Scheme 1. As previously reported,18 AuNCs templated by BSA were synthesized by a simple and environmentally friendly synthesis approach. TEM image (Fig. 1) showed that the obtained BSA functionalized AuNCs were monodisperse with an average size of 2.1 ± 0.38 nm and the size of 62% of the observed AuNCs distributed from 2.0 to 2.2 nm. HR-TEM image shows a lattice spacing of 2.33 Å (Fig. 1a, inset) that agrees well with the Au(111) facet.47,48 As demonstrated in Fig. 2, XPS result for Au 4f7/2 can be deconvoluted into two components centered at Au0 (83.7 eV) and Au+ (87.7 eV), which is in good consistency with the previously reported AuNCs.49 The circular dichroism spectra were measured by a circular dichroism chromatograph. In the far infrared region, the sample was analyzed in a well-cleaned quartz cuvette with a path length of 1 cm. The wavelength versus mdge values are plotted in Fig. S1.†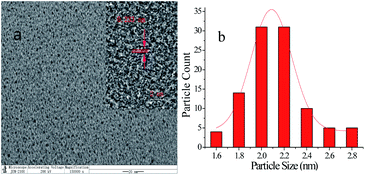 | ||
| Fig. 1 TEM images (a) (inset, the HR-TEM images) and particle size distribution diagram (b) of AuNCs. | ||
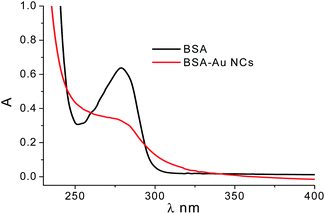
At the same time, we also studied the optical properties of AuNCs and discussed the UV-vis absorption spectra and fluorescence spectra of AuNCs. As seem in Fig. S2,† AuNCs exhibit bright red fluorescence under the illumination of a 365 nm UV lamp. The UV absorption is illustrated in Fig. 3. There is an absorption peak at 280 nm and a significant absorption peak at 360 nm, which is the optimal excitation wavelength of the fluorescence (emission peak at 450 nm and 630 nm). Using Rhodamine B as a reference, the relative quantum yield (QY) of AuNCs was calculated to be 3.36%, as shown in Fig. S3.†
Optimization of conditions
The influences of experimental conditions for metal ions assay were investigated in detail. It was carried out on buffer composition, ionic strength and pH for practical detection applications. The ultrapure water is used as detection media.Effect of buffer species
We investigated the different buffer systems (10 mM) for testing the effects of metal ions, including NaH2PO4–Na2HPO4 solution, Tris–HCl solution, HEPES solution, NaAc–HAc solution and Na2B2O7 solution. Five aliquots of freshly prepared AuNCs were diluted twice with the above five buffers and the fluorescence intensity was measured, as shown in Fig. S4.† By contrast, it is apparent from the figure that the HEPES buffer system has the largest change in fluorescence intensity, that is, the detection of metal ions in the HEPES buffer solution is the most sensitive compared to the five buffer systems. Therefore, the optimal buffer solution for the detection of various metal ions by AuNCs is the HEPES solution.Effect of ionic strength
In this work, we used NaCl to adjust the ionic strength and explore the effect of NaCl concentration on the fluorescence intensity of AuNCs. The effect of NaCl concentration on the fluorescence intensity of AuNCs was measured using different concentrations of NaCl (including 0, 0.5, 1.0, 1.5 and 2.0 mM), as seen in Fig. S5.† It can be inferred that for the AuNCs products prepared by the experimental method, the fluorescence intensity does not change much in different ionic strength ranges, so it is concluded that the fluorescence stability of AuNCs is hardly affected by the ionic strength.Effect of pH
The freshly prepared AuNCs were diluted twice with HEPES buffer and the pH of the whole system was adjusted to 5.5, 6.0, 6.5, 7.0, 7.5, 8.0, 8.5, 9.5 and 10.0 by adding an appropriate amount of NaOH or HCl. The fluorescence intensity of BSA–AuNCs at different pH values was measured, as shown in Fig. S6.† It can be observed from the figure that the fluorescence intensity of BSA–AuNCs at 450 nm increases gradually with the pH value, while the fluorescence intensity remains stable at 630 nm. In addition, comparing the fluorescence spectra of AuNCs after dialysis, it can be inferred that the pH of AuNCs after dialysis is weakly alkaline (pH 8 is measured after pH meter measurement) has no effect on metal ion detection.Fluorescence lifetime detection
The fluorescence lifetime of BSA–AuNCs in the absence of Ag+, Hg2+, Cd2+, Cu2+ and the presence of four metal ions was measured on an FL-TCSPC fluorescence spectrophotometer using the luminescence decay mode. The composite was excited by a 360 nm xenon flash and an emission wavelength of 630 nm and 570 nm, and then the fluorescence decay was recorded, as shown in Fig. S7 (Em = 630 nm) and Fig. S8† (Em = 570 nm).Selectivity
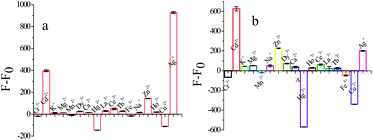
Under optimal conditions, the selectivity of AuNCs was evaluated by adding 300 μM metal ions (Ag+, Hg2+, Cd2+, Cu2+) and detecting the response of AuNCs to other metal cations. A stock solution of various metal ions studied was prepared from metal salts. As illustrated in Fig. 4a, it can be observed that most of the metal ions at high concentrations cause only negligible fluorescence changes at 570 nm: Cr3+, Mn2+, Zn2+, Dy3+, Ho+, La3+, Tb3+, Ce3+, Ca2+, Na+, Mg2+, K+, and Fe3+ (5 times). The results confirmed that the determination of Ag+ using the AuNCs cluster system has good selectivity. At 630 nm, AuNCs also showed good selectivity in Hg2+, Cd2+and Cu2+ determination (Fig. 4b).Sensitivity for metal ions detection
Four metal ions of Cd2+, Ag+, Hg2+ and Cu2+ were determined under the optimal conditions. The linear response of the fluorescence intensity to the concentration of Ag+ is shown in Fig. 5. As the concentration of Ag+ increases gradually, the peak at 450 nm remains unchanged and at 630 nm is blue-shift to 570 nm (Fig. 5a). The linear response of the fluorescence intensity to the concentration of Cd2+, Hg2+ and Cu2+ are illustrated in Fig. S9.† When the concentration of Cd2+ increases, the peak at 450 nm remains unchanged, and the fluorescence intensity at 630 nm increases (Fig. S9a†). When the concentration of Hg2+ increases gradually, the peak at 450 nm also remains unchanged, and the fluorescence intensity at 630 nm decreases with the increase of Hg2+ (Fig. S9c†). When the concentration of Cu2+ increases, both the peaks of 450 nm and 630 nm decrease (Fig. S9e†). As shown in Fig. 5b, the fluorescence intensity of AuNCs shows a good linear response with Ag+ concentration in the range of 5–400 μM with LOD of 1.19 μM. Meanwhile, the fluorescence intensity of AuNCs and the concentrations of Cd2+, Hg2+ and Cu2+ also showed a good linear range of 10–100 μM (Fig. S9b†), 20–260 μM (Fig. S9d†), and 20–250 μM (Fig. S9f†) with the LOD at 1.83 μM, 3.39 μM, and 5.95 μM, respectively.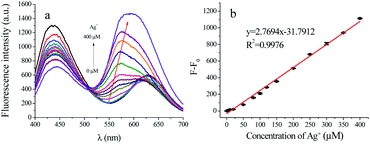 | ||
| Fig. 5 Fluorescence spectra of AuNCs with the increase of Ag+ concentration (a) and the linear response of fluorescence intensity of AuNCs at 570 nm to Ag+ concentration (b). | ||
As shown in Table 1, the method in this paper was compared with the methods reported in the literature to analyze performance from material, linear range and detection limit. We found that the detection limit of this method was not the lowest, but the synthesis of AuNCs in this paper was simple in process, cheap in raw materials and convenient in operation.
| Method | Material | Linear range (μM) | LOD (μM) | Ref. |
|---|---|---|---|---|
| Fluorometry and colorimetry | Probe MNTPZ | 0–100 | 1.36 | 50 |
| Ratio fluorescence | Probe PPN | 5–90 | 0.86 | 51 |
| UV-vis spectral | Probe PTB-1 | 1.2–24 | 3.67 | 52 |
| Electrochemistry | Fe3O4@Au nanoparticles and magnetic electrode | 0.117–17.7 | 0.059 | 53 |
| Colorimetry | Colorimetric sensor (DAC-Tu) | 10–1 × 10⁴ | 10 | 54 |
| Fluorometry and colorimetry | Probe L | 0–30 | 1.7 | 55 |
| Colorimetry | Paper-based colorimetric array test strip | — | 1.69 | 56 |
| Fluorometry | BSA–AuNCs | 5–400 | 1.19 | This work |
In addition, we also detected the influence of Cu2+, Hg2+ and Cd2+ (50 μM) on the detection of Ag+. As shown in Fig. 6a, the peak at 630 nm is still blue-shift with the increase of Ag+ concentration, and the peak intensity also increases gradually in the presence of Cu2+, Hg2+ and Cd2+. The linearity for Ag+ detection in the mixture of Cu2+, Hg2+ and Cd2+ (50 μM) are observed in Fig. 6b. It can be seen that Cu2+, Hg2+ and Cd2+ have no obvious effect on the determination of Ag+.
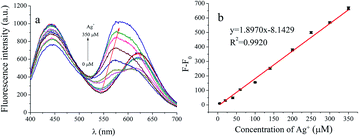 | ||
| Fig. 6 The effects of Cu2+, Hg2+ and Cd2+ (50 μM) on the detection of Ag+ (a) and the linear response of fluorescence intensity of AuNCs at 570 nm to Ag+ concentration (b). | ||
Based on the linear relationship between the fluorescence intensity of AuNCs and Ag+ concentration, a fluorometric method was designed to detect Ag+ rapidly. The test of Ag+ detection was also carried out using solid substrate. After the silica gel plates were pretreated with AuNCs, a series of Ag+ stock solutions prepared were dripped onto the plates in sequence. After the silica gel plate was dry, ultraviolet lamp was used to illuminate the silica gel plate at 365 nm, as shown in Fig. 7. The fluorescence intensity also increased gradually with the increase of Ag+ concentration.
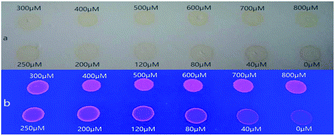 | ||
| Fig. 7 Photographs of AuNCs in the presence of various concentrations of Ag+ under the fluorescent lamp (a) and the ultraviolet lamp (b). | ||
Analysis of real samples
Reliability of Ag+ detection for the application in real samples was examined by recovery experiment using the standard addition method (Table 2). Lake water samples were collected from the artificial lake on campus of Liaocheng University. The recovery values range from 96.5% to 106.7% and the relative standard deviations (RSD) are from 1.59% to 2.76%. The above results reveal that the present fluorescent method can be applied to the analysis of Ag+ in real samples.| Sample | Added μM | Found μM | Recovery% | RSD% |
|---|---|---|---|---|
| Lake water | 20 | 19.3 ± 0.3 | 96.5 | 2.76 |
| 50 | 49.2 ± 1.7 | 98.4 | 2.42 | |
| 100 | 106.5 ± 0.5 | 106.7 | 1.69 | |
| 200 | 213.8 ± 1.4 | 106.7 | 1.59 | |
| 250 | 260.1 ± 1.4 | 104.1 | 1.77 |
Possible mechanism
The newly designed dual emission biosensor was mainly based on the use of AuNCs as illustrated in Scheme 1.As the concentration of Ag+ increases, the fluorescence emission of BSA–AuNCs decreases slightly first, then blue shift occurs and increases at 570 nm. Once the blue shift in the emission spectrum occurs to 570 nm, even if the intensity gradually increases with the concentration of Ag+, the emission peak does not shift further (Fig. 5a). Our synthetic dual-emitting AuNCs have a relatively small core size of BSA–AuNCs. Therefore, a similar response mechanism was proposed, The added Ag+ were reduced to Ag0 by gold nuclei in AuNCs, forming a stable Au@AgNCs hybrid species with blue-shifted and fluorescence enhancement, which deposited on the AuNCs surface inside the BSA, which remove surface defects of AuNCs and significantly increase AuNCs fluorescence intensity.57–59
It has been reported that Cd2+ can form Cd–SH complexes on AuNCs surface due to its interaction with sulfhydryl groups under alkaline conditions.60,61 Therefore, in the presence of Cd2+, the mechanism of AuNCs system fluorescence enhancement was hypothesized to be due to the formation of complexes between Cd2+ and BSA, which reduced the distance between AuNCs and resulted in aggregation and increased fluorescence intensity.62
It can be clearly observed from Fig. S9c† that with the gradual increase of Hg2+ concentration, the fluorescence intensity of double-emitting BSA–AuNCs does not change much at 450 nm, but the fluorescence intensity decreases sharply at 630 nm. Therefore, the most likely explanation for the quenching of BSA–AuNCs fluorescence, in the presence of Hg2+, is based on the d10–d10 metal affinity interaction between Au+ and Hg2+ (Au+–Hg2+).46,63,64
It is a well-known fact that paramagnetic ions quench fluorescence by promoting ISC, thereby reducing fluorescence intensity. Therefore, the paramagnetic behavior of the combination of Cu2+ and BSA causes the excited electrons of the Au cluster to lose its energy as an ISC, resulting in quenching of fluorescence. With the increase of Cu2+ concentration, the fluorescence peaks at 450 nm and 630 nm are quenched (Fig. S9e†), confirming that quenching is achieved by Cu2+ binding to BSA rather than by free metal ions.46
Conclusions
In this work, we used BSA as a protective agent to synthesize gold nanoclusters with dual emission peaks (450 nm, 630 nm), which can generate four different responses to four different metal ions, and can construct biosensing. When Cd2+ was added, the peak at 450 nm remained unchanged, and the fluorescence intensity at 630 nm peak increased with the increase of Cd2+. After addition of Ag+, the peak at 450 nm remained unchanged, and the peak at 630 nm blue-shifted. After adding Hg2+, the peak at 450 nm remained unchanged, and the fluorescence intensity at 630 nm peak decreased with the increase of Hg2+. After Cu2+ addition, the fluorescence intensity at the 450 nm and 630 nm peaks decreased with the increase of Cu2+. The method has good selectivity and only responds to four metal ions of Cd2+, Ag+, Hg2+ and Cu2+. This method is a viable tool for detecting metal ions and is of great significance for the research of biosensors.Conflicts of interest
There are no conflicts to declare.Acknowledgements
This work was financially supported by the Natural Science Foundation of China (91543206), the Natural Science Foundation (ZR2014BQ017, ZR2015BM024, and 2013SJGZ07), the Tai-Shan Scholar Research Fund of Shandong Province, the Young Innovative Talents Introduction & Cultivation Program for Colleges and Universities of Shandong Province: Innovative Research Team on biomedical sensing and food safety Research and research foundation of Liaocheng University.Notes and references
- L. Zhang and E. Wang, Metal nanoclusters: new fluorescent probes for sensors and bioimaging, Nano Today, 2014, 9, 132–157 CrossRef CAS.
- L. Y. Chen, C. W. Wang, Z. Yuan and H. T. Chang, Fluorescent gold nanoclusters: recent advances in sensing and imaging, Anal. Chem., 2015, 87, 216–229 CrossRef CAS.
- X. L. Guével, Recent advances on the synthesis of metal quantum-nanoclusters and their application for bioimaging, IEEE J. Sel. Top. Quantum Electron., 2015, 20, 45–56 Search PubMed.
- L. Shang, F. Stockmar, N. Azadfar and G. U. Nienhaus, Intracellular thermometry by using fluorescent gold nanoclusters, Angew. Chem., Int. Ed. Engl., 2013, 52, 11154–11157 CrossRef CAS.
- X. D. Zhang, J. Chen, Z. Luo, D. Wu, X. Shen, S. S. Song, Y. M. Sun, P. X. Liu, J. Zhao, S. Huo, S. Fan, F. Fan, X. J. Liang and J. Xie, Enhanced tumor accumulation of sub-2 nm gold nanoclusters for cancer radiation therapy, Adv. Healthcare Mater., 2014, 3, 133–141 CrossRef CAS.
- J. Liu, M. Yu, C. Zhou, S. Yang, X. Ning and J. Zheng, Passive tumor targeting of renal-clearable luminescent gold nanoparticles: long tumor retention and fast normal tissue clearance, J. Am. Chem. Soc., 2013, 135, 4978–4981 CrossRef CAS.
- T. D. Fernandez, J. R. Pearson, M. P. Leal, M. J. Torres, M. Blanca, C. Mayorga and X. Le Guevel, Intracellular accumulation and immunological properties of fluorescent gold nanoclusters in human dendritic cells, Biomaterials, 2015, 43, 1–12 CrossRef CAS.
- X. D. Zhang, Z. Luo, J. Chen, X. Shen, S. Song, Y. Sun, S. Fan, F. Fan, D. T. Leong and J. Xie, Ultrasmall Au10–12(SG)10–12 nanomolecules for high tumor specificity and cancer radiotherapy, Adv. Mater., 2014, 26, 4565–4568 CrossRef CAS.
- J. Zheng, C. Zhou, M. Yu and J. Liu, Different sized luminescent gold nanoparticles, Nanoscale, 2012, 4, 4073–4083 RSC.
- R. Jin, Quantum sized, thiolate-protected gold nanoclusters, Nanoscale, 2010, 2, 343–362 RSC.
- D. E. Jiang, The expanding universe of thiolated gold nanoclusters and beyond, Nanoscale, 2013, 5, 7149–7160 RSC.
- Y.-H. Lin and W.-L. Tseng, Ultrasensitive sensing of Hg2+ and CH3Hg+ based on the fluorescence quenching of lysozyme type vi-stabilized gold nanoclusters, Anal. Chem., 2010, 82, 9194–9200 CrossRef CAS.
- M. Wang, Q. Mei, K. Zhang and Z. Zhang, Protein–gold nanoclusters for identification of amino acids by metal ions modulated ratiometric fluorescence, Analyst, 2012, 137, 1618–1623 RSC.
- Y. Yue, T. Y. Liu, H. W. Li, Z. Liu and Y. Wu, Microwave-assisted synthesis of BSA-protected small gold nanoclusters and their fluorescence-enhanced sensing of silver(I) ions, Nanoscale, 2012, 4, 2251–2254 RSC.
- L. Shang, S. Dong and G. U. Nienhaus, Ultra-small fluorescent metal nanoclusters: synthesis and biological applications, Nano Today, 2011, 6, 401–418 CrossRef CAS.
- Y. Xu, J. Sherwood, Y. Qin, D. Crowley, M. Bonizzoni and Y. Bao, The role of protein characteristics in the formation and fluorescence of Au nanoclusters, Nanoscale, 2014, 6, 1515–1524 RSC.
- C. Wang, C. Wang, L. Xu, H. Cheng, Q. Lin and C. Zhang, Protein-directed synthesis of pH-responsive red fluorescent copper nanoclusters and their applications in cellular imaging and catalysis, Nanoscale, 2014, 6, 1775–1781 RSC.
- J. Xie, Y. Zheng and J. Y. Ying, Protein-directed synthesis of highly fluorescent gold nanoclusters, J. Am. Chem. Soc., 2009, 131, 888–889 CrossRef CAS.
- A. G. Tkachenko, H. Xie, D. Coleman, W. Glomm, J. Ryan, M. F. Anderson, S. Franzen and D. L. Feldheim, Multifunctional gold nanoparticle–peptide complexes for nuclear targeting, J. Am. Chem. Soc., 2003, 125, 4700–4701 CrossRef CAS.
- X. Chen and G. A. Baker, Cholesterol determination using protein-templated fluorescent gold nanocluster probes, Analyst, 2013, 138, 7299–7302 RSC.
- L. Xiaoqing, L. Ruiyi, L. Xiaohuan and L. Zaijun, Ultra sensitive and wide-range pH sensor based on the BSA-capped Cu nanoclusters fabricated by fast synthesis through the use of hydrogen peroxide additive, RSC Adv., 2015, 5, 48835–48841 RSC.
- N. Zhang, Y. Si, Z. Sun, L. Chen, R. Li, Y. Qiao and H. Wang, Rapid, selective, and ultrasensitive fluorimetric analysis of mercury and copper levels in blood using bimetallic gold-silver nanoclusters with "silver effect"-enhanced red fluorescence, Anal. Chem., 2014, 86, 11714–11721 CrossRef CAS.
- C. Fu, C. Ding, X. Sun and A. Fu, Curcumin nanocapsules stabilized by bovine serum albumin-capped gold nanoclusters (BSA–AuNCs) for drug delivery and theranosis, Mater. Sci. Eng., C, 2018, 87, 149–154 CrossRef CAS.
- C. Guo and J. Irudayaraj, Fluorescent Ag clusters via a protein-directed approach as a Hg(II) ion sensor, Anal. Chem., 2011, 83, 2883–2889 CrossRef CAS.
- Y. N. Chen, P. C. Chen, C. W. Wang, Y. S. Lin, C. M. Ou, L. C. Ho and H. T. Chang, One-pot synthesis of fluorescent BSA–Ce/Au nanoclusters as ratiometric pH probes, Chem. Commun., 2014, 50, 8571–8574 RSC.
- H. Chen, L. Lin, H. Li, J. Li and J.-M. Lin, Aggregation-induced structure transition of protein-stabilized zinc/copper nanoclusters for amplified chemiluminescence, ACS Nano, 2015, 9, 2173–2183 CrossRef CAS.
- H. Wei, Z. Wang, L. Yang, S. Tian, C. Hou and Y. Lu, Lysozyme-stabilized gold fluorescent cluster: synthesis and application as Hg2+ sensor, Analyst, 2010, 135, 1406–1410 RSC.
- C. Sun, H. Yang, Y. Yuan, X. Tian, L. Wang, Y. Guo, L. Xu, J. Lei, N. Gao, G. J. Anderson, X. J. Liang, C. Chen, Y. Zhao and G. Nie, Controlling assembly of paired gold clusters within apoferritin nanoreactor for in vivo kidney targeting and biomedical imaging, J. Am. Chem. Soc., 2011, 133, 8617–8624 CrossRef CAS.
- N. Hadrup and H. R. Lam, Oral toxicity of silver ions, silver nanoparticles and colloidal silver-a review, Regul. Toxicol. Pharmacol., 2014, 68, 1–7 CrossRef CAS.
- B. Li, X. Wang, X. Shen, W. Zhu, L. Xu and X. Zhou, Aggregation-induced emission from gold nanoclusters for use as a luminescence-enhanced nanosensor to detect trace amounts of silver ions, J. Colloid Interface Sci., 2016, 467, 90–96 CrossRef CAS.
- K. Ndung'u, M. A. Ranville, R. P. Franks and A. R. Flegal, On-line determination of silver in natural waters by inductively-coupled plasma mass spectrometry: influence of organic matter, Mar. Chem., 2006, 98, 109–120 CrossRef.
- W. Guo, S. Hu, J. Zhang and H. Zhang, Elimination of oxide interferences and determination of ultra-trace silver in soils by ICP-MS with ion-molecule reactions, Sci. Total Environ., 2011, 409, 2981–2986 CrossRef CAS.
- C. Bianco, S. Kezic, M. Crosera, V. Svetlicic, S. Segota, G. Maina, C. Romano, F. Larese and G. Adami, In vitro percutaneous penetration and characterization of silver from silver-containing textiles, Int. J. Nanomed., 2015, 10, 1899–1908 CrossRef CAS.
- X. J. Yang, R. Foley and G. K. C. Low, A modified digestion procedure for analysing silver in environmental water samples, Analyst, 2002, 127, 315–318 RSC.
- E. M. Nolan and S. J. Lippard, Tools and tactics for the optical detection of mercuric ion, Chem. Rev., 2008, 108, 3443–3480 CrossRef CAS.
- S. V. Wegner, A. Okesli, P. Chen and C. He, Design of an emission ratiometric biosensor from MerR family proteins: a sensitive and selective sensor for Hg2+, J. Am. Chem. Soc., 2007, 129, 3474–3475 CrossRef CAS.
- M. Matsushita, M. M. Meijler, P. Wirsching, R. A. Lerner and K. D. Janda, A blue fluorescent antibody-cofactor sensor for mercury, Org. Lett., 2005, 7, 4943–4946 CrossRef CAS.
- J. Greeley, W. P. Krekelberg and M. Mavrikakis, Strain-induced formation of subsurface species in transition metals, Angew. Chem., 2004, 116, 4396–4400 CrossRef.
- J. M. Thomas, R. Ting and D. M. Perrin, High affinity DNAzyme-based ligands for transition metal cations – a prototype sensor for Hg2+, Org. Biomol. Chem., 2004, 2, 307–312 RSC.
- I.-B. Kim and U. H. F. Bunz, Modulating the sensory response of a conjugated polymer by proteins: an agglutination assay for mercury ions in water, J. Am. Chem. Soc., 2006, 128, 2818–2819 CrossRef CAS.
- J. S. Lee, M. S. Han and C. A. Mirkin, Colorimetric detection of mercuric ion Hg2+ in aqueous media using DNA-functionalized gold nanoparticles, Angew. Chem., Int. Ed. Engl., 2007, 46, 4093–4096 CrossRef CAS.
- X. Xue, F. Wang and X. Liu, One-step, room temperature, colorimetric detection of mercury Hg2+ using DNA/nanoparticle conjugates, J. Am. Chem. Soc., 2008, 130, 3244–3245 CrossRef CAS.
- G. K. Darbha, A. K. Singh, U. S. Rai, E. Yu, H. Yu and P. Chandra Ray, Selective detection of mercury(II) ion using nonlinear optical properties of gold nanoparticles, J. Am. Chem. Soc., 2008, 130, 8038–8043 CrossRef CAS.
- D. Li, A. Wieckowska and I. Willner, Optical analysis of Hg2+ ions by oligonucleotide-gold-nanoparticle hybrids and DNA-based machines, Angew. Chem., Int. Ed. Engl., 2008, 47, 3927–3931 CrossRef CAS.
- M. Rex, F. E. Hernandez and A. D. Campiglia, Pushing the limits of mercury sensors with gold nanorods, Anal. Chem., 2006, 78, 445–451 CrossRef CAS.
- J. Xie, Y. Zheng and J. Y. Ying, Highly selective and ultrasensitive detection of Hg2+ based on fluorescence quenching of Au nanoclusters by Hg2+–Au+ interactions, Chem. Commun., 2010, 46, 961–963 RSC.
- M. I. Halawa, B. S. Li and G. Xu, Novel synthesis of thiolated gold nanoclusters induced by lanthanides for ultrasensitive and luminescent detection of the potential anthrax spores' biomarker, ACS Appl. Mater. Interfaces, 2020, 12, 32888–32897 CrossRef CAS.
- E. Ju, Z. Liu, Y. Du, Y. Tao, J. Ren and X. Qu, Heterogeneous assembled nanocomplexes for ratiometric detection of highly reactive oxygen species in vitro and in vivo, ACS Nano, 2014, 8, 6014–6023 CrossRef CAS.
- M. Zhuang, C. Ding, A. Zhu and Y. Tian, Ratiometric fluorescence probe for monitoring hydroxyl radical in live cells based on gold nanoclusters, Anal. Chem., 2014, 86, 1829–1836 CrossRef CAS.
- P. R. Dongare, A. H. Gore, G. B. Kolekar and B. D. Ajalkar, A phenazine based colorimetric and fluorescent chemosensor for sequential detection of Ag+ and I− in aqueous media, Luminescence, 2020, 35, 231–242 CrossRef CAS.
- Q. Jiang, Z. Wang, M. Li, J. Song, Y. Yang, X. Xu, H. Xu and S. Wang, A nopinone based multi-functional probe for colorimetric detection of Cu2+ and ratiometric detection of Ag+, Photochem. Photobiol. Sci., 2020, 19, 49–55 RSC.
- J. P. Nandre, S. R. Patil, S. K. Sahoo, C. P. Pradeep, A. Churakov, F. Yu, L. Chen, C. Redshaw, A. A. Patil and U. D. Patil, A chemosensor for micro- to nano-molar detection of Ag+ and Hg2+ ions in pure aqueous media and its applications in cell imaging, Dalton Trans., 2017, 46, 14201–14209 RSC.
- H. Yang, X. Liu, R. Fei and Y. Hu, Sensitive and selective detection of Ag+ in aqueous solutions using Fe3O4@Au nanoparticles as smart electrochemical nanosensors, Talanta, 2013, 116, 548–553 CrossRef CAS.
- L. Wang, C. Zhang, H. He, H. Zhu, W. Guo, S. Zhou, S. Wang, J. R. Zhao and J. Zhang, Cellulose-based colorimetric sensor with N, S sites for Ag+ detection, Int. J. Biol. Macromol., 2020, 163, 593–602 CrossRef CAS.
- M. Sahu, A. Kumar Manna, K. Rout, J. Mondal and G. K. Patra, A highly selective thiosemicarbazone based Schiff base chemosensor for colorimetric detection of Cu2+ and Ag+ ions and turn-on fluorometric detection of Ag+ ions, Inorg. Chim. Acta, 2020, 508, 119633 CrossRef CAS.
- L. Liu and H. Lin, Paper-based colorimetric array test strip for selective and semiquantitative multi-ion analysis: simultaneous detection of Hg2+, Ag+, and Cu2+, Anal. Chem., 2014, 86, 8829–8834 CrossRef CAS.
- H. Liu, X. Zhang, X. Wu, L. Jiang, C. Burda and J. J. Zhu, Rapid sonochemical synthesis of highly luminescent non-toxic AuNCs and Au@AgNCs and Cu (II) sensing, Chem. Commun., 2011, 47, 4237–4239 RSC.
- C.-C. Huang, H.-Y. Liao, Y.-C. Shiang, Z.-H. Lin, Z. Yang and H.-T. Chang, Synthesis of wavelength-tunable luminescent gold and gold/silver nanodots, J. Mater. Chem., 2009, 19, 755–759 RSC.
- H.-W. Li, Y. Yue, T.-Y. Liu, D. Li and Y. Wu, Fluorescence-enhanced sensing mechanism of BSA-protected small gold-nanoclusters to silver(I) ions in aqueous solutions, J. Phys. Chem. C, 2013, 117, 16159–16165 CrossRef CAS.
- P. Huang, S. Li, N. Gao and F. Wu, Toward selective, sensitive, and discriminative detection of Hg2+ and Cd2+ via pH-modulated surface chemistry of glutathione-capped gold nanoclusters, Analyst, 2015, 140, 7313–7321 RSC.
- E. Chow, D. B. Hibbert and J. J. Gooding, Voltammetric detection of cadmium ions at glutathione-modified gold electrodes, Analyst, 2005, 130, 831–837 RSC.
- F. Mo, Z. Ma, T. Wu, M. Liu, Y. Zhang, H. Li and S. Yao, Holey reduced graphene oxide inducing sensitivity enhanced detection nanoplatform for cadmium ions based on glutathione–gold nanocluster, Sens. Actuators, B, 2019, 281, 486–492 CrossRef CAS.
- S.-N. Ding and Y.-X. Guo, One-pot synthesis of dual-emitting BSA–Pt–Au bimetallic nanoclusters for fluorescence ratiometric detection of mercury ions and cysteine, Anal. Methods, 2015, 7, 5787–5793 RSC.
- P. Pyykko, Theoretical chemistry of gold, Angew. Chem., Int. Ed. Engl., 2004, 43, 4412–4456 CrossRef.
Footnote |
| † Electronic supplementary information (ESI) available. See DOI: 10.1039/d0ra05787h |
| This journal is © The Royal Society of Chemistry 2020 |

