DOI:
10.1039/D0RA05726F
(Paper)
RSC Adv., 2020,
10, 30806-30814
Gas-phase reaction mechanism in chemical dry etching using NF3 and remotely discharged NH3/N2 mixture†
Received
1st July 2020
, Accepted 28th July 2020
First published on 20th August 2020
Abstract
Modeling of dry etching processes requires a detailed understanding of the relevant reaction mechanisms. This study aims to elucidate the gas-phase mechanism of reactions in the chemical dry etching process of SiO2 layers which is initiated by mixing NF3 gas with the discharged flow of an NH3/N2 mixture in an etching chamber. A kinetic model describing the gas-phase reactions has been constructed based on the predictions of reaction channels and rate constants by quantum chemical and statistical reaction-rate calculations. The primary reaction pathway includes the reaction of NF3 with H atoms, NF3 + H → NF2 + HF, and subsequent reactions involving NF2 and other radicals. The reaction pathways were analyzed by kinetic simulation, and a simplified kinetic model composed of 12 reactions was developed. The surface process was also investigated based on preliminary quantum chemical calculations for ammonium fluoride clusters, which are considered to contribute to etching. The results indicate the presence of negatively charged fluorine atoms in the clusters, which are suggested to serve as etchants to remove SiO2 from the surface.
1. Introduction
Dry etching of materials is one of the key components in the fabrication of sophisticated semiconductor devices. Chemical dry etching utilizing remote plasma1–4 is a reliable and promising technique for damage-free etching and has mainly been applied to the removal of native oxides (SiO2) from silicon surfaces. The continuous scaling down of circuit dimensions requires narrower and deeper contact patterns, which are difficult to create with the conventional wet process. In this regard, dry processes are suitable for high-aspect ratio etching and have many other advantages, such as uniformity and selectivity, over wet cleaning processes.
The present study focuses on chemical dry etching using NF3 gas and remotely discharged mixture of NH3 and N2.2–4 Fig. 1 shows a schematic diagram of an equipment used in this process. The wafers are placed in a batch-type reactor and exposed to etchant gases produced by the gas-phase reactions. A mixture of NH3 and N2 gases is introduced into the chamber via an inlet port after passing through the microwave cavity where radical species are generated by the microwave discharge at 2.45 GHz. Pure NF3 gas supplied via the other inlet port reacts with the radicals in the chamber to generate etchant species. After etching, the wafer surface is covered by some deposited compounds, which are considered to be (NH4)2SiF6 and possibly contain ammonium fluorides.1,5 These residues are removed by heating the substrates in a post processing procedure.
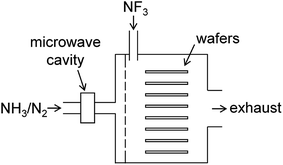 |
| | Fig. 1 Schematic diagram of the chemical dry etching apparatus. | |
The performance of the etching process, including the etching rate and selectivity, is highly dependent on the process parameters such as gas flow rates, pressure, and temperature; therefore, elucidation of the etching mechanism is warranted to understand the phenomena and have better control of the process conditions. However, the reaction mechanism of the etching process has yet to be understood. Based on their observations in etching experiments using NH3/NF3 downflow plasma, Nishino et al.1 proposed that negatively charged F atoms in ammonium fluorides preferentially attack Si atoms in SiO2 layers, leading to the substitution of the Si–O bond with the Si–F bond by a mechanism similar to the wet etching of SiO2 using a hydrogen fluoride solution. This mechanism presumes the formation of ammonium fluoride on the SiO2 surface, which would be generated from NH3 and HF adsorbed on the surface. Because HF is a product that should be formed in the gas-phase reactions of NF3 and hydrogen-containing species, obtaining a good understanding of the gas-phase reaction mechanism is an important first step to reveal the whole mechanism. Along with this line, Hayashi et al.5 reported the results of quantum chemical calculations of the NF3 + H and subsequent reactions, and suggested a potential reaction scheme for the formation of HF; however, the feasibility of the proposed reaction pathways has not yet been kinetically investigated.
In the present study, a kinetic model representing the gas-phase reactions in the chemical dry etching is constructed. The model is based on the reported reaction mechanism of the combustion of nitrogen-containing species,6–8 and the reaction pathways and rate constants for the primary reactions are updated or newly evaluated by quantum chemical calculations and statistical reaction rate theories. Because reactions occurring in the microwave discharge are difficult to quantitatively predict, the types of radicals produced from discharged NH3/N2 mixtures are deduced based on available literature data, as described later. Then, the reactions of the radicals with NF3 and potential subsequent reactions are investigated and implemented in the model. An example of a kinetic simulation using the constructed model is presented for a representative reaction condition. The results of the preliminary calculations of (NH3)n(HF)m clusters and their implications for the surface process are also presented.
2. Computational methods and conditions
Quantum chemical calculations were performed using the Gaussian 09 (ref. 9) and Molpro 2018.2 (ref. 10) programs. Geometries of stationary points (reactants, products, intermediates, and transition states) were optimized using density functional theory with the ωB97X-D hybrid functional11 and the split-valence 6-311++G(d,p) basis set. Numerical integration of the exchange-correlation potential was performed with an ultrafine grid as implemented in Gaussian 09, having 99 radial shells and 590 angular points per shell. Harmonic vibrational frequencies were also calculated at the same level of theory. The zero-point energy (ZPE) and vibrational frequencies were scaled by 0.975 and 0.950, respectively,12 to approximately account for anharmonic effects. Single-point energies at the optimized structures were refined by an explicitly correlated coupled cluster method, CCSD(T)-F12b,13–15 with correlation-consistent polarized valence triple-ζ basis sets optimized for explicitly correlated methods, cc-pVTZ-F12.16 The ZPE-corrected ground-state energies are reported. For open-shell species, the spin unrestricted and restricted methods were used in the ωB97X-D and CCSD(T)-F12b calculations, respectively.
The rate constants were calculated by transition state theory based on the calculated energies and rovibrational properties using rigid-rotor and harmonic-oscillator approximations. The tunneling corrections were applied using one-dimensional approximation by assuming an asymmetric Eckart potential determined from the imaginary frequencies of the transition states.17 Some of the studied reactions involved chemically-activated intermediates, and the rate constants for these reactions were calculated by solving master equation18,19 using the SSUMES program.20
The rate constant calculations were performed for reactions involving H, NH2, NH, and N radicals, which are assumed to be produced from the microwave discharge of NH3/N2 mixture as follows. The etching rate is significantly reduced if pure NH3 gas, instead of the NH3/N2 mixture, is used for the radical source; this indicates that activated nitrogen is primarily responsible for the generation of radicals. There have been a number of studies on “active nitrogen”21–24 and its reactivity toward NH3 is considered to be dominated by the reaction of 3N2 + NH3,23,24 where 3N2 represents the A3Σu+ state of N2. This reaction has been studied by several researchers,25–28 and found to proceed dominantly with the following two channels:
| | |
3N2 + NH3 → N2 + NH2 + H
| (R1a) |
| | |
3N2 + NH3 → N2 + NH + H2
| (R1b) |
with a total rate constant of ∼10
−10 cm
3 per molecule per s and a branching fraction of ∼0.9 for the former channel. Under typical operation conditions, the partial pressure of NH
3 in the discharged flow is ∼100 Pa, and, therefore,
3N
2 formed in the discharge rapidly reacts with NH
3 on a microsecond timescale, which is much shorter than the radiative lifetime of
3N
2.
29 Atomic nitrogen, N(
4S), can also be formed in the discharge, but is not reactive with NH
3 and can survive for a long time before entering the chamber. Therefore, the radicals produced in these reactions, H, NH
2, NH, and N, are considered to contribute to the gas-phase reactions in the chamber.
Based on the rate constant calculations, a kinetic model was constructed and used to perform a kinetic simulation to investigate the gas-phase reaction mechanism in the chamber. For simplicity, the simulation was performed for a homogeneous (zero-dimensional) and constant-pressure reactor using the Cantera program.30 The simulation condition was selected to roughly correspond to typical operation conditions of the etching process. The total pressure, p, was set to ≈200 Pa, consisting of 50 Pa of NF3, 100 Pa of N2, 50 Pa of NH3, and small amounts of the radicals. The gas temperature, T, in the chamber is nonuniform and considered to be higher near the inlet port because of the microwave discharge. However, because of a lack of detailed information on the temperature distribution, it was assumed to be constant at 350 K in the present simulation. The reaction duration was set to be close to the gas residence time in the chamber, ∼1 s.
The initial concentrations of the radicals are difficult to evaluate and are rather crudely estimated here as follows. The preliminary mass spectrometric analysis of gases in the etching chamber showed that the gas composition was dominated by the three reactants (NF3, N2, and NH3) and that signals from potential reaction products were difficult to quantify but were roughly two orders of magnitude smaller than those of the reactants. This indicates that only a few percent of the NH3/N2 mixture was converted to the radicals introduced into the chamber. Based on this assumption and the reported branching fractions of (R1a) and (R1b), the initial partial pressures of the H, NH2, and NH radicals in the chamber were set to be 1, 1, and 0.1 Pa, respectively. The formation of N atoms in the discharge is considered to be relatively minor compared to 3N2 because the dissociation asymptote of N(4S) + N(4S) lies ≈340 kJ mol−1 (3.54 eV) higher than the A3Σu+ state of N2. If the electron-impact cross sections have similar values for the two excitation channels, the branching ratio for the N atoms can be estimated to be ∼exp(−3.54/Te), where Te is the electron temperature. Here, a branching ratio of ∼0.1 was assumed and the initial partial pressure of N atoms was assumed to be 0.1 Pa.
For the calculations of (NH3)n(HF)m clusters, the structures and frequencies were calculated using the same method as above, ωB97X-D/6-311++G(d,p), but the coupled cluster calculations with the triple-ζ basis sets were not affordable for large clusters; therefore, the energies of the clusters were calculated using the CBS-QB3//ωB97X-D method.12,31 The thermodynamic properties of the clusters were calculated using rigid-rotor and harmonic-oscillator approximations.
3. Results and discussion
3.1 Reaction pathways and rate constants
The reaction of NF3 with H atoms proceeds with the following two channels:The energy diagram and the transition state structures are shown in Fig. 2. The fluorine abstraction channel (R2a) has a barrier height of 62 kJ mol−1, which is 11 kJ mol−1 lower than that of the F/H substitution channel (R2b). The rate constants, k, calculated for these two channels are shown in Fig. 3. As expected from the difference in the barrier heights, the abstraction channel has significantly larger rate constants than those of the substitution channel. The rate constants for (R2a) are 2.4 × 10⁻²⁰ and 3.7 × 10⁻¹⁹ cm3 per molecule per s at temperatures of 300 and 350 K, respectively, whereas those for (R2b) are a factor of ≈30 smaller at these temperatures.
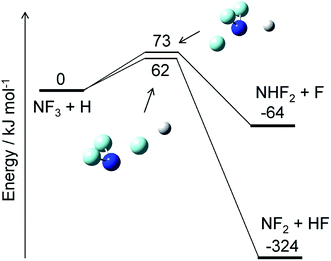 |
| | Fig. 2 Energy diagram for the NF3 + H reaction and the structures of the transition states. The ZPE-corrected ground-state energies relative to the reactants are shown. | |
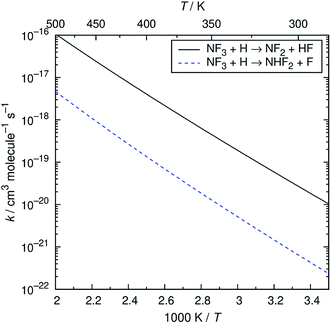 |
| | Fig. 3 Arrhenius plot of the calculated rate constants for the NF3 + H reaction. | |
The reactions of NF3 with the other three radicals (NH2, NH, and N) also proceed with the fluorine abstraction and substitution mechanisms. The calculated barrier heights, reaction energies, and rate constants at 350 K are summarized in Table 1. The barrier heights for these radicals are all higher than 100 kJ mol−1, which results in rate constants that are many orders of magnitude smaller than those for H atoms. The rate constants on the order of 10−29 cm3 per molecule per s or less hardly compete with the reaction of NF3 with H atoms under typical conditions of the etching chamber; therefore, the reactions of NF3 with NH2, NH, and N are not implemented in the kinetic model presented later.
Table 1 Calculated barrier heights (ΔETS), reaction energies (ΔE), and rate constants at 350 K for the NF3 + X (X = H, NH2, NH, and N), NHF2 + H, and NH2F + H reactions
| Reactants |
Products |
ΔETS/kJ mol−1 |
ΔE/kJ mol−1 |
k (350 K)/cm3 per molecule per s |
| NF3 + H |
NF2 + HF |
62 |
−324 |
3.7 × 10⁻¹⁹ |
| NF3 + H |
NHF2 + F |
73 |
−64 |
9.5 × 10⁻²¹ |
| NF3 + NH2 |
NF2 + NH2F |
119 |
−43 |
3.2 × 10⁻²⁹ |
| NF3 + NH2 |
NF2NH2 + F |
105 |
36 |
4.5 × 10⁻²⁹ |
| NF3 + NH |
NF2 + NHF |
130 |
−53 |
4.3 × 10⁻³¹ |
| NF3 + NH |
NF2NH + F |
129 |
18 |
5.2 × 10⁻³² |
| NF3 + N |
NF2 + NF |
138 |
−70 |
8.0 × 10⁻³² |
| NF3 + N |
NF2N + F |
167 |
−122 |
4.4 × 10−36 |
| NHF2 + H |
NHF + HF |
64 |
−294 |
1.6 × 10⁻¹⁹ |
| NHF2 + H |
NH2F + F |
45 |
−102 |
3.2 × 10⁻¹⁷ |
| NHF2 + H |
NF2 + H2 |
17 |
−125 |
2.6 × 10⁻¹³ |
| NH2F + H |
NH2 + HF |
58 |
−281 |
5.8 × 10⁻¹⁹ |
| NH2F + H |
NH3 + F |
17 |
−157 |
1.1 × 10⁻¹³ |
| NH2F + H |
NHF + H2 |
35 |
−58 |
3.5 × 10⁻¹⁵ |
The initial reaction taking place in the etching chamber is considered to be NF3 + H, which produces NF2, HF, NHF2, and F. The F atoms rapidly react with NH3 in the chamber with the hydrogen abstraction mechanism as:
with the rate constants on the order of 10
−11 cm
3 per molecule per s.
32 Subsequent reactions of the other products, NHF
2 and NF
2, and their hydrogen-substituted products, NH
2F and NHF, are investigated below.
The reactions of NHF2 and NH2F with H atoms each have three reaction channels—fluorine abstraction, F/H substitution, and hydrogen abstraction:
| | |
NHF2 + H → NHF + HF
| (R4a) |
| | |
NHF2 + H → NH2F + F
| (R4b) |
| | |
NHF2 + H → NF2 + H2
| (R4c) |
| | |
NH2F + H → NH2 + HF
| (R5a) |
| | |
NH2F + H → NHF + H2
| (R5c) |
The barrier heights and reaction energies for these channels are listed in
Table 1. The NHF
2 + H reaction dominantly occurs with the hydrogen abstraction channel
(R4c), with a calculated barrier height of 17 kJ mol
−1 and rate constant of 2.6 × 10
−13 cm
3 per molecule per s at 350 K. The other two channels have rate constants that are several orders of magnitude smaller due to their higher barrier heights. In contrast, the reaction of NH
2F with H atoms is dominated by the substitution channel
(R5b), with a barrier height (17 kJ mol
−1) and rate constant (1.1 × 10
−13 cm
3 per molecule per s at 350 K) comparable with those of
(R4c). The hydrogen abstraction channel is less favorable for the NH
2F + H reaction; its rate constant is more than an order of magnitude smaller than that for the substitution channel. The different preferences of the reaction channels in the NHF
2 + H and NH
2F + H reactions might be explained by the large electronegativity of fluorine atoms, which makes the NF
2 radicals relatively stable compared to the NH
2 and NHF radicals.
The energy diagrams for the NF2 + H and NHF + H reactions are shown in Fig. 4. Both reactions have fluorine abstraction and recombination pathways. The fluorine abstractions occur on triplet potential energy surfaces and produce triplet species, NF and NH. Their high barrier heights give small rate constants, ∼10−21 cm3 per molecule per s at 350 K, for the fluorine abstraction channels. On the other hand, the recombination channels have barrierless potential energy surfaces for the association of the radicals. The formed NHF2 and NH2F molecules are chemically activated and either stabilize by collisions with third-body molecules or dissociate to fragments. Both NHF2 and NH2F intermediates have two dissociation channels: barrierless N–F bond fission and concerted HF elimination. The dissociation channels lie lower in energy than the reactants; therefore, the activated intermediates are expected to directly dissociate to the fragments. For the master equation calculations, the microscopic rate constants for the barrierless channels were calculated using the inverse Laplace transform19 of the high-pressure limiting rate constants. The rate constants for NF2 + H and NHF + F were reported to be ∼4 × 10⁻¹¹ and ∼2 × 10⁻¹⁰ cm3 per molecule per s, respectively.33,34 These values are assumed to be in the high-pressure limits. The same values are also used for the NHF + H and NH2 + F reactions, respectively. The microscopic rate constants for the dissociation channels were calculated from these values and the calculated equilibrium constants. For the collisional energy transfer processes, several models of collision frequency and energy transfer were tested, but the resultant rate constants were found to be insensitive to the models and their parameters at the pressure of 200 Pa. Therefore, the Lennard-Jones collision frequencies and the exponential down model18 were employed here, with the Lennard-Jones parameters of σ = 4 Å and ε = 200 cm−1 and the energy transfer parameter of 〈ΔEdown〉 = 0.6 (T/K) cm−1. The calculated rate constants showed the dominance of the N–F bond fission and HF elimination channels:
with the branching fractions of 0.78 and 0.22 for
(R6a) and
(R6b), respectively, and 0.998 and 0.002 for
(R7a) and
(R7b), respectively. These results suggest that NF
2 radicals produced in the initial reaction
(R2a) mainly produce NHF radicals by
(R6a), which subsequently yield NH
2 radicals by
(R7a). The F atoms generated in each reaction are consumed by the reaction
(R3). The
1NF produced in the minor channel,
(R6b), may react with NH
3; analogously to the
1NH + NH
3 reaction,
35 the following reaction
| | |
1NF + NH3 → NHF + NH2
| (R8) |
was assumed to occur with the rate constant of 1.5 × 10
−10 cm
3 per molecule per s.
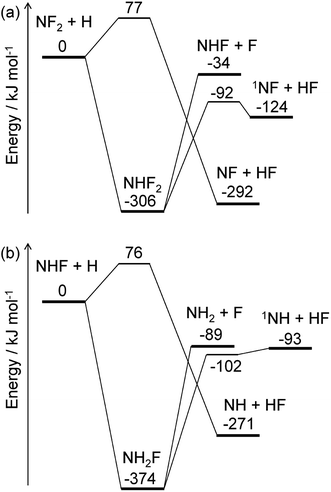 |
| | Fig. 4 Energy diagrams for the (a) NF2 + H and (b) NHF + H reactions. The ZPE-corrected ground-state energies relative to the reactants are shown. | |
3.2 Kinetic simulation and reaction pathways
The kinetic model describing the gas-phase reactions has been constructed based on the rate constants described above and other reactions implemented in kinetic models for combustion of nitrogen-containing species.6–8 The calculated rate constants were represented by the modified Arrhenius expression, the parameters of which were determined by least-squares fittings over the temperature range of 250–1000 K. The reactions involving H and N elements were adopted from the models of Coppens et al.6 and Glarborg et al.;7 although their models were developed to model NOx formation and NH3 oxidation in combustion, they have detailed descriptions of the reactions of nitrogen hydrides that are applicable to the present purpose. The reactions involving fluorine and nitrogen fluorides were taken from the model developed for H2/NF3 flames.8 The constructed model consists of 25 species and 131 reactions and is available in the ESI.†
An example of the simulated profiles of major intermediates and products is shown in Fig. 5 as a function of time (t). The kinetic simulation was performed for the representative operation condition previously mentioned. The concentrations of the supplied gases (NF3, NH3, and N2) were virtually unchanged from the initial condition and, therefore, are not plotted here. The radical species produced from the discharge rapidly reacted during the early stage of the simulation, and their temporal profiles became nearly steady within the first 150 ms. After that, there were slight gradual decreases of the radical concentrations accompanied by the formation of HF. The partial pressures of H atoms and HF were about 1 and 0.02 Pa at t = 1 s. These species, as well as NH3, are considered to contribute to etching, as discussed later.
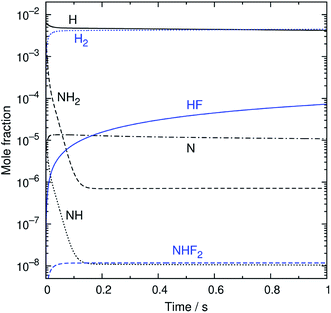 |
| | Fig. 5 The simulated time profiles of the major reaction intermediates and products. | |
The reaction pathways were analyzed by the mass flux analysis.36 The major reaction pathways are schematically depicted in Fig. 6. At the early stage, NH2, NH, and N radicals are consumed by the following reactions to generate H2 and N2:
This sequence of reactions can be viewed as the H-atom catalyzed conversion of 2NH
2 into 2H
2 + N
2, in which the H atoms are consumed by the reactions with NH
2 and NH but are generated by the N + NH
2 reaction, resulting in a steady H-atom concentration. The other reactions contributing to the radical concentration profiles include the formation of NH
3 and N
2H
4 by the recombination reactions of NH
2 + H
(R12) and NH
2 + NH
2 (R13), respectively, the formation of N
2H
2 from the reaction between NH
2 and NH
(R14), and the reactions of N
2H
x (
x = 2–4) species that finally results in the formation of N
2 (R15)–(R18):
| | |
NH2 + H + M → NH3 + M
| (R12) |
| | |
NH2 + NH2 + M → N2H4 + M
| (R13) |
| | |
NH2 + NH → N2H2 + H
| (R14) |
| | |
N2H4 + H → N2H3 + H2
| (R15) |
| | |
N2H3 + NH2 → H2NN + NH3
| (R16) |
| | |
H2NN + H → N2H2 + H
| (R17) |
| | |
N2H2 + H → N2 + H2 + H
| (R18) |
where M represents third-body molecules.
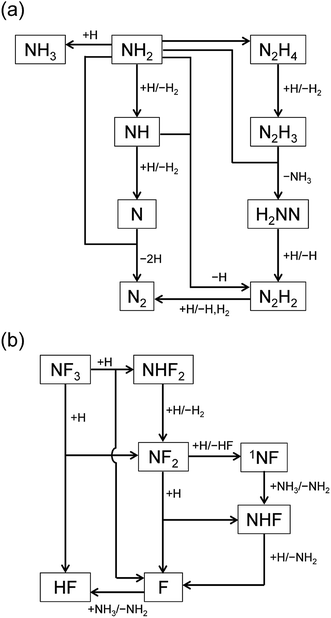 |
| | Fig. 6 Schematic diagrams of the major reaction pathways at (a) t = 1 ms and (b) t = 1 s. | |
The reaction pathways involving fluorine-containing species are illustrated in Fig. 6(b). The reaction sequence is initiated by the NF3 + H reaction, which dominantly generates NF2 radicals and HF. As a minor product, NHF2 can also be formed in a small amount, but is readily converted to NF2 radicals by the H abstraction reaction (R4c). The NF2 radicals have two channels in their reactions with H atoms, (R6a) and (R6b), producing NHF + F and 1NF + HF, respectively. The 1NF radicals generated in the latter channel produce NHF radicals by their reaction with NH3 (R8); therefore, the two channels in the NF2 + H reaction practically lead to the same products. The NHF radicals then react with H atoms to form NH2 + F, and F atoms produced in this and other reactions generate HF via their reaction with NH3 (R3).
The overall reaction process may be roughly represented as NF3 + 2NH3 + 3H → 3NH2 + 3HF. If the conversion of NH2 is also considered, this translates into NF3 + 2NH3 + 3H → (3/2)N2 + 3H2 + 3HF. The rate-limiting step is the initial reaction of NF3 with H atoms, but the secondary and side reactions also contribute to the temporal behavior of the reaction intermediates and products. The simulated time profiles, except for the early behavior of the NH2 and NH radicals, can be approximately described by a simplified model composed of 12 reactions listed in Table 2 (also available in the ESI†). This simplified model should be useful for more realistic and detailed simulations of the etching process, which include fluid dynamics and surface reactions.
Table 2 Reactions and their rate constantsa of the simplified kinetic model
| Reaction |
Ab |
n |
Ea/Rc |
Reference |
| Parameters for the modified Arrhenius expression, k = A (T/K)n exp(−Ea/RT), are given. In units of cm3 per molecule per s and cm6 per molecule2 per s for bimolecular and termolecular reactions, respectively. In units of K. |
| NF3 + H ⇄ NF2 + HF |
5.0 × 10⁻²⁷ |
5.188 |
4228 |
This work |
| NF3 + H ⇄ NHF2 + F |
1.1 × 10⁻³² |
6.735 |
4090 |
This work |
| NHF2 + H ⇄ NF2 + H2 |
2.8 × 10⁻¹⁹ |
2.628 |
563.9 |
This work |
| NF2 + H ⇄ NHF + F |
1.3 × 10⁻¹¹ |
0.132 |
−34.8 |
This work |
| NF2 + H ⇄ 1NF + HF |
5.4 × 10⁻¹⁰ |
−0.616 |
177.5 |
This work |
| 1NF + NH3 ⇄ NHF + NH2 |
1.5 × 10⁻¹⁰ |
0 |
0 |
See text |
| NHF + H ⇄ NH2 + F |
4.0 × 10⁻¹¹ |
0 |
0.05 |
This work |
| NH3 + F ⇄ NH2 + HF |
2.5 × 10⁻¹⁰ |
0 |
650.2 |
32 |
| NH + H2 ⇄ NH2 + H |
3.5 × 10⁻¹¹ |
0 |
7758 |
7 |
| NH + H ⇄ N + H2 |
5.3 × 10⁻¹¹ |
0 |
163.5 |
6 |
| NH2 + N ⇄ N2 + H + H |
1.1 × 10⁻¹⁰ |
0 |
0 |
6 |
| H + H + M ⇄ H2 + M |
1.5 × 10⁻²⁹ |
−1.3 |
0 |
6 |
3.3 Implication to surface process
Modeling of the surface reactions will be an important next step for understanding and simulating the etching process. Although the present study primarily focuses on the gas-phase processes, some implications derived from preliminary calculations of ammonium fluoride clusters, (NH3)n(HF)m, which have been suggested to contribute to the etching of SiO2 layers,1 are presented here.
The structures and energies of the (NH3)n(HF)m clusters with m = 1 and n = 1–7, 11, and 13, as well as n = m = 1–6, were calculated. The calculated structures are shown in the ESI,† and a few representative ones, (n, m) = (1, 1), (6, 1), and (4, 4), are shown in Fig. 7. For each composition, the presented structure corresponds to the isomer that had the lowest potential energy among several local minima calculated at the CBS-QB3//ωB97X-D level of theory. Since the relative energies for the isomers of large clusters are expected to sensitively depend on the computational method used, these structures may not necessarily be those of the most stable isomers. The small clusters of (n, m) = (1, 1), (2, 1), (3, 1), and (2, 2) are formed by the dipole–dipole interaction between the NH3 and HF molecules. The calculated H–F bond lengths are shorter than 1 Å for the small clusters but increase as the cluster size becomes larger. For example, the (NH3)6(HF) cluster shown in Fig. 7(b) has an H–F bond length of 1.39 Å, and the H atom is placed rather close to the adjacent NH3 molecule, with a N–H bond length of 1.11 Å. The Mulliken charge of the F atom was calculated to be −0.72 at the MP2/CBSB3 level, clearly indicating the ionic nature and that the cluster should rather be denoted as (NH3)5(NH4+)(F−). Similarly, the cluster shown in Fig. 7(c) has the structure that can be represented as (NH4+)4(F−)4. The ionic nature is more pronounced in larger clusters; for example, the H–F bond lengths in the (n, m) = (11, 1), (15, 1), (4, 4), (5, 5), and (6, 6) clusters are in the range 1.59–1.68 Å.
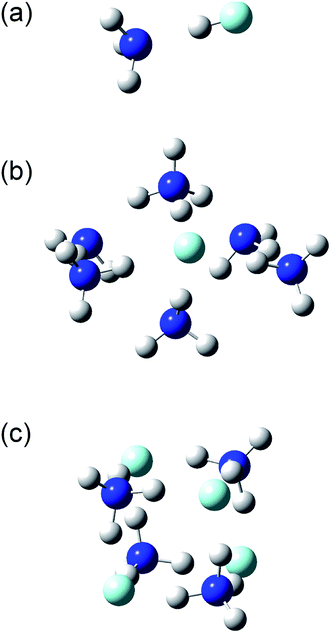 |
| | Fig. 7 Structures of the (a) (NH3)(HF), (b) (NH3)6(HF), and (c) (NH3)4(HF)4 clusters. | |
Thermodynamic quantities of the clusters were calculated using the CBS-QB3//ωB97X-D method. Table 3 lists the calculated enthalpy (ΔH°), entropy (ΔS°), and Gibbs energy (ΔG°) changes in the (NH3)n(HF)m cluster formation from isolated molecules, nNH3 + mHF, at the standard state (298 K, 1 bar). For the (NH3)n(HF) clusters, the standard enthalpy and entropy changes decrease by approximately 25 kJ mol−1 and 120 J K−1 mol−1, respectively, for each increment of n, which results in a monotonic increase of the standard Gibbs energy change as the cluster size increases. Although the rigid-rotor and harmonic-oscillator approximations possibly underestimate the entropies of large clusters, the magnitude of the entropy loss is considered reasonable because it is comparable with the reduction of the translational entropy in solvation.37 The entropies of the (NH3)n(HF)n clusters show a similar trend with respect to the cluster size, but their enthalpies have a steeper dependence on the cluster size than those of the (NH3)n(HF) clusters. As a result, the standard Gibbs energy changes in the formation of the (NH3)n(HF)n clusters decrease as the cluster size increases. This indicates homogeneous nucleation of ammonium fluoride clusters under the standard state condition. On the other hand, the Gibbs energy changes at 200 Pa listed in Table 3 all have positive values and become increasingly larger for larger clusters; therefore, no cluster formation is expected in the gas phase under typical operation conditions of the etching process.
Table 3 Calculated enthalpies, entropies, and Gibbs energies of the (NH3)n(HF)m clusters relative to nNH3 + mHF
| n, m |
ΔH (298 K)/kJ mol−1 |
ΔS (298 K)/J K−1 mol−1 |
ΔG (298 K)/kJ mol−1 |
ΔG (298 K, 200 Pa)/kJ mol−1 |
ΔG (350 K, 200 Pa)/kJ mol−1 |
| 1, 1 |
−46 |
−112 |
−12 |
3 |
12 |
| 2, 1 |
−69 |
−219 |
−3 |
28 |
44 |
| 3, 1 |
−95 |
−342 |
7 |
43 |
79 |
| 4, 1 |
−115 |
−447 |
19 |
80 |
114 |
| 5, 1 |
−134 |
−597 |
44 |
121 |
165 |
| 6, 1 |
−158 |
−743 |
64 |
156 |
211 |
| 7, 1 |
−193 |
−856 |
62 |
170 |
233 |
| 11, 1 |
−290 |
−1407 |
129 |
299 |
401 |
| 15, 1 |
−369 |
−1912 |
201 |
432 |
571 |
| 2, 2 |
−137 |
−361 |
−29 |
17 |
44 |
| 3, 3 |
−218 |
−631 |
−30 |
47 |
93 |
| 4, 4 |
−345 |
−1002 |
−46 |
62 |
133 |
| 5, 5 |
−448 |
−1230 |
−81 |
57 |
145 |
| 6, 6 |
−567 |
−1555 |
−104 |
66 |
176 |
Alternatively, ammonium fluoride clusters can potentially be formed on SiO2 surfaces because of the electrostatic interaction between them. The polar NH3 and HF molecules adsorbed onto the surface can interact with each other as well as with the partially charged O and Si atoms in the SiO2 layer. The existence of the SiO2 surface should facilitate cluster formation and charge separation in the cluster. Then, the negatively charged F atoms in the cluster can attack the positively charged Si atoms in the SiO2 layer and break a Si–O bond by a nucleophilic substitution reaction. A crude example of this reaction is shown in Fig. 8, where F− and SiH3OSiH3 (disiloxane) serve as prototypes of negatively charged F atoms in the cluster and a Si–O bond, respectively. The nucleophilic substitution is exothermic and can proceed without any energy barrier. A similar mechanism is expected to take place between the ammonium fluoride clusters and the SiO2 surface; a negatively charged F atom in the cluster substitutes the Si–O–Si structure in the SiO2 layer with a Si–F bond, leaving a Si–O site on the surface. Hydrogen atoms can attach to the Si–O site to form a hydroxy group, Si–OH, which can further react with the F and H atoms to produce another Si–F bond and H2O. This cycle can be repeated as long as the F and H atoms are supplied to destruct the SiO2 layers. The volatile products, such as H2O and SiF4, are removed from the surface, but some silicon fluoride products remain on the surface to form (NH4)2SiF6.1,5 Modeling of these processes requires elucidation of the thermodynamics and kinetics of adsorption, desorption, and reactions on the surface.
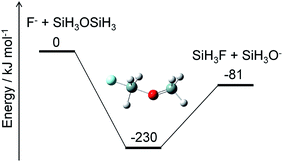 |
| | Fig. 8 Energy diagram for a prototype etching reaction and structure of the intermediate. The ZPE-corrected ground-state energies relative to the reactants are shown. | |
4. Conclusion
To summarize the results of the rate constant calculations and kinetic simulation, the following reactions are found to primarily contribute to the gas-phase process in the etching chamber:| | |
1NF + NH3 → NHF + NH2
| (R8) |
where the NF3 + H reaction (R2a) is the rate-limiting step. The whole reactions may be summarized by the overall reaction NF3 + 2NH3 + 3H → (3/2)N2 + 3H2 + 3HF. Detailed and simplified reaction models were constructed that can be used to predict the species concentrations and spatial distribution in the chamber when combined with fluid dynamics calculations. Future studies in this line would include investigation of the spatial uniformity of the etching rate and its dependence on process parameters.
The preliminary calculation of the ammonium fluoride clusters suggested the formation of negatively charged F atoms in the cluster, which can destruct the SiO2 layer by successive nucleophilic substitution reactions. Therefore, the etching process is suggested to comprise the following steps: generation of etchant species from the gas-phase reactions, adsorption (cluster formation) and desorption of the etchant species on the surface, and surface reactions by the negatively charged F atoms.
Conflicts of interest
This study is supported by ULVAC, Inc.
References
- H. Nishino, N. Hayasaka and H. Okano, J. Appl. Phys., 1993, 74, 1345–1348 CrossRef CAS.
- W.-S. Kim, W. G. Hwang, I.-K. Kim, K.-Y. Yun, K. M. Lee and S.-K. Chae, Solid State Phenom., 2005, 103–104, 63–66 CAS.
- K. Ishikawa, R. Fukaya, H. Inoue and H. Kurihara, WO Pat., 002393, 2012.
- H. Inoue, Y. Higuchi, M. Ishikawa and H. Kurihara, WO Pat., 108321, 2012.
- T. Hayashi, K. Ishikawa, M. Sekine, M. Hori, A. Kono and K. Suu, Jpn. J. Appl. Phys., 2011, 51, 016201 Search PubMed.
- F. H. V. Coppens, J. De Ruyck and A. A. Konnov, Combust. Flame, 2007, 149, 409–417 CrossRef CAS.
- P. Glarborg, J. A. Miller, B. Ruscic and S. J. Klippenstein, Prog. Energy Combust. Sci., 2018, 67, 31–68 CrossRef.
- A. Matsugi, H. Shiina, A. Takahashi, K. Tsuchiya and A. Miyoshi, Combust. Flame, 2014, 161, 1425–1431 CrossRef CAS.
- M. J. Frisch, G. W. Trucks, H. B. Schlegel, G. E. Scuseria, M. A. Robb, J. R. Cheeseman, G. Scalmani, V. Barone, B. Mennucci, G. A. Petersson, H. Nakatsuji, M. Caricato, X. Li, H. P. Hratchian, A. F. Izmaylov, J. Bloino, G. Zheng, J. L. Sonnenberg, M. Hada, M. Ehara, K. Toyota, R. Fukuda, J. Hasegawa, M. Ishida, T. Nakajima, Y. Honda, O. Kitao, H. Nakai, T. Vreven, J. A. Montgomery Jr, J. E. Peralta, F. Ogliaro, M. Bearpark, J. J. Heyd, E. Brothers, K. N. Kudin, V. N. Staroverov, T. Keith, R. Kobayashi, J. Normand, K. Raghavachari, A. Rendell, J. C. Burant, S. S. Iyengar, J. Tomasi, M. Cossi, N. Rega, J. M. Millam, M. Klene, J. E. Knox, J. B. Cross, V. Bakken, C. Adamo, J. Jaramillo, R. Gomperts, R. E. Stratmann, O. Yazyev, A. J. Austin, R. Cammi, C. Pomelli, J. W. Ochterski, R. L. Martin, K. Morokuma, V. G. Zakrzewski, G. A. Voth, P. Salvador, J. J. Dannenberg, S. Dapprich, A. D. Daniels, O. Farkas, J. B. Foresman, J. V. Ortiz, J. Cioslowski and D. J. Fox, Gaussian 09, Revision C.01, Gaussian, Inc., Wallingford CT, 2010 Search PubMed.
- H.-J. Werner, P. J. Knowles, G. Knizia, F. R. Manby, M. Schütz, P. Celani, W. Györffy, D. Kats, T. Korona, R. Lindh, A. Mitrushenkov, G. Rauhut, K. R. Shamasundar, T. B. Adler, R. D. Amos, S. J. Bennie, A. Bernhardsson, A. Berning, D. L. Cooper, M. J. O. Deegan, A. J. Dobbyn, F. Eckert, E. Goll, C. Hampel, A. Hesselmann, G. Hetzer, T. Hrenar, G. Jansen, C. Köppl, S. J. R. Lee, Y. Liu, A. W. Lloyd, Q. Ma, R. A. Mata, A. J. May, S. J. McNicholas, W. Meyer, T. F. Miller III, M. E. Mura, A. Nicklass, D. P. O'Neill, P. Palmieri, D. Peng, K. Pflüger, R. Pitzer, M. Reiher, T. Shiozaki, H. Stoll, A. J. Stone, R. Tarroni, T. Thorsteinsson, M. Wang and M. Welborn, MOLPRO, version 2018.2, Cardiff, 2018 Search PubMed.
- J.-D. Chai and M. Head-Gordon, Phys. Chem. Chem. Phys., 2008, 10, 6615–6620 RSC.
- A. Matsugi and H. Shiina, Bull. Chem. Soc. Jpn., 2014, 87, 890–901 CrossRef CAS.
- C. Hampel, K. A. Peterson and H. J. Werner, Chem. Phys. Lett., 1992, 190, 1–12 CrossRef CAS.
- T. B. Adler, G. Knizia and H.-J. Werner, J. Chem. Phys., 2007, 127, 221106 CrossRef PubMed.
- G. Knizia, T. B. Adler and H.-J. Werner, J. Chem. Phys., 2009, 130, 054104 CrossRef PubMed.
- K. A. Peterson, T. B. Adler and H.-J. Werner, J. Chem. Phys., 2008, 128, 084102 CrossRef PubMed.
- B. C. Garrett and D. G. Truhlar, J. Phys. Chem., 1979, 83, 2921–2926 CrossRef CAS.
- R. G. Gilbert and S. C. Smith, Theory of Unimolecular and Recombination Reactions, Blackwell, Oxford, U.K., 1990 Search PubMed.
- W. Forst, Unimolecular Reactions: A Concise Introduction, Cambridge University Press, Cambridge, 2003 Search PubMed.
- A. Miyoshi, SSUMES program, revision 2014.05.20m1, 2014 Search PubMed.
- A. N. Wright and C. A. Winkler, Active Nitrogen, Academic Press, New York, 1968 Search PubMed.
- A. N. Wright, R. L. Nelson and C. A. Winkler, Can. J. Chem., 1962, 40, 1082–1097 CrossRef CAS.
- R. A. Back and D. R. Salahub, Can. J. Chem., 1967, 45, 851–854 CrossRef CAS.
- R. Brown and C. A. Winkler, Angew. Chem., Int. Ed., 1970, 9, 181–196 CrossRef CAS.
- M. F. Golde and A. M. Moyle, Chem. Phys. Lett., 1985, 117, 375–380 CrossRef CAS.
- W. Tao, M. F. Golde, G. H. Ho and A. M. Moyle, J. Chem. Phys., 1987, 87, 1045–1053 CrossRef CAS.
- W. Hack, H. Kurzke, C. Ottinger and H. G. Wagner, Chem. Phys., 1988, 126, 111–124 CrossRef CAS.
- J. T. Herron, J. Phys. Chem. Ref. Data, 1999, 28, 1453–1483 CrossRef CAS.
- O. Dutuit, N. Carrasco, R. Thissen, V. Vuitton, C. Alcaraz, P. Pernot, N. Balucani, P. Casavecchia, A. Canosa, S. L. Picard, J.-C. Loison, Z. Herman, J. Zabka, D. Ascenzi, P. Tosi, P. Franceschi, S. D. Price and P. Lavvas, Astrophys. J., Suppl. Ser., 2013, 204, 20 CrossRef.
- D. G. Goodwin, H. K. Moffat and R. L. Speth, Cantera: An Object Oriented Software Toolkit for Chemical Kinetics, Thermodynamics, and Transport Processes, version 2.1.1, Caltech, Pasadena, CA, 2014 Search PubMed.
- J. A. Montgomery Jr, M. J. Frisch, J. W. Ochterski and G. A. Petersson, J. Chem. Phys., 1999, 110, 2822–2827 CrossRef.
- C.-D. Walther and H. G. Wagner, Ber. Bunsenges. Phys. Chem., 1983, 87, 403–409 CrossRef CAS.
- V. B. Rozenshtein, Y. R. Bedzhanyan and Y. M. Gershenzon, Kinet. Catal., 1988, 29, 22–29 Search PubMed.
- K. B. Hewett and D. W. Setser, J. Phys. Chem. A, 1997, 101, 9125–9131 CrossRef CAS.
- L. Adam, W. Hack and M. Olzmann, Z. Phys. Chem., 2005, 219, 197–211 CrossRef CAS.
- A. Matsugi and A. Miyoshi, Proc. Combust. Inst., 2013, 34, 269–277 CrossRef CAS.
- Y.-I. Izato, A. Matsugi, M. Koshi and A. Miyake, Phys. Chem. Chem. Phys., 2019, 21, 18920–18929 RSC.
Footnote |
| † Electronic supplementary information (ESI) available. See DOI: 10.1039/d0ra05726f |
|
| This journal is © The Royal Society of Chemistry 2020 |
Click here to see how this site uses Cookies. View our privacy policy here.  Open Access Article
 *a,
Shiro Kubotaa,
Yuichi Funatob,
Yutaka Miurab and
Kazuhiko Tonaric


