 Open Access Article
Synthesis of MOFs/GO composite for corrosion resistance application on carbon steel†
Wenchang Weia,
Zheng Liu*a,
Runzhi Weia,
Guo-Cheng Han *b and
Chuxin Lianga
aCollege of Chemical and Biological Engineering, Guilin University of Technology, Guangxi Key Laboratory of Electrochemical and Magneto-chemical Functional Materials, Guilin 541004, P.R. China. E-mail: lisa4.6@163.com
bSchool of Life and Environmental Sciences, Guilin University of Electronic Technology, Guilin, 541004, P.R. China. E-mail: hangc81@guet.edu.cn
First published on 13th August 2020
Abstract
Two unreported metal–organic frameworks [Cu(6-Me-2,3-pydc)(1,10-phen)·7H2O]n (namely Cu-MOF) and [Mn2(2,2′-bca)2(H2O)2]n (namely Mn-MOF) were synthesized by a solvothermal method and their structures were characterized and confirmed by elemental analysis, X-ray single crystal diffraction, Fourier infrared spectroscopy and thermogravimetric analysis. Cu-MOF/graphene (Cu-MOF/GR), Cu-MOF/graphene oxide (Cu-MOF/GO), Mn-MOF/graphene (Mn-MOF/GR) and Mn-MOF/graphene oxide (Mn-MOF/GO) composite materials were successfully synthesized by a solvothermal method and characterized and analyzed by PXRD, SEM and TEM. In order to study the corrosion inhibition properties of the Cu-MOF/GR, Cu-MOF/GO, Mn-MOF/GR and Mn-MOF/GO composite materials on carbon steel, they were mixed with waterborne acrylic varnish to prepare a series of composite coatings to explore in 3.5 wt% NaCl solution by electrochemical measurements and results showed that the total polarization resistance of the 3% Cu-MOF/GO and 3% Mn-MOF/GO composite coatings on the carbon steel surface were relatively large, and were 55![[thin space (1/6-em)]](https://www.rsc.org/images/entities/char_2009.gif) 097 and 55
097 and 55![[thin space (1/6-em)]](https://www.rsc.org/images/entities/char_2009.gif) 729 Ω cm2, respectively, which could effectively protect the carbon steel from corrosion. After immersion for 30 days, the 3% Mn-MOF/GO composite still maintained high corrosion resistance, the |Z| values were still as high as 23
729 Ω cm2, respectively, which could effectively protect the carbon steel from corrosion. After immersion for 30 days, the 3% Mn-MOF/GO composite still maintained high corrosion resistance, the |Z| values were still as high as 23![[thin space (1/6-em)]](https://www.rsc.org/images/entities/char_2009.gif) 804 Ω cm2. Therefore, MOFs compounded with GO can produce a synergistic corrosion inhibition effect and improve the corrosion resistance of the coating; this conclusion is well confirmed by the adhesion capability test.
804 Ω cm2. Therefore, MOFs compounded with GO can produce a synergistic corrosion inhibition effect and improve the corrosion resistance of the coating; this conclusion is well confirmed by the adhesion capability test.
1. Introduction
Metal–organic frameworks (MOFs) are coordination polymers constructed from inorganic metals and organic ligands, by changing the metal ions, organic ligands or the interaction between metal ions and organic ligands, MOFs with variable structures can be prepared.1–5 Graphene (GR) has stable chemical properties and a unique sheet structure.6,7 Adding GR to a coating can block the penetration of oxygen, water molecules, chloride ions and other corrosive substances into the coating and extend the life of the coating, so becoming an outstanding candidate for anticorrosion coating barrier materials.8–10 However, the poor dispersibility of GR in various solvents can affect its wide application in the field of coatings.11,12 Graphene oxide (GO) is an oxidized derivative of GR and has the ability to form stable solutions in water and certain organic solvents.13–15 Copper ions and manganese ions have unfilled d orbitals in their structures, which are easy to coordinate with nitrogen atoms, so they are selected as metal ions for the synthesis of MOFs.16 The surface of carbon steel in a sodium chloride solution is negatively charged due to the adsorption of chloride ions, so it is beneficial to adsorb positively charged corrosion inhibitors. The ligands contain nitrogen atoms; when nitrogen is coordinated with a metal ion, its unpaired electrons fill the empty orbital of the metal ions.17 Therefore, after the coordination bond is formed, the nitrogen atom is positively charged, which may make the ligand molecule a positively charged corrosion inhibitor. Therefore, 6-picoline-2,3-dicarboxylic acid and 2,2′-bisquinoline-4,4′-dicarboxylic acid containing nitrogen heterocycles are selected as organic ligands to synthesize MOFs.18 The organic ligands used to synthesize MOFs are heterocyclic compounds containing heteroatoms such as N and O. These heteroatoms can form coordinate bonds with metal atoms on the surface of carbon steel and are adsorbed on the surface of carbon steel. Therefore, these heteroatoms often become the adsorption active sites for MOFs materials to play a role in corrosion inhibition. At the same time, because the MOFs material has a high porosity, the active sites that can inhibit corrosion can be fully exposed and effectively adsorbed on the surface of carbon steel to achieve the purpose of corrosion protection.There are unsaturated metal sites on MOFs, and there are many oxygen-containing groups (such as hydroxyl, carboxyl, epoxy, etc.) on the surface of GO, which can combine with unsaturated metal sites of MOFs to form coordination bonds.16 After the transition metals Mn and Cu form complexes with nitrogen-containing heterocyclic carboxylic acids, the Mn and Cu central ions still have unsaturated metal sites, and their empty orbitals can continue to accept oxygen-containing groups from the GO surface to reach a stable state of 16 or 18 electrons.19 Due to its powerful overall performance and rich structural diversity, GO and its composite materials provide broad prospects for various applications.20 The high practicality of carbon steel in many industrial fields prompts us to think of a very practical and friendly method to protect carbon steel against corrosion by corrosive media.21–23 Water-based coatings are hydrophilic. After the water-based coating forms a coating, the hydrophobicity of the coating plays an important role in the corrosion resistance of the coating.24,25 Due to its hydrophobicity, it can prevent the penetration of water molecules and corrosive media into the coating to a certain extent. However, the coatings formed by water-based coatings have poor hydrophobicity or water resistance. Usually, the hydrophobicity or water resistance of the coating is improved by changing the main film-forming polymer structure of the water-based coating, crosslinking, and adding additives to the coating formulation. In this article, MOFs/GO materials are used as an additive to be added to a waterborne acrylic varnish to prevent water molecules and corrosive media from penetrating into the coating and improve the corrosion resistance of the coating.
Due to the particularity of the MOFs structure, researchers continue to expand the application fields of MOFs materials and have achieved great results, but relatively few studies have applied them to the field of electrochemical corrosion protection.26,27 The MOFs skeleton has large pores, therefore, a series of composite materials are prepared by using the GR rich electronic system or the groups on GO to coordinate with the MOFs materials, so that they have the barrier properties of GR and the corrosion inhibition properties of MOFs, and provide a synergistic corrosion inhibition effect on carbon steel.28–30 Ramezanzadeh et al.31 reported MOF decorated GO nanoplatforms for anticorrosion epoxy coatings, and found that GO@ZIF-8 loaded epoxy composite material has good intelligent inhibitory activity. Cao32 reported that a BTA-MOF-TEOS-GO nanocomposite was fabricated and its anticorrosion performance was studied; results demonstrated that the BTA-MOF-TEOS-GO incorporated into the epoxy coatings showed excellent and durable anticorrosion properties.
In this study, two new MOFs, Cu-MOF and Mn-MOF, were prepared by a solvothermal method and were characterized by single crystal diffraction, Fourier infrared spectroscopy and thermogravimetry. Cu-MOF bridges with Cu2+ through 6-picoline-2,3-dicarboxylic acid (6-Me-2,3-pydc) and 1,10-phenanthroline (1,10-phen) to form a chain “Z” structure; Mn-MOF bridges with Mn2+ through 2,2′-bisquinoline-4,4′-dicarboxylic acid (2,2′-bca) to form a two-dimensional network structure. MOFs/GR and MOFs/GO composites were also prepared by a solvothermal method and were successfully characterized by PXRD, SEM and TEM, and then fully mixed with waterborne acrylic varnish to prepare a series of composite coatings. The adhesion capability test is used to evaluate the adhesion performance of all coatings. The electrochemical test was used to study the corrosion inhibition performance of the composite coating on carbon steel.
2. Experimental
2.1 Materials and solutions
N,N′-Dimethylformamide (DMF), CuCl2·2H2O, Mn(CH3OOH)2·4H2O, 6-picoline-2,3-dicarboxylic acid, 2,2′-bisquinoline-4,4′-dicarboxylic acid (2,2′-bca), 1,10-o-phenanthroline (1,10-phen), anhydrous ethanol, anhydrous methanol with analytical reagents, were purchased from Shanghai Macklin Reagent Co., Ltd, before use without purification. Single-layer GR, high-purity single-layer GO powder (nanoscale), and waterborne acrylic varnish (E0512) were purchased from Suzhou Hengqiu Technology Co., Ltd.2.2 Pre-treatment of specimens
The low-carbon steel specimens (40 × 130 × 20 mm) were successively polished with 400, 600, 800, 1000, 1200# sandpaper until the surface and corners became a smooth mirror surface, and then ultrasonically cleaned with distilled water for 0.5 h, and then sequentially with acetone, degreased with absolute ethanol, and dried in an oven before use.2.3 Preparation of corrosion solutions
17.5 g of sodium chloride was weighed in a beaker containing 482.5 mL of distilled water, magnetically stirred until completely dissolved, and formulated into 500 g of 3.5 wt% NaCl solution.2.4 Preparation of MOFs
The two MOFs were prepared by a solvothermal method.33 For Cu-MOF: 1.0 mM of CuCl2·2H2O, 0.5 mM of 6-picoline-2,3-dicarboxylic acid (6-Me-2,3-pydc), 0.5 mM of 1,10-phenanthroline (1,10-phen) and 1.0 mM of NaOH were weighed and dissolved in a beaker containing 15 mL methanol solution (5 mL anhydrous methanol and 10 mL distilled water), magnetically stirred at room temperature for 2 h, and the mixed solution was transferred to a 25 mL reaction kettle equipped with a Teflon bottle, placed in an oven and heated to 80 °C. After 72 h of reaction, it was slowly cooled to room temperature, and blue massive crystals are formed, which were filtered, washed with ethanol, and put in a 50 °C vacuum dried oven for 12 h to obtain 0.1076 g [Cu(6-Me-2,3-pydc)(1,10-phen)·7H2O]n (namely Cu-MOF). The synthesis process of Mn-MOF is consistent with Cu-MOF: the raw materials are 0.1 mM of 2,2′-bca and 0.2 mM of Mn(CH3OOH)2·4H2O, the solvent is DMF solution, and 10 mL of distilled water. The reaction temperature is 80 °C and the reaction time was 72 h. Yellow massive crystals were obtained with the formula [Mn2(2,2′-bca)2(H2O)2]n (namely Mn-MOF).Then, the structures of Cu-MOF and Mn-MOF were characterized and confirmed by elemental analysis, X-ray single crystal diffraction, Fourier infrared spectroscopy and thermogravimetric analysis.
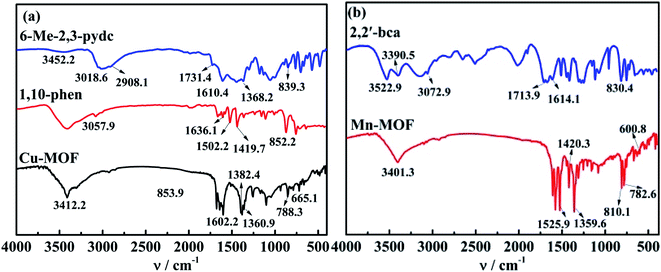
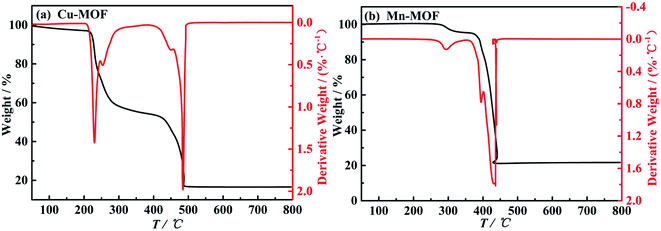
For Cu-MOF, yield: 63.5%. Elemental analysis: anal. calcd (%): C, 43.77; N, 7.66; H, 4.96. Found value (%): C, 43.15; N, 7.83; H, 4.68. X-Ray single crystal analysis: is monoclinic system and P21/c space group. The unit cell parameters: a = 1.08902 nm, b = 1.80847 nm, c = 1.27594 nm, α = γ = 90°, β = 110.790°, V = 2.3493 nm3, Z = 4, Dc = 1.196 g cm−3, μ = 0.96 mm−1, F(000) = 860, CCDC: 1981799.† The molecular structure ellipsoid and 3D structure of Cu-MOF are shown in Fig. 1(a) and (c), respectively. Characteristic FTIR peaks (KBr disk): νC![[double bond, length as m-dash]](https://www.rsc.org/images/entities/char_e001.gif) O = 1360.9; ν aromatic ring skeleton = 1382.4; νCu–O = 788.3; νCu–N = 665.1 cm−1 (ref. 34) (in Fig. 2(a)). The thermogravimetric analysis: a platform appears at 285–420 °C, and reaches stability after 490 °C (in Fig. 3(a)).
O = 1360.9; ν aromatic ring skeleton = 1382.4; νCu–O = 788.3; νCu–N = 665.1 cm−1 (ref. 34) (in Fig. 2(a)). The thermogravimetric analysis: a platform appears at 285–420 °C, and reaches stability after 490 °C (in Fig. 3(a)).
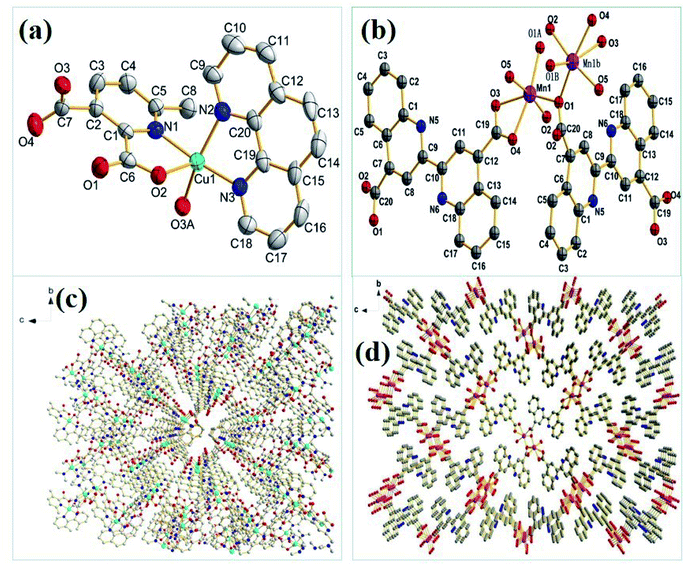 | ||
| Fig. 1 The molecular structure ellipsoids of (a) Cu-MOF and (b) Mn-MOF and 3D structures of (c) Cu-MOF and (d) Mn-MOF. | ||
For Mn-MOF, yield: 63.9%. Elemental analysis: anal. calcd (%): C, 57.85; N, 6.75; H, 2.91. Found value (%): C, 57.92; N, 6.67; H, 2.97. X-Ray single crystal analysis: is orthorhombic system and P212121 space group. The unit cell parameters: a = 0.48722 nm, b = 1.66989 nm, c = 1.93540 nm, α = β = γ = 90°, V = 1.57465 nm3, Z = 2, Dc = 1.752 g cm−3, μ = 0.88 mm−1, F(000) = 844, CCDC: 1981807.† The molecular structure ellipsoid and 3D structure of Mn-MOF are shown in Fig. 1(b) and (d), respectively. Characteristic FTIR peaks (KBr disk): νC![[double bond, length as m-dash]](https://www.rsc.org/images/entities/char_e001.gif) O = 1359.6 cm−1; ν aromatic ring skeleton = 1420.3, νMn–O = 782.6; νMn–N = 600.8 cm−1 (ref. 35) (in Fig. 2(b)). Thermogravimetric analysis: a platform appears at 370–435 °C, and reaches stability after 435 °C (in Fig. 3(b)).
O = 1359.6 cm−1; ν aromatic ring skeleton = 1420.3, νMn–O = 782.6; νMn–N = 600.8 cm−1 (ref. 35) (in Fig. 2(b)). Thermogravimetric analysis: a platform appears at 370–435 °C, and reaches stability after 435 °C (in Fig. 3(b)).
2.5 Preparation of MOF/GR and MOF/GO composites
A certain amount of GR was added to a beaker containing 5 mL of distilled water and was sonicated for 1 h to obtain a GR dispersion. According to section 2.4, the raw materials of Cu-MOF were weighed into a 25 mL beaker, then 10 mL of distilled water and 15 μL of acetic acid were added and, after magnetic stirring for 10 min, were added to the GR dispersion, magnetic stirring for 3 h to fully mix; then the solution was transferred to a 25 mL reaction kettle equipped with a Teflon bottle, placed in an oven and heated to 90 °C for 24 h, then slowly cooled to room temperature. A large amount of black powder was generated, centrifuged, and washed with distilled water 3 times, then dried in a 50 °C vacuum drying box for 12 h, to obtain nCu-MOF/GR composite material. (Recorded as nCu-MOF/GR, n = 1%, 3%, n represents the ratio of GR to the mass of all solid raw materials before compounding). The preparation method of the Cu-MOF/GO composite material is the same as the preparation method of the Cu-MOF/GR, except that the raw material GR is replaced with GO. The preparation method of the Mn-MOF/GR composite material and the Mn-MOF/GO composite material are the same as the Cu-MOF/GR preparation method, and the materials and reaction conditions are the same as when preparing the Mn-MOF.2.6 Preparation of coating
The fully ground MOFs/GR and MOFs/GO composite materials were ultrasonically dispersed in a beaker containing 2 mL of distilled water, and then was added to 20 mL of waterborne acrylic varnish, followed by ultrasonication for 20 min to obtain MOFs/GR and MOFs/GO composite coatings. The waterborne acrylic varnish coating (as a blank) and the MOFs/GR and MOFs/GO composite coatings were applied by a brushing process. The brush was used to apply the coating on the pre-treated carbon steel specimens, which was used after curing at room temperature for 4 h.2.7 Characterization of composite materials
A Dutch X’Pert3 X-ray powder diffractometer (PXRD) was used to analyze the phase compositions of Cu-MOF/GR, Cu-MOF/GO, Mn-MOF/GR and Mn-MOF/GO, with Cu-Kα as the monochromatic radiation. The light diffraction source collects diffraction data in the range of 2θ from 5° to 80°. A scanning electron microscope (SEM, Zeiss Sigma 300) and transmission electron microscope (TEM, JEOL JEM 2100F) were used to characterize the microscopic morphology of Cu-MOF/GR, Cu-MOF/GO, Mn-MOF/GR and Mn-MOF/GO.2.8 Adhesion capability test
The cross-cut method was used to study the adhesion of the prepared coating to carbon steel, in order to evaluate the protective ability of each coating to carbon steel.36 The adhesion capability test was performed according to the ISO 2409 cross-cut test standard. Controlling the thickness of all coatings at 80–120 μm, a scoring tool with a cutting pitch of 2 mm (with 6 cutting edges) was used to scribe at 3 positions on the coating (each position was separated by 5–10 mm), and made three positions to form a (4 mm2 × 25) mesh grid; the soft brush was used to sweep the surface of the coating, and then 3M600 tape was attached to the entire grid and peeled off at the minimum angle. The coating peeling rate was obtained according to the ratio of the average area of the coating surface that was absorbed by the tape three times.2.9 Electrochemical test
The CHI760-E electrochemical workstation with a three-electrode system was used for electrochemical measurements. The carbon steel sheet was the working electrode (WE) and the working area was 1 cm2, the platinum wire electrode (area of 1 cm2) was the auxiliary electrode (CE), and a saturated calomel electrode (SCE) was the reference electrode (RE).37 At 25 °C, electrochemical impedance spectroscopy (EIS) was performed by a sine wave with 5 mV signal amplitude, the angular frequency is from 100![[thin space (1/6-em)]](https://www.rsc.org/images/entities/char_2009.gif) 000 Hz to 0.01 Hz and the sensitivity is automatically adjusted for sensitivity. Before each set of experiments, the WE was immersed in 3.5 wt% NaCl corrosion solution for 2400 s until the system reached a stable state and obtained the value of open circuit potential (EOCP). After establishing the equilibrium state EOCP, electrochemical impedance spectroscopy (EIS) measurements were performed.37 The electrochemical parameters for the EIS were matched by the ZView impedance fitting software.38
000 Hz to 0.01 Hz and the sensitivity is automatically adjusted for sensitivity. Before each set of experiments, the WE was immersed in 3.5 wt% NaCl corrosion solution for 2400 s until the system reached a stable state and obtained the value of open circuit potential (EOCP). After establishing the equilibrium state EOCP, electrochemical impedance spectroscopy (EIS) measurements were performed.37 The electrochemical parameters for the EIS were matched by the ZView impedance fitting software.38
3. Results and discussion
3.1 Composition and surface morphology of the coating
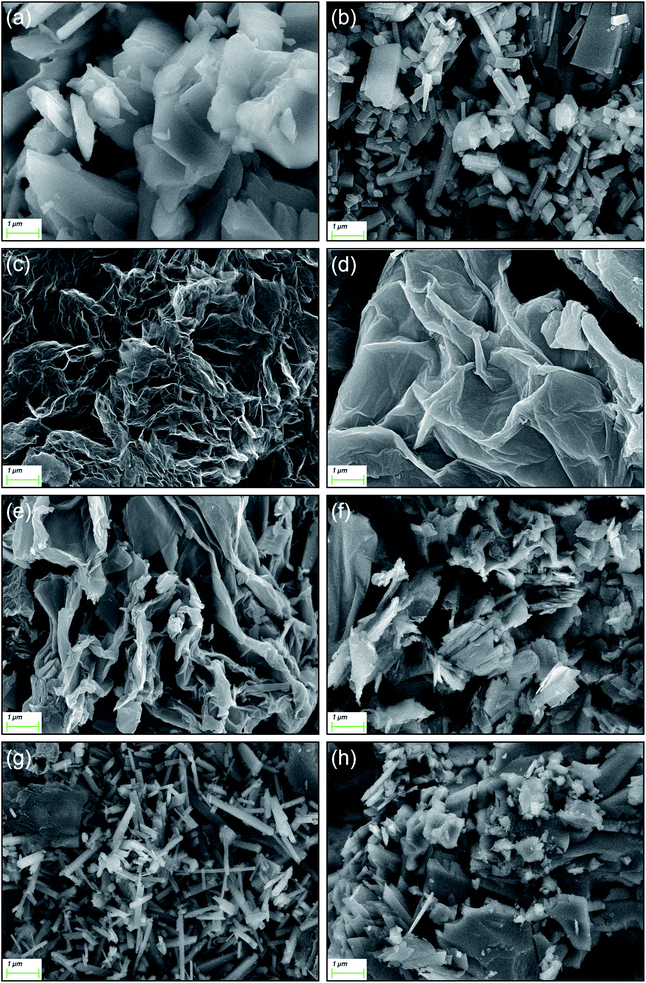 | ||
| Fig. 5 SEM of MOFs and four composite materials: (a) Cu-MOF, (b) Mn-MOF, (c) GR, (d) GO, (e) Cu-MOF/GR, (f) Cu-MOF/GO, (g) Mn-MOF/GR, (h) Mn-MOF/GO. | ||
TEM is used to further explore the finer topography of the composite material.41,42 The TEM images of Cu-MOF/GR, Cu-MOF/GO, Mn-MOF/GR and Mn-MOF/GO are shown in Fig. 6. Cu-MOF/GR had an obvious block structure and lamellar structure (in Fig. 6(a)). The block structure belonged to Cu-MOF, which was consistent with the morphology of Cu-MOF observed by SEM, the layer structure belonged to GR. Fig. 6(b) shows that there are a lot of Cu-MOF grown on the surface of GO. Mn-MOF/GR had both Mn-MOF tubular structure and GR sheet structure, indicating that added GR did not change the structure of Mn-MOF (in Fig. 6(c)). Mn-MOF aggregated into a block structure and was wrapped by GO (in Fig. 6(d)). The successful synthesis of Cu-MOF/GR, Cu-MOF/GO, Mn-MOF/GR and Mn-MOF/GO were further proved by TEM tests.
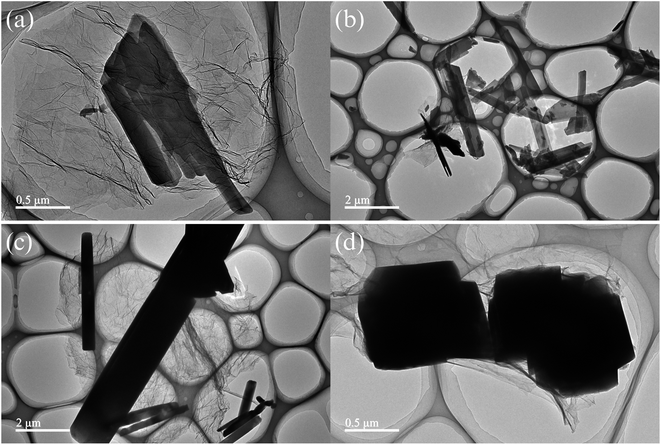 | ||
| Fig. 6 TEM images of four composite materials: (a) Cu-MOF/GR, (b) Cu-MOF/GO, (c) Mn-MOF/GR, (d) Mn-MOF/GO. | ||
Cu-MOF and Mn-MOF can through hydrogen bonding interactions and π⋯π conjugation form a three-dimensional structure. Therefore, the structure has a higher porosity, and the presence of GR or GO in the composite material fills the voids of the MOF to a certain extent, and some GR or GO was also wrapped with MOF, but from the perspective of TEM, the presence of GR or GO in composites does not affect the structure of MOF.
3.2 Adhesion capability analysis
The adhesion strength of the coating to the protected substrate is often used to evaluate the protective ability of the layer.43 It can be seen from Table 1 that the shedding rate of the acrylic varnish coating (as blank group) is 12.5%, the adhesion level is 2. The shedding rate of coatings containing Cu-MOF, Mn-MOF, GR, and GO are between 11.0–12.8%. The reason may be that although MOFs have strong adsorption to the substrate surface, they have poor dispersion in waterborne acrylic varnish coatings. Although GO has good dispersibility in acrylic coatings, it has poor adsorption on the surface of the substrate, while GR has poor adsorption on the surface of the substrate and dispersibility in waterborne acrylic varnish coatings. Therefore, when these materials are added to the waterborne acrylic varnish alone, they cannot significantly improve the adhesion of the coating. The shedding rate of MOFs/GR and MOFs/GO coatings are lower than 10%. This is because after GR is compounded with MOFs, the composite material has both the adsorption effect of MOFs on the substrate surface and the better dispersibility of GO in waterborne acrylic varnish coatings, so the adhesion of MOFs/GO composite materials has been significantly improved. The adhesion of MOFs/GR is not as good as MOFs/GO, because GR has poor adsorption to the substrate surface and poor dispersion in waterborne acrylic varnish coatings, resulting in lower adhesion. It is worth noting that when the shedding rate of 3% Cu-MOF/GO and 3% Mn-MOF/GO is less than 5%, it reached the level 1 standard.| Coatings | Average cross-cut area (mm2) | Coating shedding rate (%) | Classification |
|---|---|---|---|
| a Classification description: the coating shedding rate (%) of almost 0 is level 0; ≤5% is level 1, 5% ≤ 15% is level 2, 15% ≤ 35% is level 3, 35% ≤ 65% is level 4, ≥65% is level 5. | |||
| Blank | 12.5 ± 0.6 | 12.5 | 2 |
| Cu-MOF | 12.8 ± 0.5 | 12.8 | 2 |
| Mn-MOF | 12.1 ± 0.6 | 12.1 | 2 |
| GR | 11.3 ± 0.6 | 11.3 | 2 |
| GO | 11.0 ± 0.4 | 11.0 | 2 |
| 1% Cu-MOF/GO | 10.2 ± 0.5 | 8.2 | 2 |
| 3% Cu-MOF/GR | 10.5 ± 0.4 | 8.5 | 2 |
| 1% Cu-MOF/GR | 10.4 ± 0.4 | 8.4 | 2 |
| 1% Mn-MOF/GR | 9.9 ± 0.4 | 7.9 | 2 |
| 3% Mn-MOF/GR | 8.6 ± 0.3 | 6.6 | 2 |
| 1% Mn-MOF/GO | 7.4 ± 0.3 | 6.4 | 2 |
| 3% Cu-MOF/GO | 4.6 ± 0.3 | 4.6 | 1 |
| 3% Mn-MOF/GO | 4.0 ± 0.3 | 4.0 | 1 |
3.3 EIS analysis
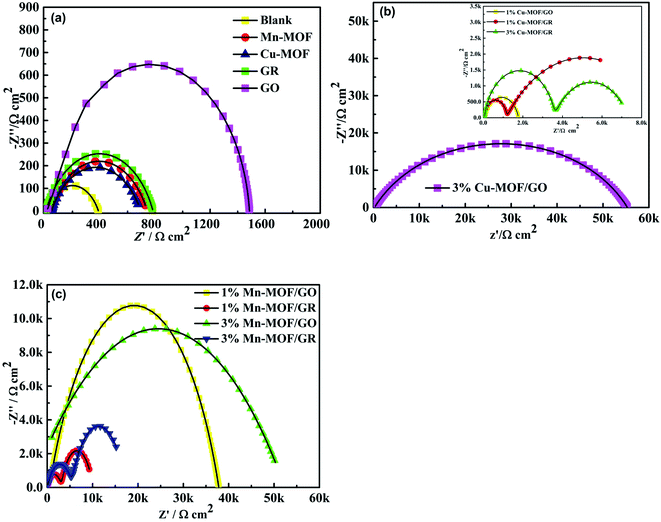
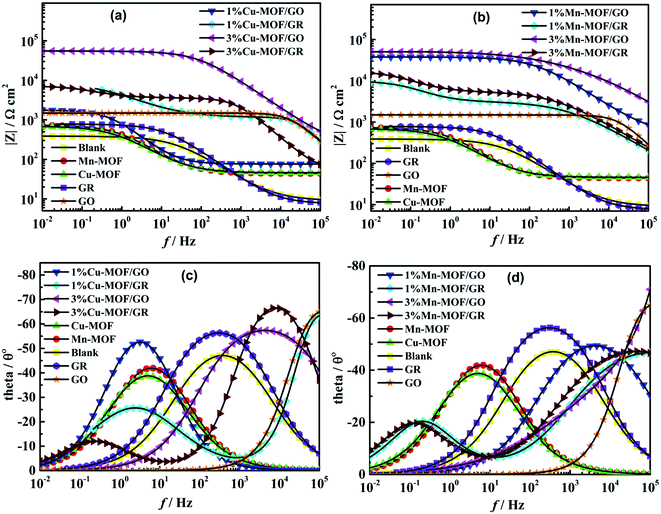
In the Nyquist diagram, the corrosion resistance of the coating is related to the radius of the arc resistance, the larger the radius, the stronger the corrosion resistance of the coating.43–45 The electrode process dynamics and surface phenomena at the coating–solution interface were explored by EIS.46,47 Fig. 7 are the Nyquist diagrams of 3.5 wt% NaCl with waterborne acrylic varnish coating (as blank), waterborne acrylic varnish containing Cu-MOF, Mn-MOF, Cu-MOF/GR and Mn-MOF/GO (solid lines show fitted results). It can be seen from Fig. 7(a) that the waterborne acrylic varnish has the smallest capacitive arc radius and poor anticorrosion ability. The waterborne acrylic varnish coating containing GO has the largest capacitive arc radius. This is due to the thin layer of GO, which has good dispersibility in the waterborne acrylic varnish, so that the coating can effectively provide an anticorrosion effect.48 The GR sheet is thicker, and compared with GO, it has poor dispersibility in waterborne acrylic varnish, so the capacitive arc radius is smaller than GO. The arc radii of the waterborne acrylic varnish coatings containing Mn-MOF and Cu-MOF are larger than that of the waterborne acrylic varnish coating. This is because the structures of Mn-MOF and Cu-MOF contain a large number of N and O atoms, which can interact with the surface of carbon steel. The coordination effect of the metal atoms adsorbed on the surface of carbon steel and the pore structure of the MOFs material can make these adsorption sites be fully exposed. Therefore, the corrosion resistance abilities of the waterborne acrylic varnish coatings containing Mn-MOF and Cu-MOF are better than that of the waterborne acrylic varnish coating.No matter which kind of coating, it has its defects. When GR or GO is added to the coating in the form of filler to form a coating on the metal surface, although the coating has good film-forming properties, once the coating has slight scratches, cracks or pinholes, the metal substrate is easily in contact with the GR or GO, and will suffer local microbattery corrosion at the contact.49 At the same time, the interface compatibility between GR or GO and waterborne acrylic varnish is poor, which can also cause defects such as micropores and microcracks in the coating.50 These defects may promote the corrosion reaction of the carbon steel substrate. So, those shielding layers could prevent the corrosive medium from eroding the carbon steel surface in a short time immersion. However, with the extension of the immersion time, due to the poor adhesion of the GO and GR coatings, the corrosion resistance dropped sharply. Therefore, it is necessary to add MOFs to compound with them to improve the adhesion of the coating.
Fig. 7(b) shows that the Nyquist diagrams of waterborne acrylic varnish containing 1% Cu-MOF/GO and 3% Cu-MOF/GO showed a single capacitive arc, while 1% Cu-MOF/GR and 3% Cu-MOF/GR exhibited two capacitive arcs, indicating that 1% Cu-MOF/GO and 3% Cu-MOF/GO composite coatings have better corrosion resistance. In Fig. 7(c), the waterborne acrylic varnishes containing 1% Mn-MOF/GO and 3% Mn-MOF/GO show only one capacitive arc during the entire test process, indicating that the carbon steel did not suffer corrosion due to defects in the coating. Two capacitive arcs appeared in the Nyquist diagrams of 1% Mn-MOF/GR and 3% Mn-MOF/GR composite coatings, indicating that the corrosive medium has begun to penetrate the composite coating to erode the carbon steel. MOFs/GO composite coatings have better corrosion resistance than MOFs/GR composite coatings. This may be because compared with GR, GO has a rich electronic system and carbonyl functional groups, which are easier for MOFs to coordinate to. In addition, MOFs and GO have good corrosion inhibition performances, so compounding them can produce a synergistic corrosion inhibition effect and improve the corrosion resistance of the coating.51
During the EIS tests, the impedance modulus of the low frequency region in the Bode diagram is often used to evaluate the shielding performance of the coating.52–54 Fig. 8(a) and (b) show that the impedance modulus values of GR, GO, 1% Cu-MOF/GR, 3% Cu-MOF/GR, 1% Cu-MOF/GO, 3% Cu-MOF/GO, 1% Mn-MOF/GR, 3% Mn-MOF/GR, 1% Mn-MOF/GO and 3% Mn-MOF/GO composite coatings at the lowest frequency are 782.0, 1485.9, 6184.1, 7001.3, 1759.7, 55![[thin space (1/6-em)]](https://www.rsc.org/images/entities/char_2009.gif) 276, 9318.9, 15
276, 9318.9, 15![[thin space (1/6-em)]](https://www.rsc.org/images/entities/char_2009.gif) 392, 37
392, 37![[thin space (1/6-em)]](https://www.rsc.org/images/entities/char_2009.gif) 795 and 50
795 and 50![[thin space (1/6-em)]](https://www.rsc.org/images/entities/char_2009.gif) 312 Ω m2. It was found that 3% Cu-MOF/GO and 3% Mn-MOF/GO composite coatings have better shielding performances. In Fig. 8(c) and (d), 3% Cu-MOF/GO and 3% Mn-MOF/GO composite coatings have a time constant at high frequency, indicating that 3% Cu-MOF/GO and 3% Mn-MOF/GO composite coatings show excellent corrosion resistance. The corrosion resistance performances of Mn-MOF/GO and Mn-MOF/GR composite coatings were higher than those of Cu-MOF/GO and Cu-MOF/GR, because Mn-MOF is a two-dimensional planar structure, and the ratio of the conjugate systems is larger than for Cu-MOF and compounded with GO and GR can provide better corrosion resistance.
312 Ω m2. It was found that 3% Cu-MOF/GO and 3% Mn-MOF/GO composite coatings have better shielding performances. In Fig. 8(c) and (d), 3% Cu-MOF/GO and 3% Mn-MOF/GO composite coatings have a time constant at high frequency, indicating that 3% Cu-MOF/GO and 3% Mn-MOF/GO composite coatings show excellent corrosion resistance. The corrosion resistance performances of Mn-MOF/GO and Mn-MOF/GR composite coatings were higher than those of Cu-MOF/GO and Cu-MOF/GR, because Mn-MOF is a two-dimensional planar structure, and the ratio of the conjugate systems is larger than for Cu-MOF and compounded with GO and GR can provide better corrosion resistance.
The equivalent circuit diagrams of the MOFs/GO and MOFs/GR composite coatings are shown in Fig. 9(a) and (b), respectively, where Rs is the solution resistance, the total polarization resistance Rp (Rp = Rs + Rc + Rct) represents the corrosion resistance of the coating to corrosive media,55,56 Rc is the coating resistance, Rct is charge transfer resistance, and CPE is the constant phase element; Ccoat and Cdl are the capacitance response and charge transfer capacitance response of the double layer coating on the electrolyte/substrate interface, respectively.57,58
Due to the unevenness and roughness of the coating surface, CPE is often introduced instead of capacitor C, and its impedance is expressed by the following formula:59
| ZCPE = [Y0(jω)n]−1 | (1) |
 | (2) |
 represents the angular frequency of impedance.
The measured impedance data was fitted by ZView software. The corresponding electrochemical parameters including coating resistance (Rc), Ccoat parameters (Y0, n) and Cdl parameters (Y1, n1) are listed in Table 2. Under the same MOF, the Rt value of the composite coating increases with the addition of GR or GO. This is because the unique structures of GR and GO prevent the corrosion medium from entering the carbon steel surface and increase the corrosion resistance of the coating. In summary, the corrosion resistance sequence of various coatings during the entire test process is as follow: 3% Mn-MOF/GO > 3% Cu-MOF/GO > 1% Mn-MOF/GO > 3% Mn-MOF/GR > 1% Mn-MOF/GR > 1% Cu-MOF/GR > 3% Cu-MOF/GR > 1% Cu-MOF/GO > GO > GR > Mn-MOF > Cu-MOF > blank.
| Coating | Rs (Ω cm2) | Rc (Ω cm2) | CPE/Ccoat | Rct (Ω cm2) | Cdl | ||
|---|---|---|---|---|---|---|---|
| Y0 (10−6 Sn Ω−1 cm−2) | n | Y1 (10−6 Sn Ω−1 cm−2) | n1 | ||||
| Blank | 7.3 ± 0.4 | 379 ± 5 | 87.27 ± 1.37 | 0.68 ± 0.03 | — | — | — |
| GR | 6.6 ± 0.3 | 777 ± 7 | 51.22 ± 1.02 | 0.74 ± 0.03 | — | — | — |
| GO | 6.5 ± 0.2 | 1444 ± 14 | 0.013 ± 0.001 | 0.93 ± 0.04 | — | — | — |
| Cu-MOF | 7.0 ± 0.3 | 649 ± 8 | 565.82 ± 11.04 | 0.68 ± 0.02 | — | — | — |
| Mn-MOF | 6.5 ± 0.1 | 697 ± 6 | 430.84 ± 11.12 | 0.72 ± 0.03 | — | — | — |
| 1% Cu-MOF/GR | 6.7 ± 0.3 | 109 ± 3 | 0.0055 ± 0.0004 | 0.99 ± 0.03 | 7776 ± 51 | 74.90 ± 2.03 | 0.57 ± 0.02 |
| 3% Cu-MOF/GR | 5.9 ± 0.2 | 3552 ± 37 | 0.16 ± 0.01 | 0.88 ± 0.02 | 3719 ± 33 | 301.07 ± 7.05 | 0.69 ± 0.03 |
| 1% Cu-MOF/GO | 5.7 ± 0.2 | 1704 ± 18 | 238.83 ± 3.7 | 0.82 ± 0.01 | — | — | — |
| 3% Cu-MOF/GO | 5.8 ± 0.1 | 55![[thin space (1/6-em)]](https://www.rsc.org/images/entities/char_2009.gif) 091 ± 87 091 ± 87 |
0.25 ± 0.02 | 0.71 ± 0.03 | — | — | — |
| 1% Mn-MOF/GR | 6.3 ± 0.3 | 3141 ± 25 | 2.08 ± 0.11 | 0.58 ± 0.03 | 6889 ± 47 | 217.88 ± 4.04 | 0.71 ± 0.02 |
| 3% Mn-MOF/GR | 6.8 ± 0.2 | 5463 ± 31 | 1.57 ± 0.07 | 0.59 ± 0.02 | 11![[thin space (1/6-em)]](https://www.rsc.org/images/entities/char_2009.gif) 815 ± 58 815 ± 58 |
179.96 ± 3.05 | 0.70 ± 0.02 |
| 1% Mn-MOF/GO | 6.7 ± 0.2 | 37![[thin space (1/6-em)]](https://www.rsc.org/images/entities/char_2009.gif) 340 ± 63 340 ± 63 |
0.27 ± 0.02 | 0.67 ± 0.03 | — | — | — |
| 3% Mn-MOF/GO | 5.9 ± 0.1 | 55![[thin space (1/6-em)]](https://www.rsc.org/images/entities/char_2009.gif) 723 ± 82 723 ± 82 |
0.63 ± 0.03 | 0.41 ± 0.01 | — | — | — |
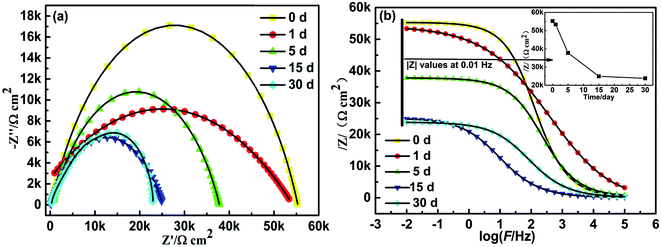
From Table 2, the 3% Mn-MOF/GO coating has the largest total polarization resistance Rp when immersed in 3.5 wt.% NaCl, so its corrosion inhibition performance in 3.5 wt% NaCl solution for different times was further explored by EIS, and the results are shown in Fig. 10. From the Nyquist plots in Fig. 10(a), it can be seen that the capacitive arc is reduced only about one-thirtieth after immersing in 3.5 wt% NaCl solution for 1 day, and only about three-tenths after immersing for 5 days. With the increase in the immersion time, the capacitive resistance arc decreases slowly, and there was no trend of sharp decline. Within 15 to 30 days, the capacitive resistance arc tends to be gentle. After 30 days of immersion, the impedance value could still be maintained at about 24 KΩ cm2, which was more than 2 orders of magnitude higher than any coating in Fig. 7(a), indicating that the 3% Mn-MOF/GO coating has long-lasting corrosion resistance.
As can be seen from the Bode plots in Fig. 10(b), as the immersion time increased, the |Z| values decreased. The inset is the change trend of the |Z| values of the 3% Mn-MOF/GO coating at low frequency (0.01 Hz) with the immersion time. The |Z| values of the 3% Mn-MOF/GO coating at 0.01 Hz decreased slowly with the increase in the immersion time in 3.5 wt% NaCl solution, indicating that its anticorrosion performance has also decreased. However, after 30 days of immersion, the |Z| value was still as high as 23![[thin space (1/6-em)]](https://www.rsc.org/images/entities/char_2009.gif) 804 Ω cm2, which was about 49 times that of bare carbon steel when immersed for 2400 s, and 17 times that when the GO coating was immersed for 2400 s. The |Z| values of the 3% Mn-MOF/GO coating after soaking for 30 days was still much higher than that of the blank group when immersed for 2400 s. It showed that the 3% Mn-MOF/GO coating prepared in this experiment has relatively long-term anticorrosive properties. This is because in the 3% Mn-MOF/GO composite coating, Mn-MOF and GO are successfully compounded, giving full play to the synergistic anticorrosion effect and effectively protecting the carbon steel.
804 Ω cm2, which was about 49 times that of bare carbon steel when immersed for 2400 s, and 17 times that when the GO coating was immersed for 2400 s. The |Z| values of the 3% Mn-MOF/GO coating after soaking for 30 days was still much higher than that of the blank group when immersed for 2400 s. It showed that the 3% Mn-MOF/GO coating prepared in this experiment has relatively long-term anticorrosive properties. This is because in the 3% Mn-MOF/GO composite coating, Mn-MOF and GO are successfully compounded, giving full play to the synergistic anticorrosion effect and effectively protecting the carbon steel.
4 Anticorrosion mechanism analysis
The organic ligands used to synthesize MOFs are heterocyclic compounds containing heteroatoms such as N and O.60 These heteroatoms can form coordinate bonds with metal atoms of the carbon steel surface and adsorb on the surface of carbon steel. Therefore, these heteroatoms often become the adsorption active sites for MOFs materials to play a role in corrosion inhibition. At the same time, because the MOFs material has a high porosity, the active sites that can inhibit corrosion can be fully exposed and effectively adsorbed on the surface of carbon steel to achieve the purpose of corrosion protection.61 GR has hydrophobic properties, and the lamellar structure can largely isolate the intrusion of water, oxygen and corrosive ions into the metal matrix, thereby effectively slowing down the corrosion rate of the metal substrate, that is, the anticorrosion effect of GR is a physical anticorrosion mechanism.62 In this paper, based on the research idea of effectively combining the physical anticorrosion effect of GO with the chemical adsorption effect of MOFs, a new waterborne acrylic coating anticorrosion additive (MOFs/GO composite material) was constructed. The surface of GO contains a large number of oxygen-containing functional groups (such as hydroxyl, epoxy, carboxyl, etc.), which can coordinate well with the unsaturated metal sites in MOFs to form MOFs/GO composite materials.63 Moreover, most of the groups on the surface of GO are polar groups, so that the MOFs/GO composite material can be well dispersed in the waterborne acrylic varnish. After GO is compounded with MOFs, the adsorption and barrier effects of MOFs will form a synergistic anticorrosion effect, which greatly enhances the anticorrosion performance of waterborne acrylic acid on carbon steel.5. Conclusions
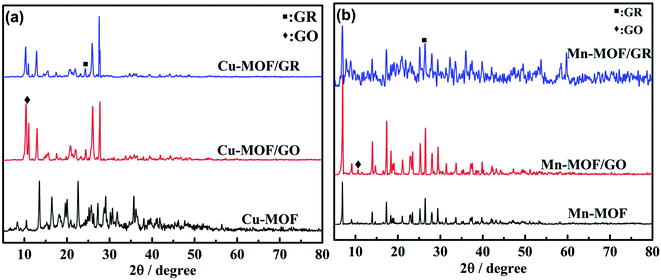
Two new metal–organic frameworks, Cu-MOF with a chain “Z” structure and Mn-MOF with a two-dimensional network structure, were synthesized and their structures were successfully characterized and confirmed. MOFs/GR and MOFs/GO composites were fabricated and successfully characterized by PXRD, SEM and TEM. PXRD tests showed that compounding MOFs with GR and GO does not affect the crystal structure and high crystallinity is maintained. SEM and TEM tests showed that Cu-MOF and Mn-MOF are successfully combined with GR and GO. EIS tests showed that the composite coatings of MOFs/GR and MOFs/GO on the surface of carbon steel could effectively protect the carbon steel from corrosion media. The adhesion capability test results showed that 3% Cu-MOF/GO and 3% Mn-MOF/GO have relatively better adhesion. The 3% Mn-MOF/GO composite coating was selected to explore the effect of immersion time on the corrosion resistance of the coating; the results showed that the 3% Mn-MOF/GO composite coating still had relatively long-term anticorrosive properties after immersion for 30 days. Therefore, the fabricated Mn-MOF/GO composite coating may be a potential candidate for carbon steel protection.Conflicts of interest
There are no conflicts to declare.Acknowledgements
Thanks to the National Nature Science Foundation of China (61661014), the Nature Science Foundation of Guangxi Province (No. 2018GXNSFAA281198, 2018GXNSFAA294042, 2018GXNSFBA281135), Guangxi One Thousand Young and Middle-aged College and University Backbone Teachers Cultivation Program for the support.References
- X. Dai, X. W. Shi and C. A. Huo, Thermochim. Acta, 2017, 657, 39–46 CrossRef CAS.
- C. Lin, H. He and Y. Zhang, RSC Adv., 2020, 10, 3084–3091 RSC.
- Y. L. Li, L. P. Zheng and H. Nie, J. Mol. Struct., 2020, 1204, 127427 CrossRef CAS.
- S. R. Batten, B. L. Chen and J. J. Vittal, ChemPlusChem, 2016, 81, 669–670 CrossRef CAS PubMed.
- B. L. Zhang, W. Qiu and P. P. Wang, Chem. Eng. J., 2020, 385, 123507 CrossRef CAS.
- Y. Wang, S. S. Li and H. Y. Yang, RSC Adv., 2020, 10, 15328–15345 RSC.
- A. Samanta and R. Bordes, RSC Adv., 2020, 10, 2396–2403 RSC.
- Y. Xu, J. Qu and Y. Shen, RSC Adv., 2018, 8, 15181–15187 RSC.
- T. Guo, H. Li and X. Ma, Plast., Rubber Compos., 2020, 5, 1–9 CrossRef.
- N. Parhizkar, T. Shahrabi and B. Ramezanzadeh, J. Alloys Compd., 2018, 747, 109–123 CrossRef CAS.
- P. Sepideh and R. V. Mohammad, Corros. Sci., 2017, 115, 78–92 CrossRef.
- N. Palaniappan, I. S. Cole and A. E. Kuznetsov, RSC Adv., 2019, 9, 32441–32447 RSC.
- Y. Ahmadi and S. Ahmad, Prog. Org. Coat., 2019, 127, 168–180 CrossRef CAS.
- N. Parhizkar, T. Shahrabi and B. Ramezanzadeh, J. Alloys Compd., 2018, 747, 109–123 CrossRef CAS.
- N. Palaniappan, I. S. Cole and F. Caballero-Briones, RSC Adv., 2019, 9, 8537–8545 RSC.
- P. Sharma, A. Gogoi and A. K. Verma, New J. Chem., 2020, 44, 5473–5488 RSC.
- S. B. Lee and Y. Ha, Mol. Cryst. Liq. Cryst., 2019, 679, 65–70 CrossRef CAS.
- L. Zhang, Z. P. Yan and Z. L. Tu, J. Mater. Chem. C, 2019, 7, 11606–11611 RSC.
- M. Qiao, H. Kong and X. Ding, RSC Adv., 2019, 9, 28146–28152 RSC.
- X. Y. Shi, J. C. Yu and Q. Liu, ACS Appl. Nano Mater., 2020, 3, 5625–5636 CrossRef CAS.
- H. Yang, S. Feng and Q. Ma, RSC Adv., 2018, 8, 5026–5033 RSC.
- Z. F. Zhang, F. J. Wang and L. Yao, RSC Adv., 2018, 8, 20648–20654 RSC.
- M. Hegazy, M. Abdallah and M. Alfaker, Int. J. Electrochem. Sci., 2018, 13, 6824–6842 CrossRef CAS.
- B. B. Pajarito, A. J. F. Caguntas and B. Niño, Mater. Sci. Forum, 2018, 917, 252–256 Search PubMed.
- J. Khodabakhshi, H. Mandavi and F. Najafi, Corros. Sci., 2019, 147, 128–140 CrossRef CAS.
- W. Han, X. Huang and G. Lu, Catal. Surv. Asia, 2019, 23, 64–89 CrossRef CAS.
- M. Altaf, M. Sohail and M. Mansha, ChemSusChem, 2018, 11, 542–546 CrossRef CAS PubMed.
- Z. Wang, Z. Jin and H. Yang, Mol. Catal., 2019, 467, 78–86 CrossRef CAS.
- M. H. Nazir, Z. A. Khan and A. Saeed, Tribol. Int., 2018, 121, 30–44 CrossRef CAS.
- D. Yang, G. Yang and S. Gai, ACS Appl. Mater. Interfaces, 2017, 9, 6829–6838 CrossRef CAS PubMed.
- M. Ramezanzadeh, B. Ramezanzadeh, M. Mahdavian and G. Bahlakeh, Carbon, 2020, 161, 231–251 CrossRef CAS.
- K. Y. Cao, Z. X. Yu and D. Yin, Prog. Org. Coat., 2020, 143, 105629 CrossRef CAS.
- M. M. Aung, W. J. Li and H. N. Lim, Ind. Eng. Chem. Res., 2020, 59, 1753–1763 CrossRef CAS.
- F. C. Juan, M. A. Pablo and M. S. R. Dary, BioMetals, 2019, 32, 21–32 CrossRef PubMed.
- Y. P. Xu, W. T. Chen and C. Yi, J. Chem. Res., 2018, 42, 148–152 CrossRef CAS.
- R. Ji, M. Ma and Y. He, Ceram. Int., 2018, 44, 15192–15199 CrossRef CAS.
- C. X. Liang, Z. Liu and Q. Q. Liang, J. Mol. Liq., 2019, 277, 330–340 CrossRef CAS.
- M. Shin, Y. K. Kim and S. K. Lee, Sens. Actuators, B, 2019, 290, 336–346 CrossRef.
- J. Ma, X. Guo and Y. Ying, Chem. Eng. J., 2017, 313, 890–898 CrossRef CAS.
- S. J. Yang, Q. F. Zou and T. H. Wang, J. Membr. Sci., 2019, 569, 48–59 CrossRef CAS.
- Y. Hao, L. Li and D. Liu, Mol. Catal., 2018, 447, 37–46 CrossRef CAS.
- F. Yang, S. Xie and G. Wang, Environ. Sci. Pollut. Res., 2020, 27, 20246–20258 CrossRef CAS PubMed.
- L. Bacáková, V. Star and O. Kofronová, J. Biomed. Mater. Res., 2015, 54, 567–578 CrossRef.
- K. V. Rybalka, L. A. Beketaeva and A. D. Davydov, Russ. J. Electrochem., 2018, 54, 456–458 CrossRef CAS.
- M. Murmu, K. S. Saha and C. N. Murmu, Corros. Sci., 2019, 146, 134–151 CrossRef CAS.
- A. Pandey, B. Singh and C. Verma, RSC Adv., 2017, 7, 47148–47163 RSC.
- M. Fu, J. M. Li and H. Cai, Adv. Mater. Res., 2015, 1088, 358–362 Search PubMed.
- T. A. N. Tuyet, S. Hiromoto and P. N. Nguyen, Mater. Sci. Forum, 2020, 985, 156–164 Search PubMed.
- J. Ding, H. Zhao and Y. Zheng, Carbon, 2018, 138, 197–206 CrossRef CAS.
- J. A. Quezada-Renteria, L. F. Chazaro-Ruiz and J. R. Rangel-Mendez, Carbon, 2020, 167, 512–522 CrossRef CAS.
- H. Singh, S. Zhuang and B. Nunna, Catalysts, 2018, 8, 607 CrossRef.
- Y. Wu, W. Zhao and Y. Qiang, Carbon, 2020, 159, 292–302 CrossRef CAS.
- S. Jiang, J. Xu and Z. Chen, Journal of Materials Science, 2018, 29, 5624–5633 CAS.
- L. Wu, L. Wang and Z. Guo, ACS Appl. Mater. Interfaces, 2019, 11, 34338–34347 CrossRef CAS PubMed.
- J. H. Shim, S. J. Lee and H. Gim, Mol. Med. Rep., 2016, 14, 3908–3916 CrossRef CAS PubMed.
- P. Thiraviyam and K. Kannan, Arabian J. Sci. Eng., 2013, 38, 1757–1767 CrossRef CAS.
- Y. Wu, G. Chen and M. Zhan, Prog. Org. Coat., 2019, 132, 184–190 CrossRef CAS.
- W. C. Wei, Z. Liu and C. X. Liang, RSC Adv., 2020, 10, 17816–17828 RSC.
- T. C. Liu, Q. Y. Hu and X. H. Li, J. Mater. Chem. A, 2019, 7, 20911–20918 RSC.
- M. Zhang, L. Ma and L. L. Wang, ACS Appl. Mater. Interfaces, 2018, 24, 2259–2263 CrossRef PubMed.
- W. J. Li, B. H. Ren and Y. Chen, ACS Appl. Mater. Interfaces, 2018, 10, 37529–37534 CrossRef CAS PubMed.
- C. H. Chang, T. C. Huang and C. W. Peng, Carbon, 2012, 50, 5044–5051 CrossRef CAS.
- Z. X. Yu, H. H. Di and Y. Ma, Surf. Coat. Technol., 2015, 276, 471–478 CrossRef CAS.
Footnote |
| † CCDC 1981799 and 1981807. For crystallographic data in CIF or other electronic format see DOI: 10.1039/d0ra05690a |
| This journal is © The Royal Society of Chemistry 2020 |

