DOI:
10.1039/D0RA05606E
(Paper)
RSC Adv., 2020,
10, 30214-30222
Ultrasonic-assisted preparation of highly active Co3O4/MCM-41 adsorbent and its desulfurization performance for low H2S concentration gas
Received
27th June 2020
, Accepted 6th August 2020
First published on 17th August 2020
Abstract
Co3O4/MCM-41 adsorbents were successfully prepared by ultrasonic assisted impregnation (UAI) and traditional mechanical stirring impregnation (TMI) technologies and characterized by X-ray diffraction (XRD), N2 adsorption desorption, Fourier transform infrared spectra (FT-IR), transmission electron microscopy (TEM), scanning electron microscopy (SEM) and thermogravimetry-differential thermal analysis (TG-DTA). The H2S removal performances for a simulated low H2S concentration gas were investigated in a fixed-bed. The effect of preparation and adsorption conditions on the H2S removal over Co3O4/MCM-41 were systematically examined. The results showed that UAI promotes more and well defined highly dispersed active Co3O4 phase on MCM-41. As compared to the Co3O4/MCM-41-T prepared via TMI, the saturated H2S capacity of Co3O4/MCM-41-U prepared via UAI improved by 33.2%. The desulfurization performance of adsorbents decreased in the order of Co3O4/MCM-41-U > Co3O4/MCM-41-T > MCM-41. The Co3O4/MCM-41-U prepared using Co(NO3)2 concentration of 10%, ultrasonic time of 2 h, calcination temperature of 550 °C and calcination time of 3 h exhibited the best H2S removal efficiency. At adsorption temperature of 25 °C with model gas flowrate of 20 mL min−1, the breakthrough time of Co3O4/MCM-41-U was 10 min, and the saturated H2S capacity and H2S removal rate was 52.6 mg g−1 and 47.8%, respectively.
1 Introduction
Industrial processes have produced large amount of hazardous materials which are harmful for humans and the environment.1,2 Hydrogen sulfide (H2S) with its characteristic rotten egg smell is often present in a variety of hydrocarbon resources such as natural gas and biogas.3 H2S is a poisonous, corrosive and flammable colorless gas. Therefore, removing this poisonous gas from hydrocarbon resources is an important global concern.4
Currently, methods of H2S removal from hydrocarbon resources are mainly wet and dry desulfurization. An alcohol amine solution is commonly used in industrial H2S absorption.5,6 However, disadvantages of this method for industrial application are large investment and high energy consumption. Comparatively, the dry method is preferred over the wet method in terms of cost and environmental considerations. Moreover, adsorption is known as one of the most efficient candidates to adsorb H2S from low H2S concentration gases owing to its ability to produce a very low H2S level gas under moderate conditions.7 So far, several types of adsorbents such as zeolites, activated carbons, metal organic frameworks, clays and molecular sieves have been investigated in dry adsorption of H2S.8,9 However, low sulfur capacity and selectivity of these unmodified adsorbents requires frequent regeneration of spent adsorbents.10 In this concern, developing an adsorbent with a high sulfur capacity to achieve the targeted removal and a long lifetime are of great important.11 Metal oxides, such as iron, zinc, manganese, copper and calcium oxides, have been widely investigated for H2S removal.12–14 Metal oxides adsorb H2S via a chemical reaction, which produces a metal sulfide. However, using metal oxides directly in their pure forms has several drawbacks. The main drawbacks are the difficult recovering and reusability properties, low adsorption properties owing to the low surface area and poor mass transfer ability of metal oxides, which limits their application for H2S removal. An effective way to address the above drawbacks is to support metal oxides on high surface supports.15 Therefore, transition metal oxides loaded on proper supports have been widely investigated.16 The MCM-41 is commonly used as support in catalyst field, due to its high surface area, tunable pore diameter and large pore volume.17,18 However, unmodified MCM-41 is poor in desulfurization due to the main adsorption way of which is physical adsorption. In this regard, supporting active metal oxide on MCM-41 porous materials is expected to be an effective way to take full advantages of metal oxides and MCM-41.10,19
It is well known that loading method would greatly affect the dispersion of metal oxide on surface of support, which in turn affect its H2S removal performance.20 Ultrasonic assisted impregnation (UAI) has recently received much attention as its unique dispersion properties. The dispersion of active metal oxides on surface of support can be greatly improved by using this technique because ultrasonic wave can produce a powerful microjet flow through its “cavitation effect”, which in turn produce a great impact on the support.21 In addition, the harsh operating conditions (such as high temperatures), which usually needed to achieve a better dispersion for traditional mechanical stirring impregnation (TMI) methods, are not required. Mi et al.22 reported that as compared to TMI method, metal oxides can more evenly be dispersed in char when the UAI technology was applied.
Cobalt oxide, as well as its based composites, was investigated extensively as potential materials in many fields.23 Silas et al.24 synthesized activated carbon monolith supported tricobalt tetraoxide (Co3O4) adsorbent (Co3O4/ACM) for simultaneous SO2/NOx removal from flue gas and found that the Co3O4/ACM adsorbent exhibited a high affinity to NOx adsorption. Therefore, it is reasonable to expect that combining the advantage of Co3O4 and high surface mesoporous MCM-41, coupled with UAI technology, might yield unexpected adsorbent for efficient H2S removal. However, to the best of our knowledge, adsorbents based on Co3O4 supported on MCM-41 prepared by UAI for the H2S removal from natural gas have not been reported. Therefore, we believe that Co3O4/MCM-41 adsorbent prepared by UAI method is worth studying.
In the present work, Co3O4/MCM-41 was prepared by UAI and TMI technologies, and their adsorptive removal performances for a simulated low H2S concentration gas were investigated. As expected, Co3O4/MCM-41 prepared by UAI technology exhibited much higher surface area and H2S removal performance. In addition, the effect of preparation and adsorption conditions on the H2S removal performance of Co3O4/MCM-41 were systematically examined.
2 Experimental
2.1 Adsorbents preparation
The cobalt oxide supported mesoporous MCM-41 was prepared by ultrasonic assisted impregnation (UAI) method (Scheme 1). First, 1 g of precalcined MCM-41 (all-silicon, Nankai University Catalyst Factory) was dispersed in 25 mL cobalt nitrate (Co(NO3)2·6H2O) solution with cobalt nitrate concentration of 10% and treated by ultrasonic wave for 2 h. The suspension was then filtered and washed with ethanol (Haerbin Chemical Reagent Company) and distilled water in turn, followed by drying in the oven at 110 °C for 12 h. Then the solid was transferred to muffle furnace and calcined at 550 °C for 3 h. The obtained sample named as Co3O4/MCM-41-U, where U means prepared by UAI method. For comparison, the Co3O4/MCM-41 was also prepared by traditional impregnation (mechanical stirring for 24 h) method (TMI) with other conditions remained unchanged, which denoted as Co3O4/MCM-41-T. The Co3O4/MCM-41-U samples were also prepared at different conditions by varying the cobalt nitrate concentration (5%, 8%, 10%, 13% and 15%), ultrasound time (1.5 h, 2 h, 2.5 h and 3 h), calcination temperature (350 °C, 450 °C, 550 °C and 650 °C)and time (2 h, 3 h, 4 h and 5 h).
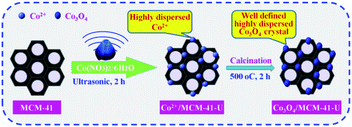 |
| | Scheme 1 Schematic diagram for the synthesis of Co3O4/MCM-41-U via ultrasonic assisted impregnation. | |
2.2 Characterization
The X-ray diffraction (XRD) measurement and analysis were obtained from X-ray diffractometer (a D/max-2200PC-X-ray diffractometer) by using Cu Kα radiation conducted at 40 kV, 30 mA, and a scan range from 10° to 80° at a rate of 10° min−1. The typical physicochemical properties of the supports and catalysts were analyzed were analyzed by N2-adsorption specific surface area measurements using the Brunauer–Emmett–Teller (BET, Micromeritics, NOVA 2000e: Surface Area & Pore Size Analyzer). The Fourier transform infrared spectra (FT-IR) of the catalysts were recorded with a Brook Tensor 27 Fu Liye infrared spectrometer in the optical range of 400–4000 cm−1. The thermal stability of adsorbent was analyzed by (TG-DTA DuPont 2100) with heating rate: 10 K min−1 under the protect flow of 20 mL min−1. The reducibility of precursors was characterized by the H2 temperature-programmed reduction (H2-TPR) using (CHEMBET-3000, Quantachrome) a quartz U-tube reactor (inner diameter of 6 mm). Reduction was conducted at a heating rate of 10 K min−1 in a 5 vol% H2/N2 flow (30 mL min−1).
2.3 Fixed-bed ADS experiment
Measurements of adsorbent activity were conducted in a fixed-bed reactor (Scheme 2). The fixed-bed reactor (a quartz glass tube with diameter of 10 mm and length of 300 mm) placed vertically in a furnace. Typically, 0.2 g adsorbent was loaded into the reactor. The model fuel gas (H2S, N2 and O2 mixture; N2 as balance gas; the H2S concentration was 20 mg L−1) from a feed tank passed through a reducing valve and entered into the reactor at a flowrate of 20 mL min−1. Any unadsorbed H2S gas in the effluent gas would be absorbed by the liquid in the absorption bottle, and the H2S content of the absorption liquid was determined by iodometry at intervals of 5 min. The saturated H2S capacity and H2S removal rate of the absorbent were calculated by the analysis of H2S breakthrough curves.
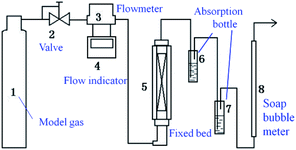 |
| | Scheme 2 Schematic diagram of the experimental apparatus. | |
The saturated H2S capacity is defined as the amount of adsorbed H2S per gram of adsorbent when the H2S concentrations in the effluent and in the initial gas are the same. It can be calculated as follows.10
| |
 | (1) |
where
qm is the saturated H
2S capacity, mg g
−1;
ω is the H
2S concentration in the model gas, mg L
−1;
V is the total gas volume, L;
c is the concentration in mol L
−1;
v is the volume in L;
m is amount of adsorbent, g; and 34 is the molar mass of H
2S in g mol
−1.
The H2S removal rate η can be expressed as
| |
 | (2) |
2.4 Calculation of mass transfer zone
The mass transfer zone (MTZ) can be defined as the following equation:25| |
 | (3) |
where MTZ is the mass transfer zone with the unit of mm; τa is the breakthrough time to reach c/c0 = 0.10; τe is the saturated adsorption time to reach c/c0 = 0.95; Zo stands for the height of fixed bed column with the unit of mm (300 mm in this study).
3 Results and discussion
3.1 Characterization of adsorbents
3.1.1 XRD. As can be seen in Fig. 1, all the samples showed a strong broad peak at 2θ = 15–30° due to the amorphous nature of mesoporous MCM-41, showing the mesopores of MCM-41 were retained after successive impregnation and high temperature calcination.26,27 The Co3O4/MCM-41-T which prepared by traditional impregnation (TMI) method showed diffraction peaks at 2θ = 36.8°, 44.8°, 59.3° and 65.2°, which corresponded the cubic phase Co3O4 lattice planes of (311), (400), (511) and (440) [PDF # 23-1003]28, respectively. For the Co3O4/MCM-41-U which obtained via ultrasonic assisted impregnation (UAI) method, the diffraction peaks at 2θ = 19°, 31.27°, 36.8°, 38.5°, 44.8°, 55.6°, 59.3° and 65.2° were observed, which can be assigned to the cubic phase Co3O4 lattice planes of (111), (220), (311), (222), (400), (422), (511) and (440), respectively.29 This demonstrated that the cobalt oxide obtained by calcination the precursor was Co3O4 phase. It is interesting to note that all the diffraction peaks of the as-synthesized Co3O4 can be seen for Co3O4/MCM-41-U, but some peaks were disappeared for Co3O4/MCM-41-U, showing the UAI produce more and well defined regularly sorted Co3O4 crystal phase.
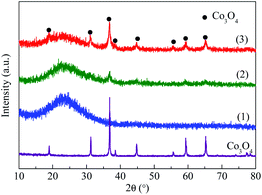 |
| | Fig. 1 XRD patterns of blank MCM-41 and adsorbents prepared by different methods. (1) MCM-41, (2) Co3O4/MCM-41-T and (3) Co3O4/MCM-41-U. | |
3.1.2 BET. The nitrogen adsorption isotherms, pore size distributions and textural properties of MCM-41, Co3O4/MCM-41-T and Co3O4/MCM-41-U are shown in Fig. 2 and Table 1. According to the new IUPAC technical report,30 the isotherms of the these three samples identified as type IV isotherms, which is characteristic of microporous materials. And the hysteresis loop is classified as H1 type, which corresponds to the tubular pore model with openings at both ends.31 However, the inflection pressure and the slope of these curves at each stage are somewhat different after loading of Co3O4. From the position of the hysteresis loop appeared, the average diameter of the pores can be estimated approximately 3 nm, which was consistent with the average pore diameter of 3.74, 2.75 and 2.93 nm (see Table 1), respectively. The low pressure hysteresis loop can be considered to be caused by capillary condensation of N2 in the straight channel of MCM-41 itself.32 The high pressure hysteresis loop may be caused by capillary condensation of N2 between interparticles of MCM-41.33 For Co3O4/MCM-41-T and Co3O4/MCM-41-U, the hysteresis loop within the p/p0 range of 0.45–0.65 indicates the ordered structure and uniform mesoporous channel of the MCM-41 were retained after loading of Co3O4. These results are consistent with the XRD results. As can be seen from Fig. 2 that the pores of blank MCM-41 were ranged in 2–5 nm. Upon loading of Co3O4 on MCM-41, the pore size decreased, showing the Co3O4 entered into the pores. The specific surface area and pore volume of blank MCM-41 were up to 1095.2 m2 g−1 and 1.22 cm3 g−1 (Table 1). The loading of Co3O4 caused the decrease in specific surface area and pore volume. However, the decrease was less severe for Co3O4/MCM-41-U than that of Co3O4/MCM-41-T, which possibly because the UAI promotes evenly dispersed small Co3O4 particles on surface of the MCM-41.21
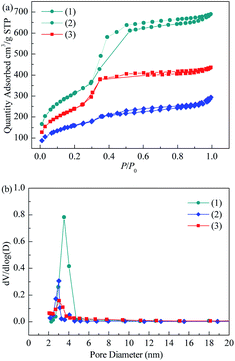 |
| | Fig. 2 N2 adsorption–desorption isotherm (a) and BJH pore size distribution (b) of blank MCM-41 and adsorbents prepared by different methods. | |
Table 1 The pore structures of blank MCM-41 and adsorbents prepared by different methods
| Sample |
Surface area (m2 g−1) |
Pore volume (cm3 g−1) |
Pore diameter (nm) |
| MCM-41 |
1140.7 |
1.07 |
3.74 |
| Co3O4/MCM-41-T |
648.6 |
0.45 |
2.75 |
| Co3O4/MCM-41-U |
919.2 |
0.67 |
2.93 |
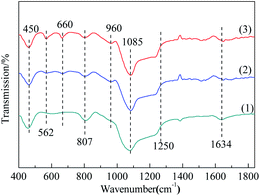
3.1.3 FT-IR. The surface functional groups on the samples were examined by Fourier-transform infrared (FTIR) spectra (Fig. 3). The similarity of the FTIR spectra of these three samples, featured the absorption peaks at the same wavelengths, showed that the types of functional groups of MCM-41 were basically remained after modification.34 For MCM-41, the peak appeared at 1634 cm−1 can be attributed to physically adsorbed water. However, the intensity of this peak was reduced for Co3O4/MCM-41-T and Co3O4/MCM-41-U, showing the loss of water.35 The characteristic peaks at 450, 807, 1085 and 1250 cm−1 is classified as the vibration of Si–O–Si.36 For Co3O4/MCM-41-T and Co3O4/MCM-41-U, a new absorption peaks appeared at 960 cm−1 as compared to the blank MCM-41. For the appearance of this shoulder peak, two different points of view have been proposed. Some researchers suggested that it is owing to the introduction of the heteroatom in the skeleton, while others suggested that it is owing to the asymmetry of the partial skeleton structure arising from defect sites.37 Moreover, the new absorption peaks appeared at 660 cm−1 and 562 cm−1 belong to the stretching vibration of spinel phase Co–O in Co3O4,38,39 which confirms the formation of Co3O4. It should be noted that the intensities of these two peaks of Co3O4/MCM-41-U were obviously stronger than those of Co3O4/MCM-41-T, showing UAI promotes formation of more Co3O4 crystal active phase.
 |
| | Fig. 3 The H2-TPR profiles of blank MCM-41 and adsorbents prepared by different methods. (1) MCM-41, (2) Co3O4/MCM-41-T and (3) Co3O4/MCM-41-U. | |
3.1.4 TG-DTA. The TG-DTA curve of Co3O4/MCM-41-U is shown in Fig. 4. For temperature range of 0–150 °C, the TG curve showed a weight loss of 14.3%, which corresponds to a strong endothermic peak in DTA curve. This weight loss can be assigned to the elimination of adsorbed water from the surface and pores.40 While for the temperature range of 150–260 °C, the TG curve exhibited a weight loss of 18.7%, which corresponds to a sharp exothermal peak in DTA curve. This weight loss can be assigned to the decomposition of Co(NO3)2 in precursor to Co3O4. For the temperature higher than 260 °C to 650 °C, the weigh loss became extremely slow (6.3%). This weight loss can be assigned to the sintering or decomposition of components and dehydration of adsorbent at high temperature.41
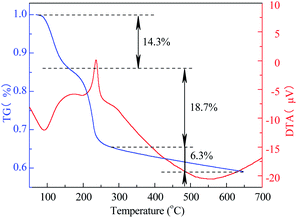 |
| | Fig. 4 TG-DTA curves of Co3O4/MCM-41 precursor without calcination. | |
3.1.5 TPR. Fig. 5 shows the H2-TPR curves of these three samples. It can be observed that two reduction peaks presented at temperature range of 100–600 °C. The reduction peak at lower temperature of 354 °C can be ascribed to the H2 consumption due to the reduction of Co3O4 to CoO, while the reduction peak at higher temperature of 383 °C can be ascribed to the H2 consumption owing to the reduction of CoO to Co.42 The corresponding reduction reactions are shown as follows:| | |
Co3O4 + H2 = 3CoO + H2O
| (4) |
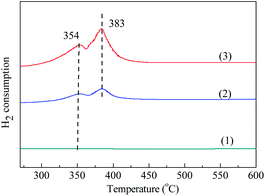 |
| | Fig. 5 The H2-TPR profiles of blank MCM-41 and adsorbents prepared by different methods. (1) MCM-41, (2) Co3O4/MCM-41-T and (3) Co3O4/MCM-41-U. | |
It should be noted that the intensity of these two peaks of Co3O4/MCM-41-U was obviously stronger than those of Co3O4/MCM-41-T, showing UAI promotes formation of more Co3O4 crystal active phase. This observations are consistent with the results obtained in the FT-IR.
3.2 Adsorptive desulfurization
3.2.1 Effect of preparation methods. The adsorbents were evaluated at 25 °C with model gas flowrate of 20 mL min−1 in the fixed-bed reactor using 0.2 g of adsorbent (Fig. 6). It can be seen that the breakthrough time of blank MCM-41 is the shortest. Upon loading of Co3O4 on MCM-41, the breakthrough time extended, showing loading of Co3O4 can enhance the H2S removal efficiency. The saturated H2S capacity of adsorbent showed similar tends. The saturated H2S capacity of Co3O4/MCM-41-T and Co3O4/MCM-41-U were 18.4 and 24.5 mg g−1, respectively, which are increased by 23.5% and 64.4% as compared to that of the original MCM-41. It should be noted that the Co3O4/MCM-41-U prepared via UAI showed a better H2S removal performance than that of Co3O4/MCM-41-T prepared via TMI. This is possibly because UAI promotes more and well defined highly dispersed active Co3O4 phase (see XRD, FT-IR and TPR analysis) loading on the MCM-41 due to its “cavitation effect”, and therefore would lead to a higher H2S removal efficiency (Scheme 3). Moreover, Co3O4/MCM-41-U possessed a higher surface area (BET analysis) as compared to that of Co3O4/MCM-41-T, which facilitate exposure more active sites to H2S. The similar results were observed by Dou,21 who found that Fe–Zn supported on activated-char via UAI showed much better performance than that via TMI. They explained that UAI enhanced the chemical reaction and mass transfer via acoustic cavitation during preparation process,43 which can improve the H2S removal performance. The H2S removal performance of the adsorbents decreased in the order of Co3O4/MCM-41-U > Co3O4/MCM-41-T > MCM-41.
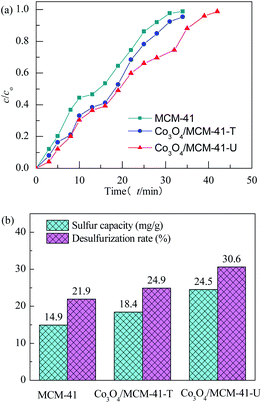 |
| | Fig. 6 H2S breakthrough curves (a) and saturated H2S capacity and desulfurization rate (b) of samples prepared by different methods. | |
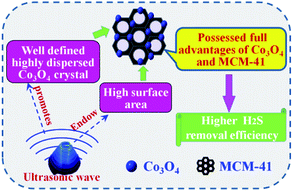 |
| | Scheme 3 Explanation for the improved H2S removal efficiency over Co3O4/MCM-41-U. | |
3.2.2 Effect of preparation conditions. All of the adsorbents were evaluated at adsorption temperature of 25 °C with model gas flowrate of 20 mL min−1 in the fixed-bed reactor using 0.2 g of adsorbent in this section. The effect of concentration of Co(NO3)2 on performance of H2S removal over Co3O4/MCM-41-U is shown in Fig. 7. With increasing the concentration of Co(NO3)2, the breakthrough and saturated adsorption time both increased first and then decreased, reached the maximums at Co(NO3)2 concentration of 10%, which are 7 min and 53 min, respectively. This is possibly because that for the very low Co(NO3)2 concentration, the loading of active Co3O4 on adsorbent would be low, which in turn led to a poor H2S adsorption. However, with an excess of active Co3O4 loading, the agglomeration of Co3O4 and blockage of some pores of adsorbent would occur, which could decrease the H2S removal performance. The saturated H2S capacity and desulfurization rate of adsorbents exhibited the similar trends, which shows the maximum saturated H2S capacity and desulfurization rate of 38.7 and 45.1%, respectively, at Co(NO3)2 concentration of 10%.
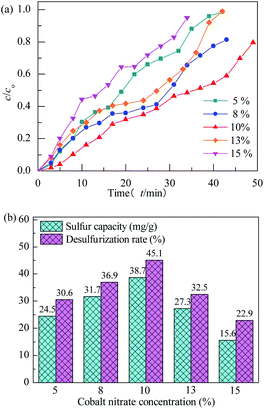 |
| | Fig. 7 H2S breakthrough curves (a) and saturation sulfur capacity and desulfurization rate (b) of Co3O4/MCM-41-U prepared using different cobalt nitrate concentration. | |
The effect of ultrasonic time on performance of H2S removal over Co3O4/MCM-41-U with Co(NO3)2 concentration of 10% remained unchanged is shown in Fig. 8. With increasing the ultrasonic time, the breakthrough and saturated adsorption time both increased first and then decreased, reached the maximums at ultrasonic time of 2 h, which are 7 min and 53 min, respectively. Ultrasonic wave, can produce a powerful microjet flow via its “cavitation effect”, which in turn can produce a great impact on the support. As a results, the active components can be more evenly dispersed in the support channel, and thus UAI improves the H2S removal activity. However, when ultrasonic time is too long, it would causes a local accumulation of Co species at the standing wave node of ultrasonic and lead to a poor dispersion of active Co3O4 on support, which in turn decreases the H2S removal performance. The saturated H2S capacity and desulfurization rate of adsorbents exhibited the similar trends, which shows the maximum saturated H2S capacity and desulfurization rate of 38.7 and 45.1%, respectively, at ultrasonic time of 2 h.
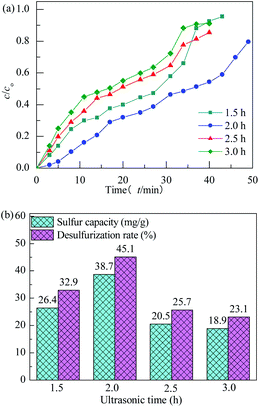 |
| | Fig. 8 H2S breakthrough curves (a) and saturation sulfur capacity and desulfurization rate (b) of Co3O4/MCM-41-U prepared at different ultrasonic times. | |
The effect of calcination temperature on performance of H2S removal over Co3O4/MCM-41-U with Co(NO3)2 concentration of 10% and ultrasonic time of 2 h remained unchanged is shown in Fig. 9. With increasing the calcination temperature, the breakthrough and saturated adsorption time both increased first and then decreased, reached the maximums at calcination temperature of 550 °C, which are 7 min and 53 min, respectively. The calcination is a thermal treatment process which will bring about a thermal decomposition, phase transition, or removal of a volatile fraction. The TG-DTA analysis is evident that the decomposition of Co(NO3)2 occurred between 150–260 °C and continued weight loss till 650 °C owing to the sintering or decomposition of components at high temperature. From XRD analysis, it can be known that at 550 °C, the metal oxide was well defined Co3O4 crystal phase, which is high in activity. Further increase the calcination temperature would cause the sintering, which would lead to an aggregation of active Co3O4 and thus poor H2S removal efficiency.44 The saturated H2S capacities of the adsorbents decreased in the order: 550 °C > 450 °C > 650 °C > 350 °C. The calculated values were 38.7, 26.2, 26.1 and 23.5 mg g−1, respectively. The saturated H2S capacity and desulfurization rate of adsorbents exhibited the similar trends, which shows the maximum saturated H2S capacity and desulfurization rate of 38.7 and 45.1%, respectively, at calcination temperature of 550 °C.
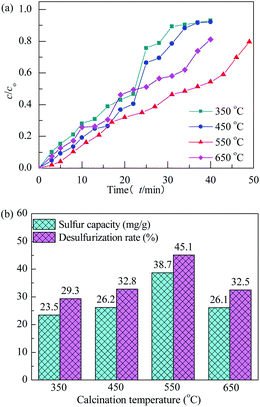 |
| | Fig. 9 H2S breakthrough curves (a) and saturation sulfur capacity and desulfurization rate (b) of Co3O4/MCM-41-U prepared at different calcination temperatures. | |
The effect of calcination time on performance of H2S removal over Co3O4/MCM-41-U with Co(NO3)2 concentration of 10%, ultrasonic time of 2 h and calcination temperature of 550 °C remained unchanged is shown in Fig. 10. With increasing the calcination time, the breakthrough and saturated adsorption time both increased first and then decreased, reached the maximums at calcination time of 3 h, which are 7 min and 53 min, respectively. Similar to the effect of calcination temperature the overlong calcination time would lead to an aggregation of active Co3O4 and reduce exposed active sites, thus exhibit a poor H2S removal efficiency. The saturated H2S capacity and desulfurization rate of adsorbents exhibited the similar trends, which shows the maximum saturated H2S capacity and desulfurization rate of 38.7 and 45.1%, respectively, at calcination time of 3 h.
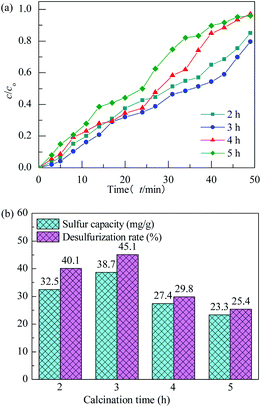 |
| | Fig. 10 H2S breakthrough curves (a) and saturation sulfur capacity and desulfurization rate (b) of Co3O4/MCM-41-U prepared at different calcination times. | |
3.2.3 Effect of adsorption conditions. The Co3O4/MCM-41-U was prepared using Co(NO3)2 concentration of 10%, ultrasonic time of 2 h, calcination temperature of 550 °C and calcination time of 3 h. The effect of adsorption time on performance of H2S removal of Co3O4/MCM-41-U was evaluated at model gas flowrate of 20 mL min−1 in the fixed-bed reactor using 0.2 g of adsorbent (Fig. 11). With increasing the adsorption temperature, the breakthrough and saturated adsorption time both increased first and then decreased, reached the maximum at adsorption temperature of 45 °C (10 min). The breakthrough time at different adsorption temperatures was decreased in the order of 45 °C > 35 °C > 25 °C > 55 °C > 65 °C. This is because at excessive low adsorption temperature, the H2S adsorbed onto adsorbent mainly via week van der Waals force by physical adsorption, which is usually reversible without selectivity. With increasing the adsorption temperature, the system temperature is able to provide enough energy to activate H2S molecules, and the chemical adsorption via the strong chemical bond gradually became the predominant adsorption mode. As a results, a much improved H2S removal efficiency was observed. The saturated H2S capacity and desulfurization rate of adsorbents exhibited the similar trends, which shows the maximum saturated H2S capacity and desulfurization rate of 52.6 and 47.8%, respectively, at adsorption temperature of 45 °C.
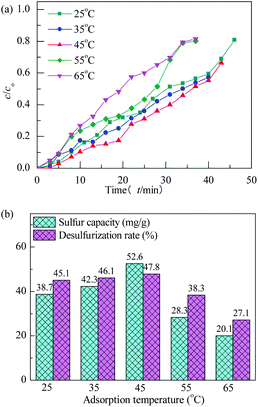 |
| | Fig. 11 H2S breakthrough curves (a) and saturation sulfur capacity and desulfurization rate (b) of Co3O4/MCM-41-U at different adsorption temperatures. | |
The effect of model gas flowrate on performance of H2S removal over Co3O4/MCM-41-U is evaluated at adsorption temperature of 45 °C in the fixed-bed reactor using 0.2 g of adsorbent (Fig. 12). With increasing the model gas flowrate, the breakthrough and saturated adsorption time both decreased, showing that increasing the gas flowrate would decrease the H2S removal efficiency. This is understandable because the increase of gas flowrate, can eliminate the influence of external diffusion, but reduces the residence time of H2S molecules in the fixed bed, which could cause some of the H2S molecules are take away by the rapid flow before they are adsorbed onto adsorbent. In other words, the contact between H2S molecules and adsorbent is inadequate, as a results, a decrease in the breakthrough and saturated adsorption time H2S removal efficiency with increasing gas flowrate was observed. Therefore, appropriate gas flowrate is beneficial to H2S purification. The saturated H2S capacity and desulfurization rate of adsorbents exhibited the similar trends, which shows the maximum saturated H2S capacity and desulfurization rate of 52.6 and 47.8%, respectively, at gas flowrate of 20 mL min−1. The breakthrough time (τa) and saturated adsorption time (τe) were 10 min and 50 min at gas flowrate of 20 mL min−1. It can be calculated by eqn (3) that for this situation, the mass transfer zone (MTZ) of Co3O4/MCM-41-U is about 240 mm.
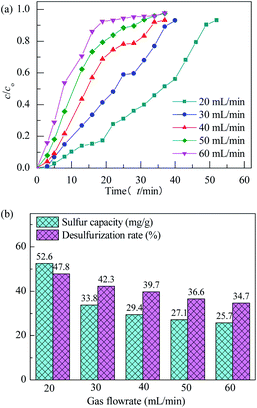 |
| | Fig. 12 H2S breakthrough curves (a) and saturation sulfur capacity and desulfurization rate (b) of Co3O4/MCM-41-U at different gas flowrates. | |
3.2.4 Adsorption mechanism. Watanabe et al.4 proposed that at ambient temperature H2S removal from natural gas underwent through weak chemisorption over the activated carbon and zeolite/molecular sieve, while for metal oxides, such as ZnO, CuO, and Fe2O3, underwent through a dissociative chemisorption. Based on the reported adsorption mechanisms44,45 and our previous study,46 a possible mechanism of H2S removal over Co3O4/MCM-41-U adsorbent can be described by the following steps (Scheme 4): (1) H2S molecules are adsorbed over Co3O4/MCM-41-U surface. (2) Dissociation of H2S into H+ and HS− or S2− on Co3O4 active sites (eqn (5) and (6)); (3) subsequently sulfidation of the active Co3O4 by HS− or S2− leads to the formation of cobalt sulfide and water at the surface of adsorbent (eqn (7) and (8)).| | |
Co3O4 + 4HS− + 4H+ = Co3S4 + 4H2O
| (8) |
| | |
Co3O4 + 4S2− + 4H+ = Co3S4 + 4H2O
| (9) |
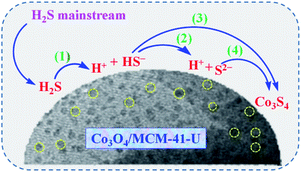 |
| | Scheme 4 Possible mechanism for the H2S removal over Co3O4/MCM-41-U. | |
Formation of cobalt sulfide at the surface layers incorporating eqn (7) and (8)
| | |
Co3O4 + 4H2S = Co3S4 + 4H2O
| (10) |
3.2.5 Regeneration studies. Regeneration was performed in situ. Typically, the fixed-bed reactor with deactivated Co3O4/MCM-41-U was purged in a flowing nitrogen gas at 200 °C for 3 h and then cool down to the adsorption temperature. Relation between regeneration times and desulfurization performance of Co3O4/MCM-41-U is shown in Table 2. The breakthrough time of Co3O4/MCM-41-U after 2 times of regeneration decreased from 10.0 min to 9.1 min, which recovered by 91.0%. The recovered saturated H2S capacity of Co3O4/MCM-41-U after 2 times of regeneration was 42.1 mg g−1, still much higher than that of MCM-41, showing that the Co3O4/MCM-41-U possessed a good regenerability performance.
Table 2 Relation between regeneration times and desulfurization performance of Co3O4/MCM-41-U
| Regeneration times |
0 |
1 |
2 |
| Breakthrough time (min) |
10.0 |
9.6 |
9.1 |
| Saturated H2S capacity (mg g−1) |
52.6 |
47.8 |
42.1 |
| H2S removal rate (%) |
47.8 |
46.3 |
42.1 |
4 Conclusions
The Co3O4/MCM-41 adsorbents were successfully prepared by UAI and TMI technologies. XRD result demonstrated that UAI method promotes more and well defined highly dispersed active Co3O4 phase on MCM-41. All the adsorbents retained the mesoporous nature of MCM-41 with average pore diameter ranged in 2.75 to 374 nm after loading of Co3O4. The Co3O4/MCM-41-U which prepared via UAI method possessed much higher BET specific surface area and pore volume than those of Co3O4/MCM-41-T which prepared via TMI method. The fixed-bed adsorption desulfurization experiments showed H2S removal was improved by loading Co3O4, showing that supporting active metal oxide on MCM-41 porous materials can take full advantages of metal oxides and MCM-41. The desulfurization performances decreased in the order of Co3O4/MCM-41-U > Co3O4/MCM-41-T > MCM-41. The Co3O4/MCM-41-U prepared using Co(NO3)2 concentration of 10%, ultrasonic time of 2 h, calcination temperature of 550 °C and calcination time of 3 h exhibited the best H2S removal efficiency. At adsorption temperature of 25 °C with model gas flowrate of 20 mL min−1, the breakthrough time of Co3O4/MCM-41-U was 10 min, and the saturated H2S capacity and H2S removal rate were 52.6 mg g−1 and 47.8%, respectively.
Conflicts of interest
The authors declared that they have no conflicts of interest to this work.
Acknowledgements
This work was supported by the National Natural Science Foundation of China (21276048).
References
- A. S. Camara, S. F. Lütke, C. P. Pinheiro, M. L. G. Vieira, T. R. S. A. Cadaval Jr and L. A. A. Pinto, Environ. Sci. Pollut. Res., 2020 DOI:10.1007/s11356-020-09924-5.
- M. L. G. Vieira, C. P. Pinheiro, K. A. Silva, S. F. Lutke, T. R. S. A. Cadaval, G. Dotto and L. A. A. Pinto, Chem. Eng. Commun., 2019, 11, 1474–1486 CrossRef.
- G. Basina, D. A. Gaber, S. A. Yafei, V. Tzitzios, S. A. Gaber, I. Ismail, B. V. Vaithilingam, K. Polychronopoulou, S. A. Hashimi and Y. A. Wahedi, Chem. Eng. J., 2020, 398, 125585 CrossRef CAS.
- S. Watanabe, Catal. Today, 2020 DOI:10.1016/j.cattod.2020.05.064.
- S. Moioli, A. Giuffrida, M. C. Romano, L. A. Pellegrini and G. Lozza, Appl. Energy, 2016, 183, 1452–1470 CrossRef CAS.
- S. J. Majeed, J. Nat. Gas Sci. Eng., 2016, 36, 175–183 CrossRef.
- M. S. Shah, M. Tsapatsis and J. I. Siepmann, Chem. Rev., 2017, 117, 9755–9803 CrossRef CAS PubMed.
- A. Peluso, N. Gargiulo, P. Aprea, F. Pepe and D. Caputo, Sep. Purif. Rev., 2018, 48(1), 1–12 Search PubMed.
- S. Louhichi, A. Ghorbel, H. Chekir, N. Trabelsi and S. Khemakhem, Appl. Clay Sci., 2016, 127, 123–128 CrossRef.
- J. Zhang, H. Song, Y. Chen, T. Hao, F. Li, D. Yuan, X. Wang, L. Zhao and J. Gao, RSC Adv., 2018, 66, 38124–38130 RSC.
- M. M. Wu, L. Shi, W. Su, T. T. Lim, A. Vedsha, F. Yu, H. L. Fan and J. Mi, Chem. Eng. J., 2018, 353, 273–287 CrossRef CAS.
- A. Pourreza, S. Askari, A. Rashidi, A. Seif and M. Kooti, Chem. Eng. J., 2019, 363, 73–83 CrossRef CAS.
- M. M. Wu, T. Li, H. Y. Li, H. L. Fan and J. Mi, Energy Fuels, 2017, 31, 13921–13932 CrossRef CAS.
- M. M. Wu, B. W. Chang, T. T. Lim, W. D. Oh, J. X. Lei and J. Mi, J. Hazard. Mater., 2018, 360, 391–401 CrossRef CAS PubMed.
- H. K. Jun, T. J. Lee, S. O. Ryu and J. C. Kim, Ind. Eng. Chem. Res., 2001, 40, 3547–3556 CrossRef CAS.
- Z. B. Huang, B. S. Liu, F. Wang and R. Amin, Appl. Surf. Sci., 2015, 353, 1–10 CrossRef CAS.
- A. S. Khder, H. Hma and M. S. Elshall, Appl. Catal., A, 2012, 411, 77–86 CrossRef.
- F. Farjadian, P. Ahmadpour, S. M. Samani and M. Hosseini, Microporous Mesoporous Mater., 2015, 213, 30–39 CrossRef CAS.
- T. Yasmin and K. Müller, Microporous Mesoporous Mater., 2015, 208, 83–92 CrossRef CAS.
- S. Bennici, A. Gervasini and V. Ragaini, Ultrason. Sonochem., 2003, 10, 61–64 CrossRef CAS PubMed.
- J. Dou, J. Yu, A. Tahmasebi, F. Yin, S. Gupta, X. Li, J. Lucas, C. Na and T. Wall, Fuel Process. Technol., 2015, 135, 187–194 CrossRef CAS.
- J. Mi, J. Ren and Y. Zhang, Environ. Eng. Sci., 2012, 29, 1026–1031 CrossRef CAS PubMed.
- M. R. AbuKhadra, A. S. Mohamed, A. M. El-Sherbeeny and M. A. Elmeligy, J. Hazard. Mater., 2020, 389, 122129 CrossRef CAS PubMed.
- K. Silas, W. A. W. A. K. Ghani, T. S. Y. Choong and U. Rashid, Fuel Process. Technol., 2018, 180, 155–165 CrossRef CAS.
- R. Apiratikul, Process Saf. Environ. Prot., 2020, 137, 58–65 CrossRef CAS.
- J. A. Cecilia, A. Infantes-Molina, E. Rodríguez-Castellón and A. Jiménez López, Appl. Catal., B, 2009, 92(1), 100–113 CrossRef CAS.
- H. Song, J. Gong, H. Song and F. Li, Appl. Catal., A, 2015, 505, 267–275 CrossRef CAS.
- P. V. Suraja, Z. Yaakob, N. N. Binitha, S. Triwahyono and P. P. Silija, Clean Technol. Environ., 2013, 15(6), 967–975 CrossRef CAS.
- X. Chen, Y. Chen, X. Luo, H. Guo, N. Wang, D. Su, C. Zhang, T. Liu, G. Wang and L. Cui, Appl. Surf. Sci., 2020, 526, 146626 CrossRef CAS.
- M. Thommes, K. Kaneko, A. V. Neimark, J. P. Olivier, F. Rodriguez-Reinoso, J. Rouquerol and K. S. W. Sing, Pure Appl. Chem., 2015, 87, 1051–1069 CAS.
- X. Wang, X. Ma, L. Sun and C. Song, Green Chem., 2007, 9, 695–702 RSC.
- X. Chen, X. L. Wang, G. Ran, Z. Cui, S. H. Chen and K. Xie, Fine Chem., 2016, 33(2), 188–194 CAS.
- H. Zhao, J. Hu, J. Wang, L. Zhou and H. Liu, Acta Phys.-Chim. Sin., 2007, 23, 801–806 CrossRef CAS.
- A. Cecilia, Appl. Catal., B, 2009, 92(92), 100–113 CrossRef.
- Z. Liu, Y. Teng and K. Zhang, J. Energy Chem., 2015, 24, 322–330 CrossRef.
- B. Pejova, A. Isahi, M. Najdoski and I. Grozdanov, Mater. Res. Bull., 2001, 36, 161–170 CrossRef CAS.
- Y. Li, X. Guo, G. Zhou, X. Lu, T. Cheng, T. Wu and K. Zhen, Chin. J. Catal., 2005, 07, 591–596 Search PubMed.
- C. Y. Chen, H. X. Li and M. E. Davis, Microporous Mater., 1993, 2(1), 17–26 CrossRef CAS.
- X. Wang, J. Jia, L. Zhao and T. Sun, Water, Air, Soil Pollut., 2008, 193(1–4), 247–257 CrossRef CAS.
- J. Goworek, A. Borowka, R. Zaleski and R. Kusak, J. Therm. Anal. Calorim., 2005, 79, 555–560 CrossRef CAS.
- H. Liu and S. K. Yen, J. Power Sources, 2007, 166, 478–484 CrossRef CAS.
- F. Wyrwalski, J. F. Lamonier, M. J. Pere-zurita, S. Siffert and A. Aboukaïs, Catal. Lett., 2006, 108(1–2), 87–95 CrossRef CAS.
- A. Gedanken, Ultrason. Sonochem., 2004, 11, 47–55 CrossRef CAS PubMed.
- J. Zhang, G. Wang, W. Wang, H. Song and F. Li, Res. Chem. Intermed., 2016, 42, 6003–6012 CrossRef CAS.
- E. Laperdrix, G. Costentin, O. Saur, J. C. Lavalley, C. Nédez, S. Savin-Poncet and J. Nougayrède, J. Catal., 2000, 189, 63–69 CrossRef CAS.
- H. Fang, J. Zhao, Y. Fang, J. Huang and Y. Wang, Fuel, 2013, 108, 143–148 CrossRef CAS.
|
| This journal is © The Royal Society of Chemistry 2020 |
Click here to see how this site uses Cookies. View our privacy policy here.  Open Access Article
 *a,
Jiaojing Zhang
 b,
Yanguang Chenb,
Hua Song
 *b,
Tianzhen Haoc and
Junhu Kuangd


