 Open Access Article
New insights into the beneficial roles of dispersants in reducing negative influence of Mg2+ on molybdenite flotation
Yubiao Li *ab,
Xu Yanga,
Jiali Fua,
Wanqing Lia and
Chenglong Hua
aSchool of Resources and Environmental Engineering, Wuhan University of Technology, Wuhan 430070, Hubei, China. E-mail: Xu.Yang@whut.edu.cn; Jiali.Fu@whut.edu.cn; Wanqing.Li@whut.edu.cn; 2578399685@qq.com
bHubei Key Laboratory of Mineral Resources Processing & Environment, Wuhan University of Technology, Wuhan, 430070, Hubei, China. E-mail: Yubiao.li@whut.edu.cn
First published on 21st July 2020
Abstract
Due to the shortage of freshwater, seawater has been widely considered for mineral flotation. However, the presence of Mg2+ in seawater plays an apparently negative role. In this work, two dispersants (i.e., sodium silicate (SS) and sodium hexametaphosphate (SH)) were applied to reduce the detrimental effects of Mg2+ on the flotation of molybdenite (MoS2). Various measurements including contact angle, zeta potential, FTIR and XPS were carried out to understand the impacts of these two dispersants on MoS2 flotation. Results indicate that both dispersants prevented the adsorption of colloidal Mg(OH)2 onto MoS2 surface under alkaline conditions, thereby improving MoS2 floatability. In addition, both dispersants are physically adsorbed on MoS2 surface, but chemically adsorbed on Mg(OH)2 surface. In addition, the extended Derjaguin–Landau–Verwey–Overbeek (DLVO) calculation suggests that both SS and SH reverse the total interaction energies between MoS2 and colloidal Mg(OH)2 from negative (attraction force) to positive (repulsive force), with the impact of SH being more significant.
1. Introduction
Molybdenite (MoS2), as the most important molybdenum (Mo)-containing mineral,1–3 is frequently associated with Cu-bearing minerals and concentrated via flotation which consumes a significant amount of water.4,5 Generally, the quality of flotation media highly affects mineral flotation efficiency6 while freshwater is normally considered as an ideal medium.7 However, freshwater only accounts for about 0.5–0.8% of the total water source on Earth.8 Therefore, there is an increasing demand in applying alternative water sources like seawater containing high concentrations of electrolytes to minimize the usage of freshwater.9Previous studies show that bubble coalescence can be inhibited when the concentration of electrolytes in seawater (e.g., NaCl, KCl, CaCl2, MgCl2 and MgSO4) exceeds the threshold for critical coalescence.10–12 However, seawater inhibits MoS2 flotation under alkaline conditions, primarily due to the adsorption of colloidal Mg(OH)2 precipitated onto MoS2 surface.13–15 Therefore, great efforts have been made to reduce the negative influence of seawater (especially Mg2+ ions). For instance, Suyantara, et al.16 reported that the addition of emulsified kerosene prevented the adsorption of Mg(OH)2 onto MoS2. Jeldres, et al.17 found that the addition of Na2CO3 and CaO reduce Mg-hydroxyl complexes on MoS2 surface, thus improving MoS2 recovery.
In both industrial implementation and fundamental studies, sodium silicate (SS) and sodium hexametaphosphate (SH) are commonly used as dispersants to disperse hydrophilic substances from the surface of valuable minerals.18–20 Recently, more attention has been paid to the effects of these dispersants on mineral flotation in seawater. For instance, our previous studies21,22 have shown that the addition of SH can form dissolvable complexes with Mg2+, reducing the generation and adsorption of hydrophilic complexes on mineral surfaces. Others have also reported that Mg2+ plays the most significantly negative role in reducing the floatability of minerals in seawater.13,23 However, the influencing mechanisms of Mg2+ on MoS2 flotation are still not fully understood when using SS or SH.
In this study, MoS2 flotation was carried out in the solution containing Mg2+ ions in the presence of SS and SH, to investigate the influencing mechanisms of these two dispersants on MoS2 flotation, with the assistance of various analyses such as contact angle, zeta potential, FTIR and XPS. Moreover, the interaction force between particles was predicted based on the Derjaguin–Landau–Verwey–Overbeek (EDLVO) theoretical calculation.
2. Materials and methods
2.1 Samples and reagents
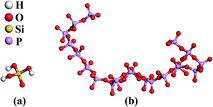
The raw MoS2 sample was purchased from Guilin, Guangxi province, China, which was crushed, milled and wet sieved to a size fraction of 38–75 μm. This fraction of powder sample was then ultrasonically cleaned using ethanol to remove clinging fines. Subsequently, the sized MoS2 was dried in a vacuum oven at 30 °C for 24 h, sealed with high purity N2 in plastic tubes and then stored in a freezer to prevent oxidation. The elemental composition of the MoS2 sample is given in our previous study,21 indicating a high Mo concentration with a small portion of impurities.0.1 M NaOH solution was used for pH adjustment. Analytical grade reagents including magnesium chloride hexahydrate (MgCl2·6H2O), SS (Na2SiO3) and SH ((NaPO3)6) were used. The structures of SS (SiO(OH)3− as the main hydrolytic species) and SH (long-chain polymerized metaphosphate consisting of HPO42−) were showed in Fig. 1, indicating totally different structures of these two dispersants. In addition, the Millipore® ultrapure water with a resistivity of 18.2 MΩ cm was used for solution preparation.
2.2 Flotation experiments
Laboratory flotation test was carried out using a mechanically agitated XFG II flotation machine (Wuhan Exploration Machinery Factory, China). Each solution suspension (25 mL) containing 0.25 g of sized MoS2 and 0.05 M MgCl2 (consistent with that of Mg2+ in seawater) was poured into the flotation cell (40 mL). When required, SS or SH was added into the pulp, followed by the addition of NaOH solution to maintain the desired pH (e.g., pH 10 to depress pyrite24) for 6 min, prior to flotation. The pulp was stirred at 1200 rpm with a constant airflow rate of 1.2 cm s−1, while the froth product was collected at a time interval of 10 s. Both filtered froth products and residues were vacuum-dried at 30 °C for 24 h prior to weighing and recovery calculation. No collectors were applied to investigate the mechanisms of dispersants more clearly, i.e. excluding the influence from collectors.2.3 Contact angle measurements
The fresh MoS2 surface was obtained by peeling off the top layer of MoS2 slab which was immersed into the conditioned solution same to the flotation experiment. The treated surface was then washed softly using ultrapure water and air-dried. 0.25 μL of ultrapure water was dropped onto the treated MoS2 surface using a micro-syringe. Subsequently, the contact angle of MoS2 was measured using a JC2000C device (Shanghai Zhongchen Digital Technology Company, China). The average values of triplicate measurements were reported herein.2.4 Zeta potential measurements
Zeta potential of MoS2 particles was determined via electrophoretic mobility analysis,25 using a Nano-ZS90 zeta potential analyzer (Malvern Co., Ltd., UK), at room temperature. Prior to analysis, 50 mg of MoS2 particles (<5 μm) were mixed in 50 mL solution for 10 min. The suspension pH was adjusted to desired value by adding NaOH solution. Finally, triplicate measurements were conducted and the average zeta potential value was reported.2.5 FTIR measurements
50 mL of suspension (pH 10) containing 0.5 g of MoS2 was stirred for 10 min. The filtered sample was washed using ultrapure water, and then freeze-dried under vacuum for 24 h. 2.5 mg of dried sample was mixed with KBr (250 mg) prior to pressing into thin pellets. The FTIR measurements were carried out using a Nicolet IS-10 instrument (Thermo Fisher Scientific Inc., Waltham, MA, USA).2.6 XRD measurements
In addition to the MoS2 sample, the precipitation formed in the solution was also sampled and analyzed by X-ray diffraction (XRD, D8 Advance, Bruker, Germany). Cu target and Kα ray were used as X-ray sources, the wavelength, tube voltage and tube current were controlled at 0.154056 nm, 40 kV and 30 mA in the test, respectively. Scanning speed and range were 3° min−1 and 10–70°, respectively. The XRD analysis indicated that the majority of this sample was well-crystallized MoS2.2.7 XPS measurements
The elemental concentration of surface chemical species on MoS2 surface was determined by ESCALAB 250Xi XPS instrument (Thermo Fisher Scientific Inc., Waltham, MA, USA) with an Al Kα monochromatic X-ray source (1486.6 eV). The XPS spectra were obtained at a step size of 1.0 eV. The survey and high-resolution spectra were collected with pass energies of 100 eV and 30 eV, respectively. All XPS spectra data were analyzed using XPS Peak 4.1 software. Binding energy was calibrated based on C 1s at 284.8 eV.2.8 EDLVO calculation
Extended Derjaguin–Landau–Verwey–Overbeek (EDLVO) theoretical model is used to predict the interaction energy between particles in aqueous, normally with van der Waals (VW) and electrostatic interaction energies (VE). Once external substances are added, steric hindrance interaction energy (VSR) should be considered. Therefore, the total interaction energy (VT) can be described using eqn (1).26–28| VT = VW + VE + VSR | (1) |
VW can be calculated according to eqn (2).
 | (2) |
 | (3) |
The electrostatic interaction energy between MoS2 and colloidal Mg(OH)2 can be calculated using eqn (4).
 | (4) |
As indicated in previous studies, the addition of SH results in steric hindrance interaction due to the steric hindrance effects.26,28,34 Therefore, the steric hindrance interaction should be considered and can be calculated based on eqn (5).
 | (5) |
3. Results
3.1 Flotation results
Fig. 2a shows the MoS2 recovery at 10 min as a function of dispersant (SS or SH) dosage from 0 to 50 mg L−1 in 0.05 M MgCl2 solution. In the absence of SS or SH, a low MoS2 recovery of 22% was observed, indicating a negative role of Mg2+ on MoS2 flotation, probably due to the formation and adsorption of Mg(OH)2 precipitates on MoS2 surface.13,15 With the increase of SS/SH dosage, MoS2 recovery was increased to various degrees, indicating the beneficial roles of SS and SH on MoS2 flotation, with the latter being more significant. Specifically, the MoS2 recovery dramatically increased from 22% to 78% when SH was increased to 30 mg L−1. Further increase in SH dosage to 50 mg L−1 only slightly increased the recovery. Differently, the MoS2 recovery increased linearly from 22% to 62% when SS dosage was increased from 0 to 50 mg L−1. It should be note that the MoS2 recovery using SS was still lower than that using SH. Therefore, 50 mg L−1 was selected for further study.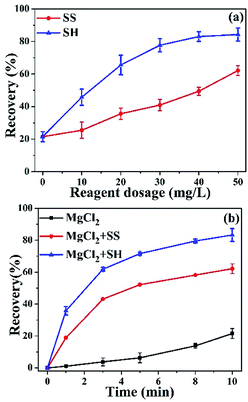 | ||
| Fig. 2 Recovery of MoS2 in 0.05 M MgCl2 solution in the presence of SS or SH at pH 10. (a) Effect of dosage at 10 min, and (b) effect of flotation time. | ||
Fig. 2b shows MoS2 recovery as a function of time. In the absence of SS or SH, MoS2 recovery was increased from 1% to 22% within 10 min, following an overall parabolic trend. However, MoS2 recovery was increased more rapidly when dispersants were added, giving significantly greater recovery at 10 min, i.e., 62% and 83% in the presence of SS and SH, respectively.
3.2 Contact angle analysis
Fig. 3 shows the effect of SS/SH on the contact angle of MoS2. The fresh MoS2 surface shows a high contact angle of 87° in pure water (Fig. 3a), indicating a good hydrophobicity, similar to previous findings.15,35 However, a contact angle of 71° was observed in 0.05 M MgCl2 solution (Fig. 3b). When 50 mg L−1 of SS or SH was added, the contact angle of MoS2 was increased to 80° (Fig. 3c) and 83° (Fig. 3d), respectively, suggesting that SS and SH increase the hydrophobicity of MoS2 surface, with the effect of SH being more apparent on increasing contact angle of MoS2. | ||
| Fig. 3 Contact angles of MoS2 in (a) pure water, (b) 0.05 M MgCl2, (c) 0.05 M MgCl2 with SS, and (d) 0.05 M MgCl2 with SH, at pH 10. | ||
3.3 Zeta potential analysis
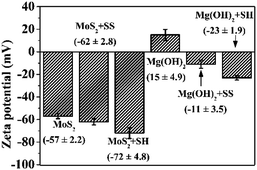
Fig. 4 shows the zeta potentials of MoS2 and Mg(OH)2 with and without SS/SH at pH 10. The zeta potential of MoS2 in the absence of SS or SH was −57 (±2.2) mV, close to that reported in Hirajima, et al.5 However, this value was decreased to −62 (±2.8) mV and −72 (±4.8) mV, respectively, in the presence of SS or SH, indicating that SH plays a more significant role on decreasing the zeta potential of MoS2.However, Mg(OH)2 surface was positively charged at pH 10, i.e., 15 (±4.9) mV, consistent with that reported in Schott.36 In the presence of SS/SH, the zeta potential of Mg(OH)2 was decreased to −11 (±3.5) mV and −23 (±1.9) mV, respectively. The change of zeta potential of Mg(OH)2 from positive (without SH or SS) to negative (with SH or SS) indicates the adsorption of negatively charged SH or SS on Mg(OH)2 surface.37,38
3.4 FTIR analysis
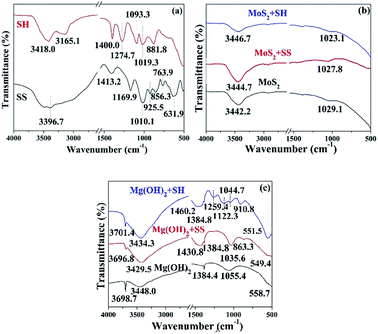
FTIR spectral analyses (Fig. 5) were carried out to further understand the interaction between dispersants and colloidal Mg(OH)2 or MoS2 particles. The peak located at 881.8 cm−1 was assigned to P![[double bond, length as m-dash]](https://www.rsc.org/images/entities/char_e001.gif) O, while the peaks at 1019.3 and 1093.3 cm−1 were due to the stretching vibration of P–O.26,39 The peak at 1274.7 cm−1 corresponds to the asymmetric stretching vibration of P–O–P.28 The characteristic peaks at 631.9 cm−1 and 763.9 cm−1 for SS were attributed to the asymmetric deformation vibration of (H)O–Si–O(Na) and (H)O–Si–O(H), respectively. The peaks located at 856.3 cm−1 and 925.5 cm−1 were due to the symmetric stretching vibration of (Na)O–Si–O(H) and (Na)O–Si–O(Na), while the peaks at 1010.1 and 1169.9 cm−1 were ascribed to the asymmetric stretching vibration of Si–O(H) and Si–O(Na).40 The characteristic peaks at 3300–3600 cm−1 were due to the stretching vibration of hydroxyl groups.41,42
O, while the peaks at 1019.3 and 1093.3 cm−1 were due to the stretching vibration of P–O.26,39 The peak at 1274.7 cm−1 corresponds to the asymmetric stretching vibration of P–O–P.28 The characteristic peaks at 631.9 cm−1 and 763.9 cm−1 for SS were attributed to the asymmetric deformation vibration of (H)O–Si–O(Na) and (H)O–Si–O(H), respectively. The peaks located at 856.3 cm−1 and 925.5 cm−1 were due to the symmetric stretching vibration of (Na)O–Si–O(H) and (Na)O–Si–O(Na), while the peaks at 1010.1 and 1169.9 cm−1 were ascribed to the asymmetric stretching vibration of Si–O(H) and Si–O(Na).40 The characteristic peaks at 3300–3600 cm−1 were due to the stretching vibration of hydroxyl groups.41,42
Fig. 5b shows the spectra of MoS2 with and without SH/SS. No new peaks appeared on MoS2 in the presence of SH and SS, indicating that the adsorption of two dispersants on MoS2 surface was dominated by physical adsorption. Fig. 5c shows the spectra of Mg(OH)2 in the absence and presence of SH/SS. The sharp characteristic peaks at 1384.4 cm−1 and 3698.7 cm−1 were attributed to O–H vibrations of Mg(OH)2.43 The new characteristic peaks at 910.8, 1122.3, 1259.4 and 1460.2 cm−1 were due to the presence of SH on Mg(OH)2 while the peaks at 910.8 and 1122.3 cm−1 were due to the shift of P![[double bond, length as m-dash]](https://www.rsc.org/images/entities/char_e001.gif) O peaks of SH at 881.8 and 1093.3 cm−1, respectively. The characteristic peak at 1259.4 cm−1 was due to shift of P–O–P of SH that originally at 1274.7 cm−1. Therefore, SH is chemically adsorbed on Mg(OH)2. Similarly, new characteristic peaks at 1035.6 and 1430.8 cm−1 due to SS appeared on Mg(OH)2 surface, indicating a chemical adsorption mechanism between SS and MoS2.
O peaks of SH at 881.8 and 1093.3 cm−1, respectively. The characteristic peak at 1259.4 cm−1 was due to shift of P–O–P of SH that originally at 1274.7 cm−1. Therefore, SH is chemically adsorbed on Mg(OH)2. Similarly, new characteristic peaks at 1035.6 and 1430.8 cm−1 due to SS appeared on Mg(OH)2 surface, indicating a chemical adsorption mechanism between SS and MoS2.
3.5 XPS analysis
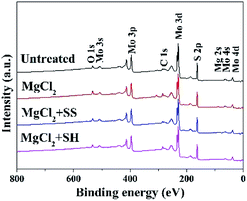
Fig. 6 shows the XPS survey for MoS2 surfaces in the absence and presence of SH/SS. No characteristic peaks due to Mg 2s were detected on the untreated MoS2 surface, but appeared on MoS2 surface treated in 0.05 M MgCl2. The peak intensities of O 1s and C 1s were also increased significantly.Table 1 shows that Mg 2s and O 1s were increased from 1 at% to 5 at% and 7 at% to 10 at%, respectively, indicating the adsorption of Mg(OH)2 precipitates on MoS2 surface in 0.05 M MgCl2 solution.34 However, upon addition of SH or SS, the peak intensities of Mg 2s and O 1s were reduced, e.g., from 5 at% to 2 at% and from 10 at% to 7 at%, respectively, indicating that the addition of these two dispersants can prevent the adsorption of Mg(OH)2 precipitates on the surface of MoS2.
| Element | BE (eV) | Conditions | |||
|---|---|---|---|---|---|
| Untreated | MgCl2 | MgCl2+SS | MgCl2+SH | ||
| S 2p | 162.4 | 58 | 56 | 58 | 57 |
| O 1s | 533.2 | 7 | 10 | 7 | 7 |
| Mo 3d | 230.0 | 34 | 29 | 33 | 34 |
| Mg 2s | 89.5 | 1 | 5 | 2 | 2 |
4. Discussion
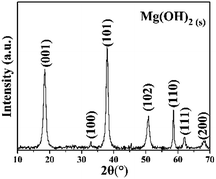
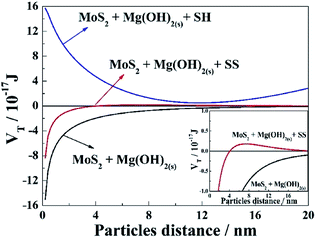
Fig. 7 shows the XRD patterns of white precipitates formed in 0.05 M MgCl2 solution. Mg(OH)2 was found to be the predominant phase, with most crystal faces being detected, indicating a quick formation of crystalline Mg(OH)2 under the flotation condition. As indicated in the previous studies13–15 and Fig. 2 herein, MoS2 flotation recovery was reduced in 0.05 M MgCl2 solution, primarily due to the formation and adsorption of Mg(OH)2 on MoS2 surface, consistent with the contact angle measurements (Fig. 3). However, the mechanism between MoS2 and Mg(OH)2 is still not fully understood.The dominant force between MoS2 and Mg(OH)2 can be calculated based on the EDLVO theory. Generally, the more negative VT between particles, the greater the attraction force to aggregates. In contrast, the more positive VT responds to the stronger repulsive force between particles, resulting in a more dispersed pulp system.44,45 Fig. 8 shows that the VT between MoS2 and Mg(OH)2 remains negative within the measured particle distance in the absence of dispersants, indicating the aggregation of MoS2–Mg(OH)2. In other words, Mg(OH)2 is likely attached onto the MoS2 surface in MgCl2 solution in the absence of dispersants.
In the presence of SS, the VT between MoS2 and Mg(OH)2 is gradually increased from a negative to a positive value when the distance increases, indicating that MoS2 and Mg(OH)2 particles repel each other.46,47 Moreover, the VT value between MoS2 and Mg(OH)2 in the presence of SH is always positive within the range of distance examined, suggesting a predominate repulsive force due to its long chain structure. As the adsorption of Mg(OH)2 on MoS2 surface decreases, the surface of MoS2 becomes more hydrophobic, giving rise to the increase of MoS2 flotation that observed in Fig. 2. Therefore, SS and SH increase the repulsion between MoS2 and Mg(OH)2 particles, thereby decreasing the adsorption of Mg(OH)2 on MoS2 surface, with the effect of SH being more significant.
5. Conclusions
A low recovery of 22% was found for MoS2 flotation in 0.05 M MgCl2 solution controlled at pH 10. MoS2 recovery was increased significantly in the presence of SS/SH. Various measurements indicate that SS and SH were chemically adsorbed onto Mg(OH)2, reversing its zeta potential from positive to negative. However, SS and SH were physically adsorbed onto MoS2, further decreasing the zeta potential of MoS2. The presence of SS and SH inhibits the adsorption of Mg(OH)2 precipitates onto the negatively charged MoS2 surface via electrostatic repulsion, thereby increasing MoS2 recovery in 0.05 M MgCl2. Further theoretical calculation demonstrates that the addition of SS or SH changes the interaction force between particles from attractive to repulsive, thereby preventing the adsorption of hydrophilic colloidal Mg(OH)2 on the MoS2 surface, with the influence of SH being more significant.Conflicts of interest
There are no conflicts to declare.Acknowledgements
This research was funded by National Natural Science Foundation of China, grant numbers 51774223, 51974215, 51604205 and the Fundamental Research Funds for the Central Universities (WUT: 2020III049). The authors also wish to thank the supports from the undergraduate research foundation for independent innovation from Wuhan University of Technology (2019-ZH-A1-02, 2020-ZH-B1-06).References
- S. Castro, A. Lopez Valdivieso and J. S. Laskowski, Int. J. Miner. Process., 2016, 148, 48–58 CrossRef CAS.
- Z. L. Wei and Y. B. Li, Conservation and Utilization of Mineral Resources, 2018, 31–36 Search PubMed.
- X. Zhang, F. F. Jia, B. Q. Yang and S. X. Song, J. Phys. Chem., 2017, 121, 9938–9943 CAS.
- Z. G. Yin, W. Sun, Y. H. Hu, Q. J. Guan, C. H. Zhang, Y. S. Gao and J. H. Zhai, Trans. Nonferrous Met. Soc. China, 2017, 883–890 CrossRef CAS.
- T. Hirajima, M. Mori, O. Ichikawa, K. Sasaki, H. Miki, M. Farahat and M. Sawada, Miner. Eng., 2014, 66–68, 102–111 CrossRef CAS.
- S. Castro and J. S. Laskowski, KONA Powder Part. J., 2011, 4–15 CrossRef CAS.
- W. Y. Liu, C. J. Moran and S. Vink, Miner. Eng., 2013, 53, 91–100 CrossRef CAS.
- L. F. Greenlee, D. F. Lawler, B. D. Freeman, B. Marrot and P. Moulin, Water Res., 2009, 43, 2317–2348 CrossRef CAS PubMed.
- B. Wang and Y. Peng, Miner. Eng., 2014, 66–68, 13–24 CrossRef CAS.
- J. J. Quinn, J. M. Sovechles, J. A. Finch and K. E. Waters, Miner. Eng., 2014, 58, 1–6 CrossRef CAS.
- R. M. Pashley, B. W. Ninham and V. S. J. Craig, Nature, 1993, 364, 317–319 CrossRef.
- R. R. Lessard and S. A. Zieminski, Ind. Eng. Chem. Res., 1971, 10, 260–269 CAS.
- Z. H. Qiu, Q. X. Liu, G. Y. Liu and H. Zhong, Colloids Surf., A, 2016, 509, 123–129 CrossRef CAS.
- T. Hirajima, G. P. W. Suyantara, O. Ichikawa, A. M. Elmahdy, H. Miki and K. Sasaki, Miner. Eng., 2016, 96–97, 83–93 CrossRef CAS.
- Y. B. Li, C. Lartey, S. X. Song, Y. J. Li and A. R. Gerson, RSC Adv., 2018, 8, 23364–23371 RSC.
- G. P. W. Suyantara, T. Hirajima, A. M. Elmahdy, H. Miki and K. Sasaki, Colloids Surf., A, 2016, 501, 98–113 CrossRef CAS.
- R. I. Jeldres, M. P. Arancibia Bravo, A. Reyes, C. E. Aguirre, L. Cortes and L. A. Cisternas, Miner. Eng., 2017, 109, 10–13 CrossRef CAS.
- E. Rebolledo, J. S. Laskowski, L. Gutierrez and S. Castro, Miner. Eng., 2017, 100, 71–74 CrossRef CAS.
- K. I. Marinakis and H. L. Shergold, Int. J. Miner. Process., 1985, 14, 177–193 CrossRef CAS.
- A. Ramirez, A. Rojas, L. Gutierrez and J. S. Laskowski, Miner. Eng., 2018, 125, 10–14 CrossRef CAS.
- W. Q. Li, Y. B. Li, Z. L. Wei, Q. Xiao and S. X. Song, Minerals, 2018, 8, 17 CrossRef.
- W. Q. Li, Y. B. A. Li, Q. Xiao, Z. L. Wei and S. X. Song, Minerals, 2018, 8, 18 CrossRef.
- Y. B. Li, W. Q. Li, Q. Xiao, N. He, Z. J. Ren, C. Lartey and A. R. Gerson, Minerals, 2017, 7, 10 CrossRef CAS.
- Y. F. Mu, Y. J. Peng and R. A. Lauten, Miner. Eng., 2016, 96–97, 143–156 CrossRef CAS.
- M. R. Gittings and D. A. Saville, Colloids Surf., A, 1998, 141, 111–117 CrossRef CAS.
- Y. P. Lu, M. Q. Zhang, Q. M. Feng, T. Long, L. M. Ou and G. F. Zhang, Trans. Nonferrous Met. Soc. China, 2011, 21, 208–213 CrossRef CAS.
- M. Q. Zhang, J. T. Liu and Y. T. Wang, J. China Coal Soc., 2008, 33, 1058–1062 CAS.
- Y. H. Wang, X. H. Chen, Y. M. Hu and Y. D. Lan, J. Cent. South Univ., 2007, 38, 238–244 CAS.
- G. Zhang, Y. Zhang and S. Bao, Minerals, 2018, 8, 18 CrossRef.
- J. Ren, J. Shen and S. Lu, Particle Dispersion Science and Technology, Chemical Industry Press, Beijing, 2005 Search PubMed.
- C. J. V. Oss, R. F. Giese and P. M. Costanzo, Clays Clay Miner., 1990, 38, 151–159 CrossRef.
- B. Feng, Y. P. Lu, Q. M. Feng and H. Li, Ind. Eng. Chem. Res., 2012, 51, 12089–12094 CrossRef CAS.
- T. Missana and A. Adell, J. Colloid Interface Sci., 2000, 230, 150–156 CrossRef CAS PubMed.
- W. Li and Y. Li, Miner. Eng., 2019, 134, 269–274 CrossRef CAS.
- S. Kelebek, J. Colloid Interface Sci., 1988, 124, 504–514 CrossRef CAS.
- H. Schott, J. Pharm. Sci., 1981, 70, 486–489 CrossRef CAS PubMed.
- W. A. Huang, Q. Lan, Z. S. Qiu, Y. Zhang, H. Y. Zhong and G. T. Feng, Silicon, 2016, 8, 111–122 CrossRef CAS.
- Y. Ji, J. Wang and L. Xiang, Mater. Res. Innovations, 2015, 19(S2), 147–151 Search PubMed.
- Q. M. Feng, Q. B. Zhou, G. F. Zhang, Y. P. Lu and S. Y. Yang, Chin. J. of Nonferrous Met., 2011, 21, 436–441 CAS.
- I. Halasz, M. Agarwal, R. Li and N. Miller, Catal. Lett., 2007, 117, 34–42 CrossRef CAS.
- C. S. Xue, Semicond. Photonics Technol., 2007, 13, 222–224 CAS.
- T. Bezrodna, G. Puchkovska, V. Shymanovska, J. Baran and H. Ratajczak, J. Mol. Struct., 2004, 700, 175–181 CrossRef CAS.
- L. R. Chang, F. H. Cao, J. S. Cai, W. J. Liu, J. Q. Zhang and C. N. Cao, Electrochem. Commun., 2009, 11, 2245–2248 CrossRef CAS.
- Q. Q. Lin, G. H. Gu, H. Wang, Y. C. Liu, J. G. Fu and C. Q. Wang, Int. J. Miner., Metall. Mater., 2018, 25, 1–10 CrossRef CAS.
- Z. Adamczyk and P. Weroński, Adv. Colloid Interface Sci., 1999, 83, 137–226 CrossRef CAS.
- W. Z. Yin and J. Z. Wang, Trans. Nonferrous Met. Soc. China, 2014, 24, 3682–3687 CrossRef CAS.
- A. Liu, M. Q. Fan, Z. H. Li and J. C. Fan, Int. J. Miner. Process., 2017, 168, 1–8 CrossRef CAS.
| This journal is © The Royal Society of Chemistry 2020 |

