
 Open Access Article
 This Open Access Article is licensed under a Creative Commons Attribution-Non Commercial 3.0 Unported Licence
P(VDF-TrFE) nanofibers: structure of the ferroelectric and paraelectric phases through IR and Raman spectroscopies†
Alessia
Arrigoni
 a,
Luigi
Brambilla
a,
Chiara
Bertarelli
ab,
Gianluca
Serra
a,
Matteo
Tommasini
a and
Chiara
Castiglioni
*a
a,
Luigi
Brambilla
a,
Chiara
Bertarelli
ab,
Gianluca
Serra
a,
Matteo
Tommasini
a and
Chiara
Castiglioni
*a
aDipartimento di Chimica, Materiali e Ingegneria Chimica “Giulio Natta”, Politecnico di Milano, Piazza Leonardo da Vinci 32, 20133 Milano, Italy. E-mail: chiara.castiglioni@polimi.it
bCenter for Nano Science and Technology@PoliMi, Istituto Italiano di Tecnologia, Via Pascoli 70/3, 20133 Milano, Italy
First published on 13th October 2020
Abstract
This study elucidates the complex morphology and the related spectroscopic response of poly(vinylidene fluoride-co-trifluoroethylene) copolymer, with 80% molar VDF content, namely P(VDF-TrFE) (80/20). We investigate the molecular structure, the morphology and the thermal behaviour of P(VDF-TrFE) samples obtained as electrospun nanofibers; we discuss their thermal evolution crossing the Curie temperature and the structure resulting after annealing, giving a comparison with P(VDF-TrFE) films. The new experimental data here obtained, combined with previous spectroscopic studies carried out on piezoelectric fluorinated polymers and copolymers, allow identifying spectroscopic markers sensitive to the molecular structure, the molecular orientation, the conformational defects and the kind of crystalline phase. We assign the vibrational modes localized on TrFE units by combining experimental observation and density functional calculations carried out on suitable molecular models. This work provides a sound set of diagnostic tools, which can be exploited for the assessment of structure/property relationships aimed at clarifying the molecular mechanisms leading to the piezoelectric performance of fluorinated copolymers.
1. Introduction
Thanks to their ability to transduce mechanical work into electrical energy and vice versa, piezoelectric materials have generated a lot of interest in different fields such as energy harvesting devices, sensors and actuators.1–7 Typically, piezoelectric ceramics – such as lead zirconate titanate (PZT), zinc oxide (ZnO) and barium titanate (BaTiO3) – show excellent piezoelectric properties but are intrinsically brittle and usually require very high temperatures of processing (T > 600 °C), thus limiting their application.3,8–10 Electroactive polymers offer an interesting alternative to these materials, overcoming their mechanical and temperature limits. Polymer-based piezoelectrics are also open to a wide range of innovative solutions, such as flexible electronic devices, biocompatible sensors and others.3–5,11Among piezoelectric polymers, polyvinylidene fluoride (PVDF) and its copolymers are the most studied and applied.3,12,13 Fluorine-based polymers possess piezoelectric characteristics due to their peculiar molecular structure, showing a net molecular dipole (perpendicular to the chain axis) when the polymer chains assume the trans-planar conformation. A peculiar chain packing in the crystal may result in polar crystallites, where polymer chains align with parallel dipole moments.
PVDF is a semi-crystalline polymer showing four crystalline phases: α (non-polar), β (polar), γ (polar), and δ (polar).14–22 For the thermodynamic point of view, the α phase (with (TGTG′)n chain conformation) is the most stable phase. Therefore, the polymer crystallizes from the melt preferentially in α phase. The β phase has an all-trans planar-zigzag chain conformation (T)n – see sketch in Table 1 – with an orthorhombic unit cell, in which the chains are aligned along the b axis.22 This polymer conformation is the one leading to highly polar crystals, with permanent dipoles that can orient within macroscopic domains, therefore it is the conformation of interest when piezoelectric properties are desired.
|
To overcome the issues related with the poor control on PVDF crystallization, poly(vinylidene fluoride-co-trifluoroethylene) random copolymers with different co-monomer ratios – denoted as P(VDF-TrFE) – have been developed and have gained a lot of attention since the eighties.23–28 Based on experimental evidence, it is believed that the copolymer has the tendency to preferentially form a crystalline phase similar to the ferroelectric all-trans β phase of PVDF.28–30 Remarkably, no evidence of the formation of non-polar crystalline phases (e.g., α phase) has been reported so far for P(VDF-TrFE).12,31
Compared to the homopolymer PVDF, the copolymer P(VDF-TrFE) shows a reduced degree of crystallinity due to the intrinsic presence of chemical defects – i.e., the TrFE units, randomly distributed among PVDF sequences.12,31,32 However, the enhanced stabilization of the β phase in the copolymers grants a better stability of the piezoelectric phase, thus bypassing the mechanical/electrical pre-treatments usually required in PVDF to increase the β phase content. At difference from PVDF, a Curie temperature has been identified in P(VDF-TrFE), which corresponds to a change of the polymer morphology which accompanies the transition between the ferroelectric (FE) and the paraelectric phase (PE).27,30,33–36
PVDF and P(VDF-TrFE) membranes are often subjected to uniaxial or biaxial stretching to (i) promote the macroscopic orientation of polymers chains in the amorphous phase and of the crystallites and (ii) enhance the degree of crystallinity thanks to the stretching of the chains in the amorphous phase forming new crystalline domains. The preferential orientation of the polymer chains makes the material macroscopically anisotropic and allows optimizing the piezoelectric response associated to electrical or mechanical stimuli in a given direction.11,37–39
In this framework, vibrational spectroscopy – particularly IR spectroscopy – is widely used to study molecular structure, crystal phases and chains orientation.22,30,33,34,40–56 Several papers dealt with the IR spectra of PVDF and P(VDF-TrFE) samples, some of which concerning the identification of the marker bands of the different crystalline phases, to evidence correlations between the IR spectral pattern and the corresponding piezoelectric response of samples treated in different conditions.13,27,30,33,34,39–50,52–54
At difference from IR, relatively few Raman studies of P(VDF-TrFE) have been reported in the literature. For instance, J. S. Green et al.55 presented a detailed analysis of the evolution of the Raman spectra of a 60/40 random copolymer, aiming at the description of chain conformation at Tc, whereas K. Tashiro et al.56 analysed the temperature dependence of the Raman spectra of different P(VDF-TrFE) copolymers.
Despite the abundant literature dealing with structural characterization of P(VDF-TrFE) copolymers, well established criteria to obtain unique, reliable information regarding complex, sample-dependent morphology are still required. A case concerns electrospun piezoelectric polymers nanofibers, where the analysis of the vibrational spectra of P(VDF-TrFE) fibres is often carried out on the basis of correlative criteria, which derive from spectra analysis of related materials prepared with different methods. Most likely, this is the reason why the conclusions concerning structure–property or structure–treatment correlations are sometimes contradictory.
The main goal of the analysis here reported is to set up a sound method for the structural analysis of the P(VDF-TrFE) (80/20) copolymer, based on the joint use of IR and Raman spectroscopies, and supported by results from theoretical modelling. This work aims to highlight the spectroscopic evidence related with the different phases/molecular structures occurring in a given sample. The comparison between samples prepared with different methods (i.e., polymer films and electrospun nanofibers) allows identifying subtle but well-defined spectroscopic markers associated to different chain structures or crystalline domains. Therefore, we provide the reader with a systematic analysis and summary of the available spectroscopic evidence on P(VDF-TrFE) copolymers, setting up grounds for the interpretation of their relevant spectral features.
The study of the effect of thermal treatments on the IR and Raman responses will provide an excellent test for the assessment of the diagnostic tools here proposed. Moreover, it highlights a peculiar behaviour of fibres not observed so far and different from findings in the case of films or powder samples.
The major steps followed in this paper are:
(1) We compare the experimental IR and Raman spectra of P(VDF-TrFE) with those of PVDF, and we discuss the assignment of the observed vibrational peaks. Among the first-principles predictions available for PVDF,57,58 we will exploit the careful vibrational assignment for the different crystalline phases of PVDF of ref. 22, based on Density Functional Theory (DFT) calculations.
(2) We carry out DFT calculations on selected molecular models aimed at mimicking P(VDF-TrFE) segments, so to thoroughly discuss the spectroscopic markers of the TrFE units.
(3) We analyze P(VDF-TrFE) electrospun nanofibers by IR spectroscopy and we compare them with P(VDF-TrFE) films; this allows introducing a reliable and simple method to assess the molecular orientation in nanofibers.
(4) We highlight by IR and Raman spectroscopies the changes in material morphology and chain orientation during thermal treatments.
We would like to highlight two important aspects which show the relevance of the detailed analysis herein reported. On the one hand, P(VDF-TrFE) is a complex material formed by different phases where the macromolecules experience different intermolecular environments. It follows that IR and Raman bands are often broad and structured, thus revealing the presence of different contributions from differently arranged materials. This peculiarity has to be carefully considered for a sound interpretation and it is very informative, if properly analysed. On the other hand, the IR and Raman spectra of P(VDF-TrFE) are complementary under different respects. In addition to the trivial advantage to collect data for the whole set of vibrational transitions, we obtained evidence that the two techniques have a different sensitivity to the different phases present in the P(VDF-TrFE) samples. Hence IR and Raman spectroscopies can provide unique information about phase occurrence and evolution with sample treatments, based on the changes observed in the intensity pattern/band shapes in the two complementary spectra.
We also think that the approach presented here, in conjunction with a characterization of the piezoelectric/ferroelectric performance, may contribute to the knowledge of the molecular mechanisms responsible for the piezoelectric/ferroelectric behaviour of P(VDF-TrFE), a topic widely discussed in the literature, but still lacking of unambiguous interpretation. Finally, the setup of well-established experimental methods for monitoring structural properties – e.g., degree of crystallinity, kind of crystalline phases, chain conformations, and molecular orientation – could provide powerful tools for the control over the processing required to obtain optimized P(VDF-TrFE) materials for specific technological applications.
2. Materials and methods
2.1 Materials
![[thin space (1/6-em)]](https://www.rsc.org/images/entities/char_2009.gif) 000 g mol−1), was dissolved in a (4:6) volume ratio of N,N-dimethylformamide/acetone (DMF, anhydrous (99.8%)/acetone (99.9%)) at a polymer/solvent concentration of 20% w/v. The solution was mixed using a magnetic stirrer at room temperature for about 1 h until a uniform and clear solution was obtained. The same conditions have been kept also for the preparation of polyvinylidene fluoride (PVDF) solutions, starting from PVDF in powder form with Mw = 534000 g mol−1.
000 g mol−1), was dissolved in a (4:6) volume ratio of N,N-dimethylformamide/acetone (DMF, anhydrous (99.8%)/acetone (99.9%)) at a polymer/solvent concentration of 20% w/v. The solution was mixed using a magnetic stirrer at room temperature for about 1 h until a uniform and clear solution was obtained. The same conditions have been kept also for the preparation of polyvinylidene fluoride (PVDF) solutions, starting from PVDF in powder form with Mw = 534000 g mol−1.
2.2 Samples characterization
2.3 Theoretical modelling
The assignment of the crystallinity bands of PVDF (Table 1) is based on previous DFT calculations, carried out in a work22 co-authored by one of the authors (CC) of the present paper. Ref. 22 determines the structure and the vibrational properties of PVDF in different crystal phases and it makes use of the CRYSTAL code,59 within periodic boundary conditions (full details about the computational set-up adopted are thoroughly described in ref. 22).The marker bands of the P(VDF-TrFE) copolymer have been investigated in this work by means of DFT calculations suitably carried out, considering a molecular model composed by one TrFE unit surrounded by four VDF units on one side and five VDF units on the other side. The two ends of this oligomer are terminated by one CH3 and one CF3 unit (see ESI†). In this model, the conformational degrees of freedom were constrained as to obtain the all-trans conformation expected in the crystal phase of the copolymer. To carry out the B3LYP/6-31G(d,p) DFT calculations on such model we used the Gaussian software.60
3. Infrared spectra of P(VDF-TrFE)
A thorough interpretation of the vibrational spectra of a semi-crystalline polymer requires the knowledge of its molecular structure and, possibly, of the crystal structure. We analyse here a P(VDF-TrFE) (80/20) random copolymer. The relatively small hindrance of the fluorine atoms may allow the accommodation of isolated TrFE units in crystalline domains, while longer sequences of TrFE units are supposed to segregate in the amorphous phase. For these reasons, as a starting point for the analysis of the spectra of P(VDF-TrFE), we will refer to the previous vibrational assignment done for PVDF.22In the next sections, we will discuss in detail the IR spectra of different samples of P(VDF-TrFE), namely films cast from solutions at room temperature and after thermal treatments, and we will compare such spectra with those of PVDF films.
3.1 P(VDF-TrFE) films at room temperature
We begin the assignment of the observed IR transitions, by considering film samples of both the homopolymer and the copolymer at room temperature. The close correlation between the structures of P(VDF-TrFE) and PVDF is corroborated by the direct comparison (Fig. 1) of the IR spectrum of P(VDF-TrFE) (Fig. 1(a)) with the spectra of two different thin films of PVDF, characterized by a different relative amount of β and α phases (Fig. 1(b and c)). Fig. 1 clearly shows that some characteristic IR bands of PVDF nicely correspond to IR bands of the copolymer.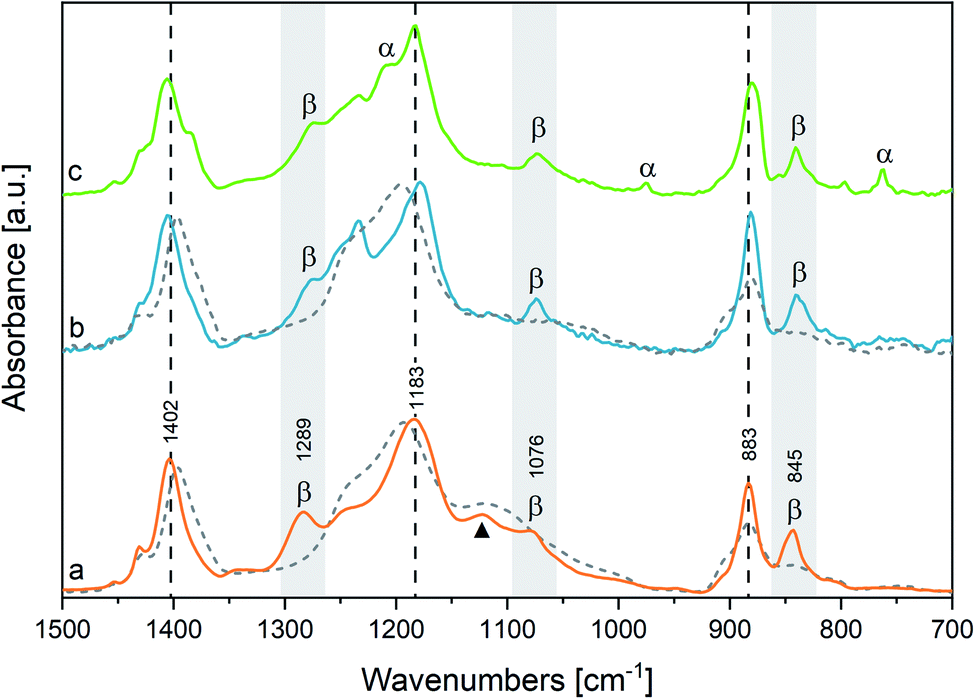 | ||
| Fig. 1 IR spectra of a P(VDF-TrFE) film (a) and of two different PVDF films (b and c). The grey background highlights the β phase markers. The α phase markers are indicated in spectrum c. The vertical dashed lines mark strong infrared absorptions scarcely affected by the kind of crystalline phase. The black triangle indicates the marker band of TrFE units. The IR spectra of melt PVDF and P(VDF-TrFE) at 170 °C, are plotted as dashed curves superimposed to the corresponding solid-state spectra. The IR spectra have been normalized with respect to the 1183 cm−1 peaks. | ||
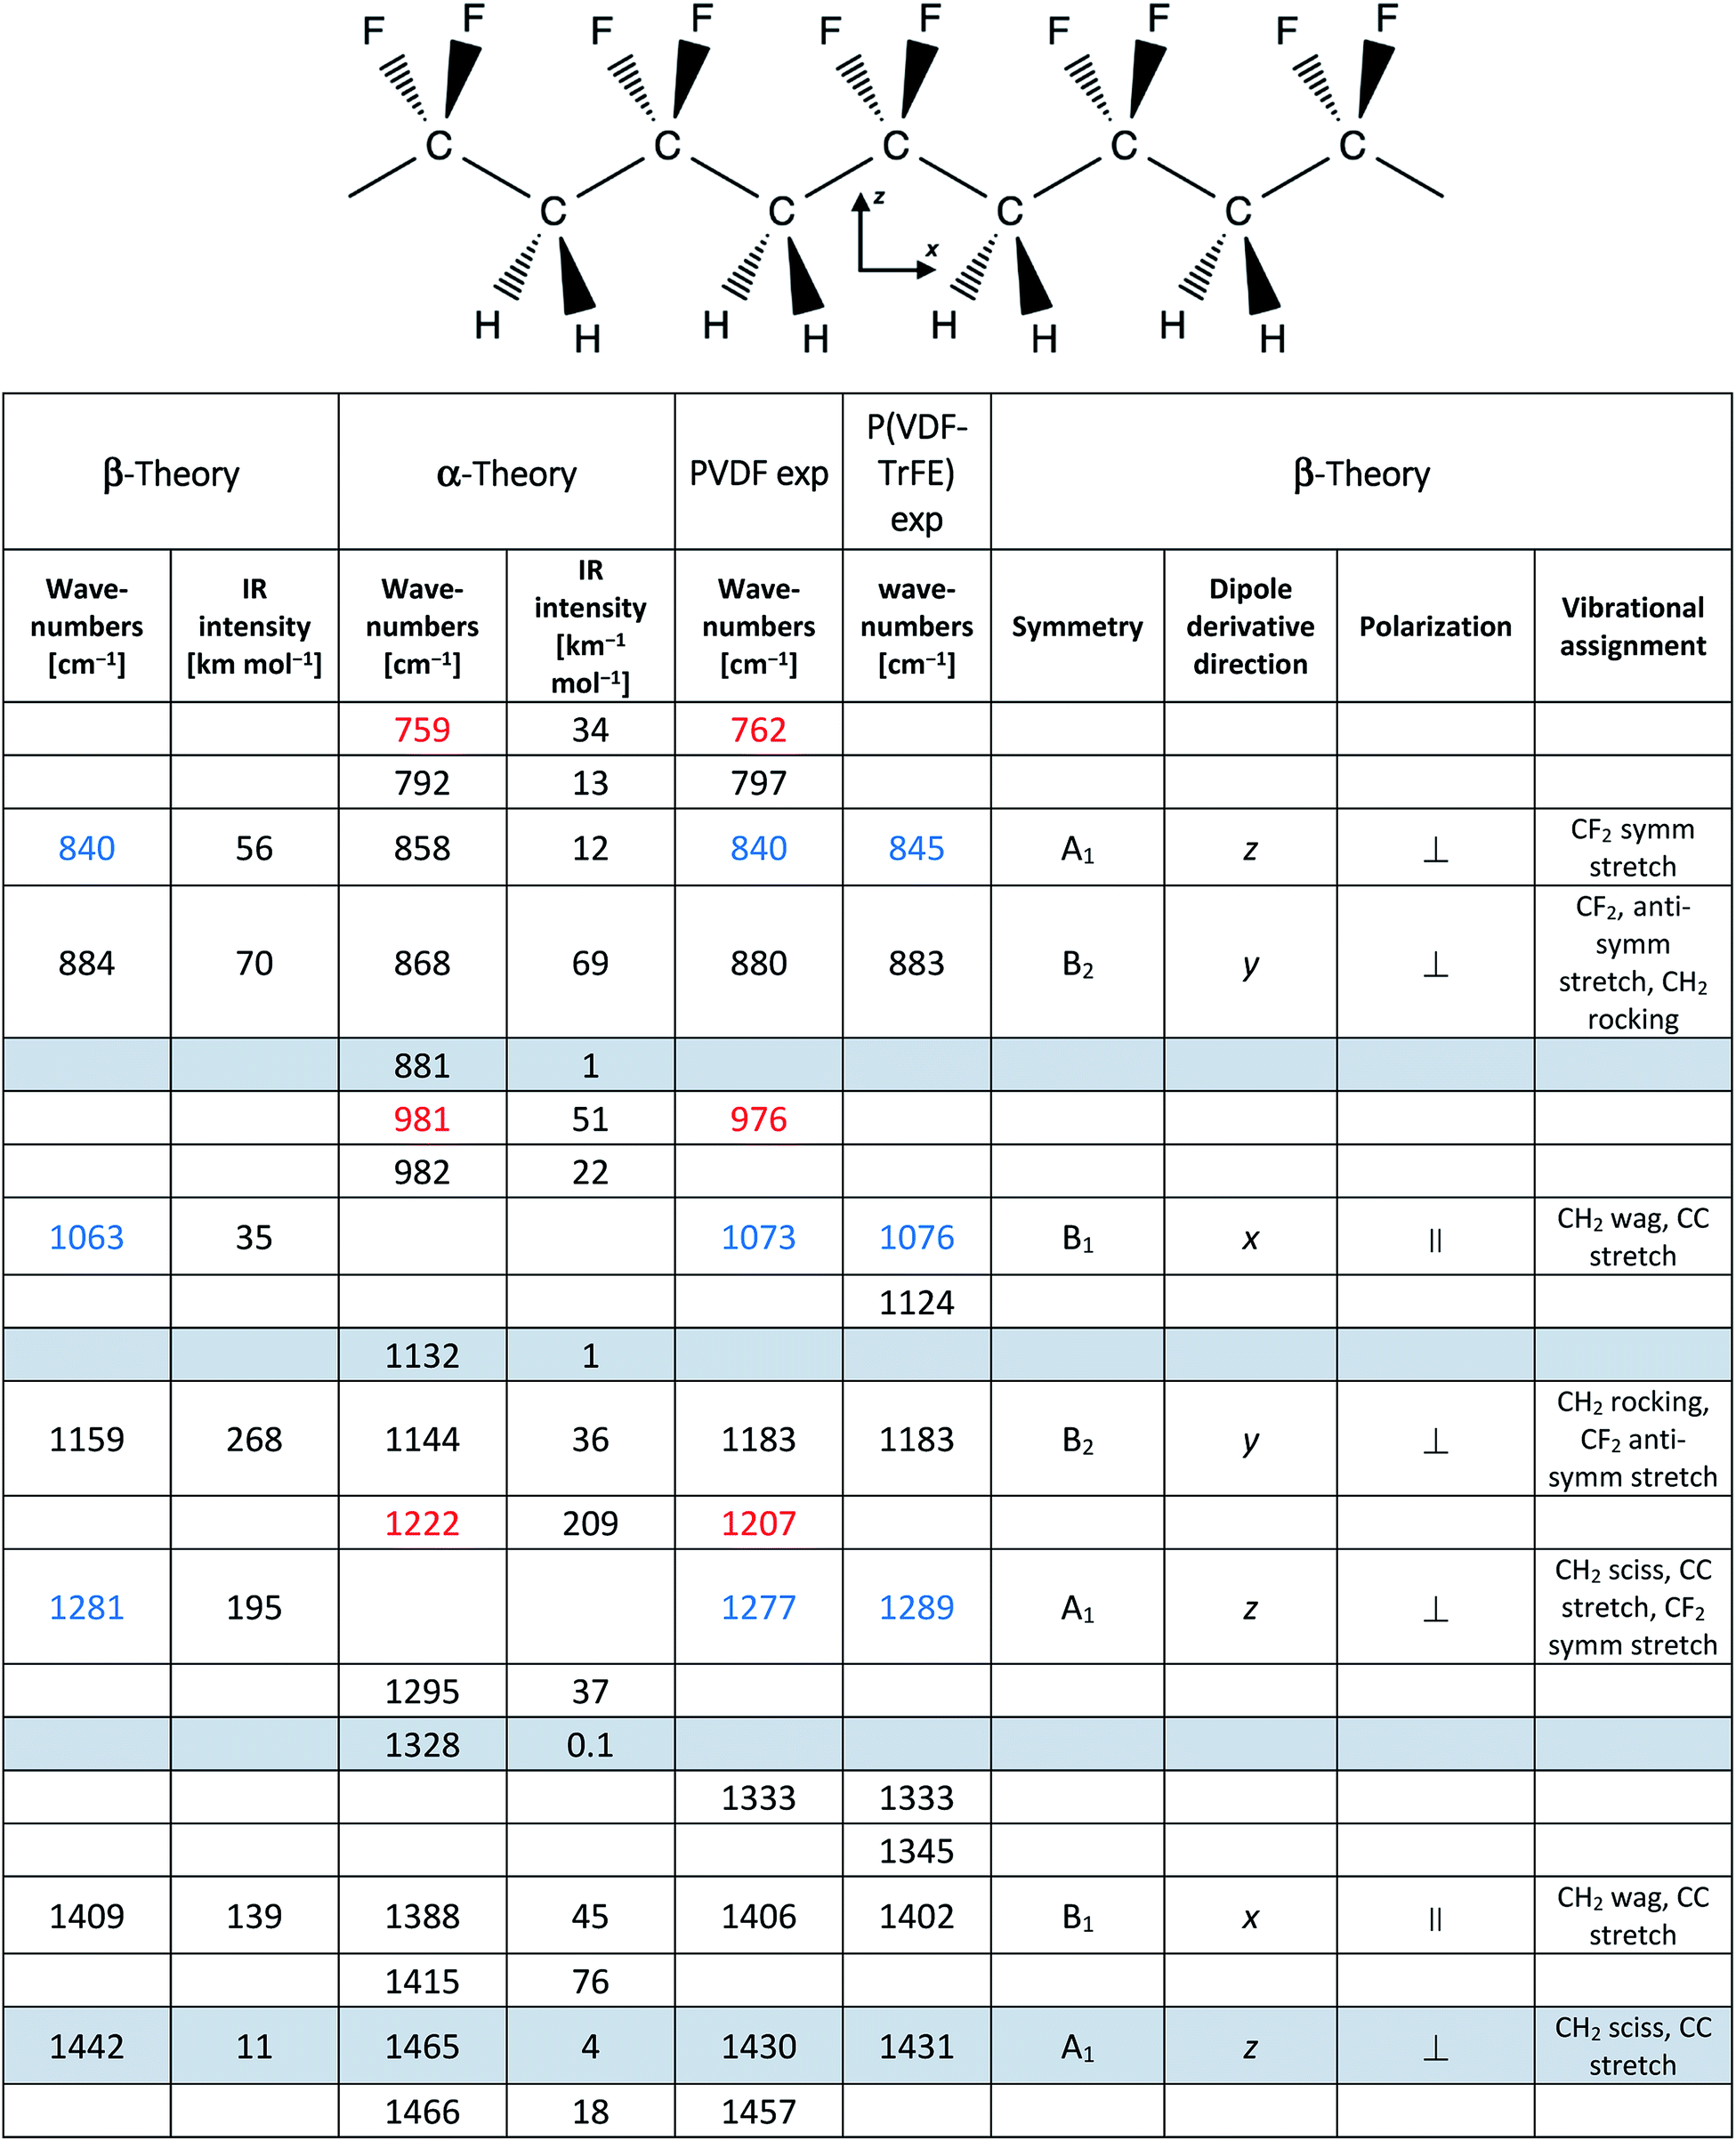
In Table 1 we report the wavenumbers of the Γ point phonons computed by DFT (ref. 22) for the α and β phases of PVDF (β phase markers are typed in blue, and α phase markers are typed in red). We also report in Table 1 the wavenumbers of the main peaks of spectrum c of PVDF, which show a good match with the computed wavenumbers of transitions with non-negligible IR intensity. The rows of Table 1 that correspond to bands with very small IR intensities are highlighted with a grey background. Because of the very weak intensities, such computed transitions can be hardly recognized among the experimental features present in the IR spectra.
Both the β and α phase contribute to the spectrum c, where several markers appear, namely:
- β phase: 840, 1073 and 1277 cm−1
- α phase: 762, 976 and 1207 cm−1
Remarkably, in the spectrum b of PVDF the α phase markers practically disappear, which indicates that this sample mainly contains the β phase. Other strong features of spectra b and c can be put in correspondence with wavenumbers computed for both α and β phase PVDF crystals. Indeed, DFT calculations predict that some strong IR transitions are close in frequency (within 20 cm−1) for the two crystal polymorphs: the data associated to such bands are listed in Table 1 in the same row and are typed in black. We conclude that the corresponding experimental features, namely the bands at 880, 1183 and 1406 cm−1 in the spectrum c – only slightly shifted in the spectrum b – are scarcely sensitive to chain conformation, and both the α and β phase concur to the total intensity of such features. Furthermore, to such three bands are expected to contribute also the IR absorptions from the amorphous phase (i.e., loosely packed chains with disordered conformations) and the IR absorptions from defective chains belonging to crystalline domains (or lying on lamellae surfaces). Thus, their observed peak wavenumber is determined by the convolution of several contributions, slightly shifted in wavenumber.
Considering now the spectrum of the copolymer (spectrum a), we notice that several strong absorptions can be put in correspondence with those assigned to the β form of PVDF. In particular, we identify the two markers of the β phase at 845 and 1076 cm−1, which display a little shift with respect to the corresponding bands of PVDF. A more pronounced upshift (∼20 cm−1) is found for the band of the copolymer at 1289 cm−1, which may be correlated to the third marker of β-PVDF (1277 cm−1).
Furthermore, the three strong transitions peaked at 883, 1183 and 1402 cm−1 in the spectrum of the copolymer find a nice correspondence with the main bands at 880/883, 1183/1178 and 1406/1402 cm−1 of PVDF (spectra c/b).
Despite that P(VDF-TrFE) is known to crystallize only in the same β phase of PVDF, its main “crystallinity” bands are characterized by large FWHM (full width at half maximum), ranging from 40 and 20 cm−1 (Table SI1†). This is suggestive that a variety of crystalline domains, with different size and degree of perfection, contribute to the IR transitions.‡
Among the main absorption peaks of P(VDF-TrFE) in the analysed spectral range, only the band at 1124 cm−1 (marked with a triangle in Fig. 1) could not find any correspondence in the spectra of PVDF. This strongly suggests that this band is related to vibrational modes localized on the TrFE units. Therefore, the 1124 cm−1 band can be useful to diagnose the copolymer composition.
Moreover, we clearly detect two weak features (1333, 1345 cm−1) in the spectrum of P(VDF-TrFE), which correspond to the broad and weak band of PVDF (1333 cm−1), and which cannot be related to any transition of PVDF crystals computed by DFT. We also observe in the absorption spectrum of P(VDF-TrFE) a broad feature centred at about 950 cm−1, at the same wavenumber of the crystallinity band of the α phase of PVDF. According to ref. 41 the PVDF feature at 1333 cm−1 is a crystallinity band of B1 symmetry, tentatively assigned to a combination transition involving the excitation of one B2 and one A2 phonon; the 1345 cm−1 component, characteristic of the copolymer, could be ascribed to a local mode on TrFE units.
All the spectra reported in Fig. 1 show weak absorptions in the range of 1220–1250 cm−1 and an asymmetric tail on the high-wavenumber side of the ∼880 cm−1 peak. We ascribe such features to contributions from disordered domains, as described in the literature34 and confirmed here by the thermal evolution of the spectra (see below).
3.2 DFT models of the markers of the TrFE units
We illustrate here some results from DFT calculations (B3LYP/6-31G(d,p)) of the vibrational spectra of two simplified molecular models, describing a sequence of P(VDF-TrFE) units in the characteristic trans-planar conformation of the β phase. Such models are sketched in Fig. SI6.† The model 10VDF is an oligomer containing 10 VDF repeating units; the model 9VDF-TrFE is the derivative of 10VDF with the central VDF unit replaced by the TrFE monomer. The IR spectra simulated from the results of DFT calculations are compared with the experimental spectra in Fig. SI7,† to support the identification of vibrational modes and related IR markers characteristic of the presence of dilute TrFE units (i.e., CFHCF2) in P(VDF-TrFE).Regardless of the possible predictive limitations of gas-phase molecular models applied to experiments in the condensed phase, focusing on normal modes localized on the chemical defect it is possible to establish a correlation between calculations and experiment, supported by the analysis of the vibrational eigenvectors. In particular, the band observed at 1124 cm−1, previously assigned to markers of the TrFE units, finds a nice correspondence with some localized modes of 9VDF-TrFE, whose computed wavenumbers after scaling are 1102 cm−1 and 1113 cm−1. Such modes originate vibrational absorptions that are absent in the simulated spectrum of 10VDF. The corresponding normal modes show a large content of CF stretching vibrations localized on the CHF group of the central TrFE unit (see nuclear displacements in Fig. SI9†).
Based on experimental evidence, we guessed to find contributions from modes related to the TrFE unit also in the 1300–1350 cm−1 region. No strong new absorption of 9VDF-TrFE shows-up in this region; however, a careful analysis of the normal modes allows identifying two modes at 1341 and 1366 cm−1, which involve large contributions from CH bending vibrations mainly localized on the CHF unit (Fig. SI9†). Such modes can be related to the observed 1345 cm−1 feature. DFT calculations on models of P(VDF-TrFE) described as 1-D crystal confirm such assignments (see ref. 61).
3.3 P(VDF-TrFE) and PVDF after melting
Fig. 1 also illustrates the effect of the melting on the spectra of PVDF and P(VDF-TrFE). The spectra of the two melts (dashed curves) show three main bands at 881/883, 1196/1193, and 1397/1397 cm−1, which are found at about the same wavenumber for PVDF and P(VDF-TrFE) respectively. Such features are very close to the strong bands of solid PVDF and P(VDF-TrFE) (observed at 880/883, 1183/1178 and 1406/1402 cm−1), which are scarcely sensitive to the kind of crystal phase. However, on such three absorption features the melting induces remarkable broadening and wavenumber shift.In the melt, the two bands of P(VDF-TrFE) at 883 cm−1 and 1193 cm−1 show the appearance of pronounced shoulders in their higher wavenumber side. Such behaviour – also observed in PVDF – confirms that these are markers of conformational disorder. This is proven by the remarkable monotonic increase of their intensity with increasing temperature, clearly shown in Fig. 2.
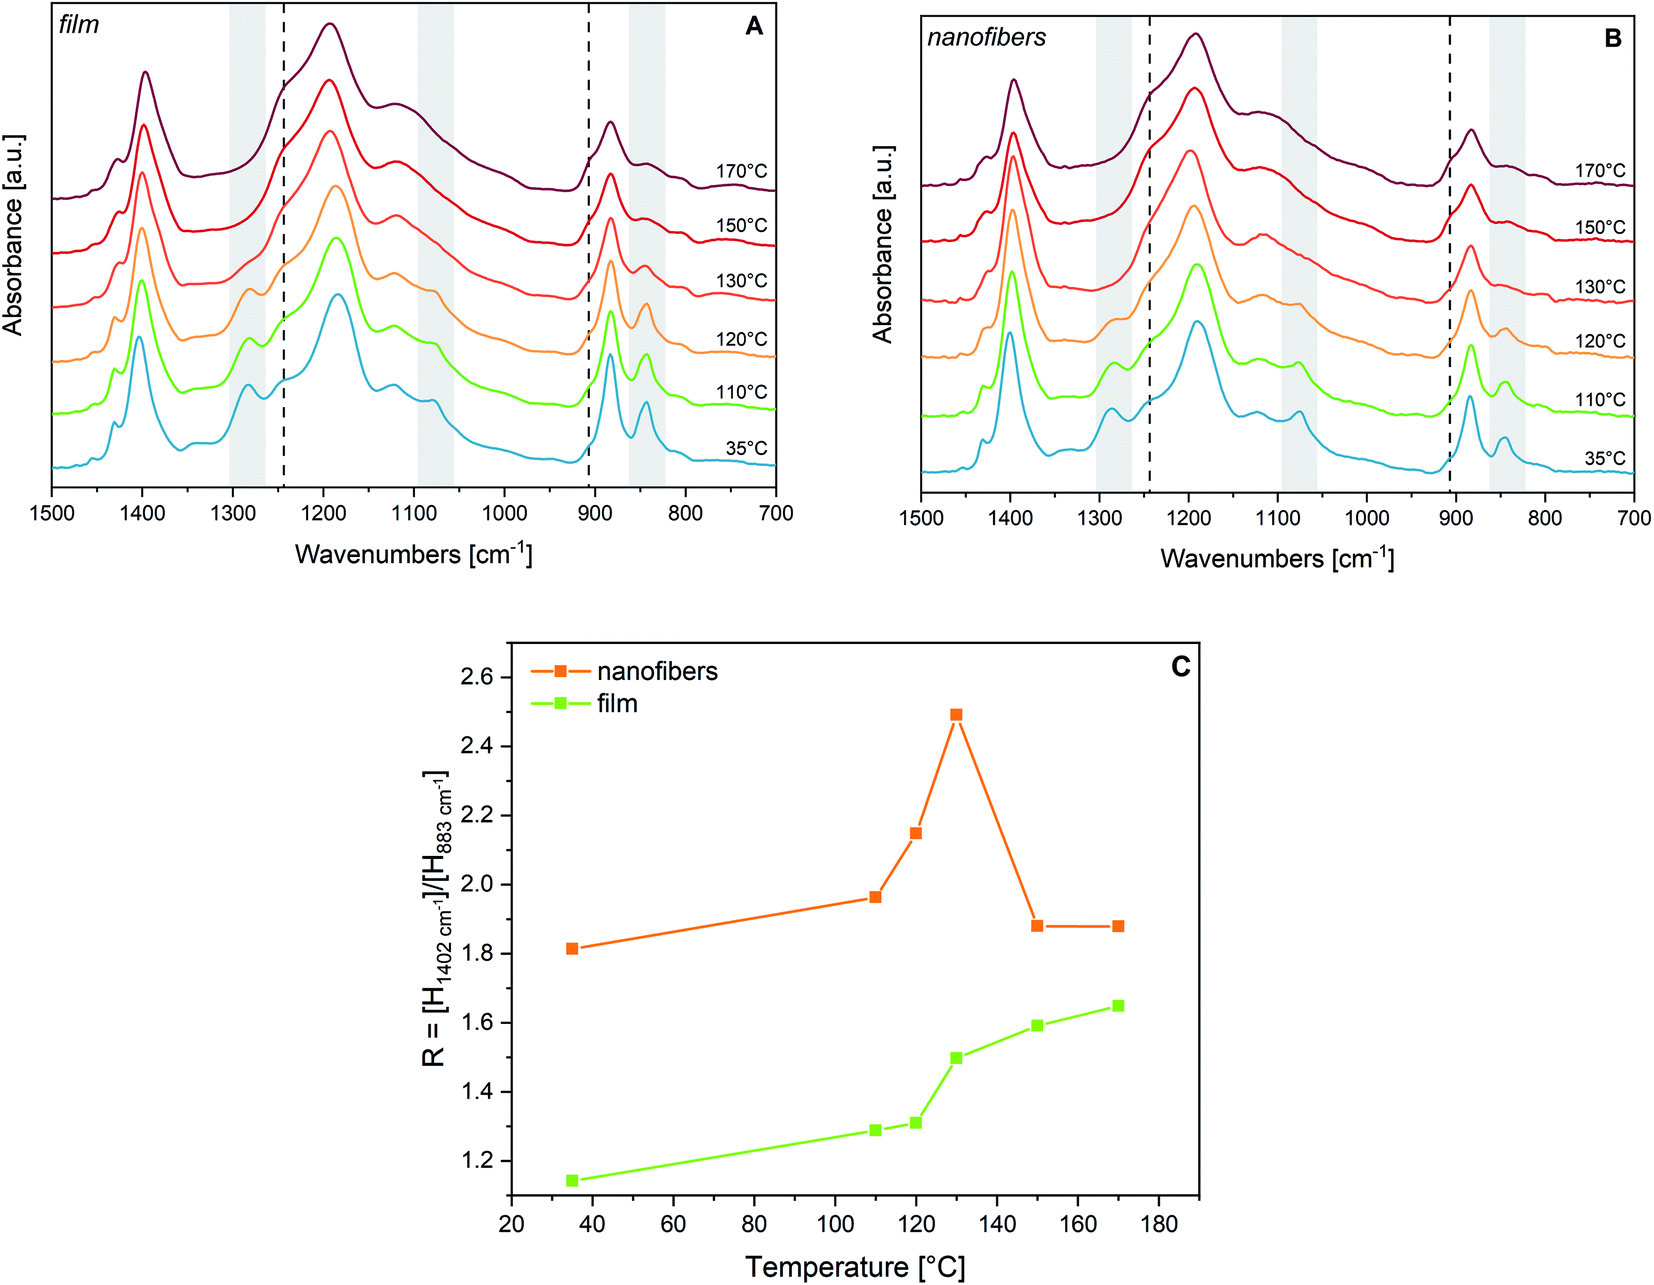 | ||
| Fig. 2 Panel A: IR spectra of a P(VDF-TrFE) film at increasing temperatures. Panel B: IR spectra of P(VDF-TrFE) nanofibers at increasing temperatures. Dashed lines indicate shoulders growing with heating. Markers of the crystalline β phase are highlighted in grey. Panel C: Peak height ratio between the two infrared bands at 1402 cm−1 and 883 cm−1: evolution with temperature for a P(VDF-TrFE) film (green line) and a fibres sample (orange line). All spectra are normalized on the central 1183 cm−1 peaks. | ||
Remarkably, the feature at 1235 cm−1 (the shoulder of the main peak at 1195 cm−1) is clearly detected also in solid samples at room temperature: on such basis, it is considered a marker of conformational disorder in solid semi-crystalline samples.
The three β phase markers disappear after melting, which provides further validation of their assignment. Notably, the P(VDF-TrFE) band at 1289 cm−1, so far assigned to the β phase by exclusion (see Section 3.1), shows the behaviour expected upon melting for a “crystallinity” band.
The characteristic peak of P(VDF-TrFE) at 1124 cm−1 originates upon melting a broader absorption band. It is the only feature that allows to discriminate between PVDF and P(VDF-TrFE) at high temperature, thus confirming that it is associated with the presence of the TrFE units.
3.4 Structural changes of P(VDF-TrFE) film at Tc and annealing
We have followed by IR spectroscopy the heating of a P(VDF-TrFE) film (Fig. 2, panel A). The two spectra at 120 °C and 130 °C correspond to temperature conditions which are approximately 5 °C below and 5 °C above the Curie temperature. Passing through this phase transition, we observe a remarkable broadening and shift of the “crystallinity” bands of the β phase (highlighted in grey in Fig. 2(A)). According to previous works,30,33–35,62 the disappearance of such bands proves that the polymer chains assume a different packing motif, with a drastic reduction of the trans-planar conformational order. Because of the thermal expansion of the lattice, intense rotational/torsional motions of the chains are expected to take place. Based on XRD experiments at Tc, the structure of the lattice corresponds to the hexagonal packing of the chains,30,33,54–56 which gives rise to non-polar para-electric domains; some authors29,52 describe this phase as the analogue of the α phase of PVDF, with chains adopting a regular GTG′T conformation. Looking at Fig. 2(A), we observe that, while approaching Tc, there is a clear, continuous evolution of the two shoulders at about 1235 cm−1 and 905 cm−1, which reach their maximum intensity in the melt. Accordingly, we conclude that conformational defects (gauche defects) are promoted by thermal energy supply. However, from spectra analysis, we do not find evidence of the formation of the α-like phase: the characteristic conformation-sensitive α-markers of PVDF (762, 976 and 1207 cm−1) do not show up as new absorption features above the Curie temperature (Fig. 2(A)). Such observation agrees with ref. 30, 55 and 56.The inexact interpretation of the transition of P(VDF-TrFE) to the α phase at Tc, sometimes reported in the literature,29,52 can be justified by considering that the only one conformational defect (kink) that can be easily hosted in a crystal made of fully trans-planar chains is indeed the GTG′ sequence, which does not alter the overall direction of the polymer chain. Indeed, the same sequence of torsional angles occurs in PVDF chains belonging to the α crystals, which show a regular conformation made by the repetition of the (TGTG′)n sequence. Indeed, normal modes localized on GTG′ defects embedded in a fully trans chain can occur close to some vibrational frequencies of the α crystal. However, crystallinity bands associated with collective phonons of the α form, cannot show-up in the presence of randomly distributed GTG′ defects that are expected in P(VDF-TrFE) at Tc. Remarkably, the presence of a hexagonal pre-melting phase was observed several years ago in n-alkanes63 and was widely investigated by means of vibrational spectroscopy.64 Also in such circumstances, GTG′ defects can develop inside the crystal, which under this respect show intriguing analogies with the transition at Tc of P(VDF-TrFE).30,41,55,56
We compare in Fig. 3(a) the spectrum of a P(VDF-TrFE) film annealed above Tc with its spectrum before the thermal treatment. Interestingly, the features at 1235 cm−1 and 905 cm−1 weaken after annealing, suggesting that such thermal stimulus allows chain rearrangements with a decrease of the conformation defects. This phenomenon should increase the amount of all-trans sequences, fostering molecular packing in new (or less defective) β domains. This is supported by the intensification of the crystallinity bands at 845, 1076 and 1289 cm−1. Moreover, some absorption features become less broad, particularly in the 1000–1150 cm−1 region. For instance, the FWHM of the 1183 cm−1 band reduces from 74 cm−1 to 58 cm−1 upon annealing (see also Table SI1†).
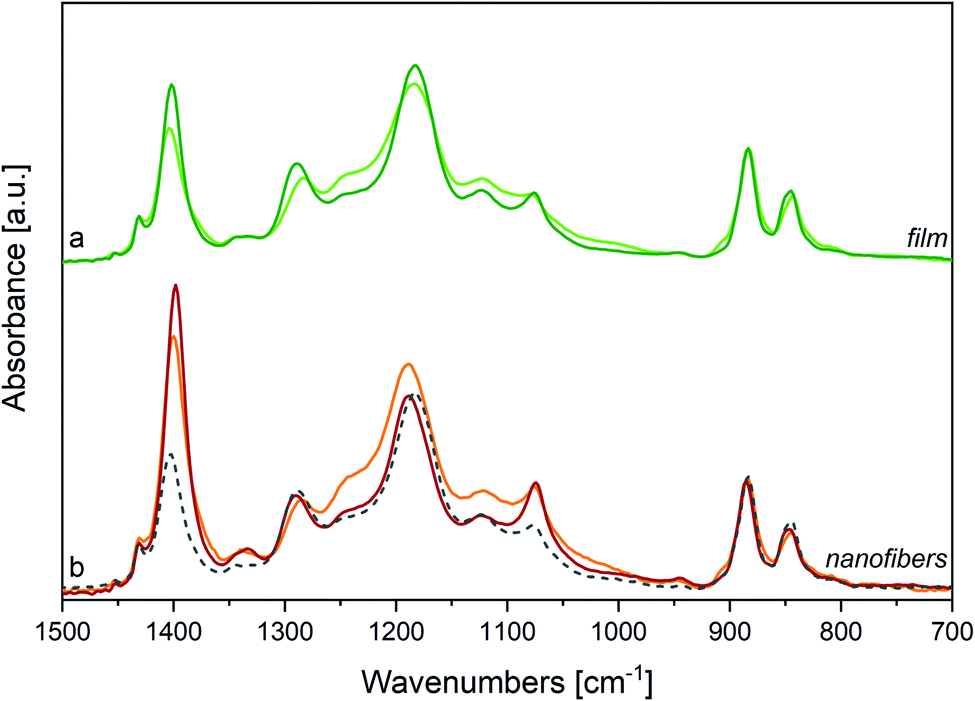 | ||
| Fig. 3 (a) IR spectra of a P(VDF-TrFE) film at room temperature, before (light green line) and after annealing at T = 135 °C (deep green line). (b) IR spectra of electrospun P(VDF-TrFE) nanofibers at room temperature, before (orange line) and after annealing at T = 125 °C (red line), and of the same sample cooled at room temperature after melting (dashed line). Spectra normalized on 883 cm−1 peaks. | ||
In Fig. 3(a) a further experimental observation deserves a comment: upon annealing the strong absorption at 1402 cm−1 significantly intensifies. As it will be better clarified later (discussing the IR spectra of electrospun nanofibers), this band is a sensitive probe of the orientation of polymer chains. Therefore, such intensity change observed for the band at 1402 cm−1 can be ascribed to a modification of the film morphology upon annealing, accompanied by a preferential orientation of the crystal lamellae with respect to the plane of the slide onto which the film is deposited.
In the hypothesis that the annealing-induced changes in the spectrum are mainly due to a crystallinity increase (i.e., β phase increase), we inferred the spectrum of the pure β phase by spectra subtraction. We subtract from the spectrum after annealing (Ann) – which is more abundant in β phase – the spectrum obtained before annealing (i.e., the spectrum of the pristine film, Pr) (Fig. 4, panel A). As expected, the difference of the spectra, Ann − Pr, shows a different intensity pattern with respect to the spectrum before subtraction, with a clear change of the intensity ratios among the marker bands of the β phase and the three bands independent from chain conformation, whose intensity is affected by contributions from the amorphous phase in the spectrum before subtraction (Ann). We report in panel A of Fig. 4 also the difference of the spectra Pr − Ann, which is representative of the disordered material that undergoes structural rearrangement upon annealing. It shows features similar to those of the melt, but it also displays interesting differences. The main peaks, and in particular the strong band at about 1195 cm−1, are shifted. As expected, the bands assigned to conformational defects (905 and 1235 cm−1) are present both in the difference spectrum (Pr − Ann) and in the spectrum of the melt. Moreover, close to the markers of the β phase, the difference of the spectra Pr − Ann shows also some absorptions (840 and 1275 cm−1) that are completely absent for the melt. Such features might be ascribed to trans-planar sequences in a different environment from that of the bulk β phase. For instance, this could happen for very short trans-planar polymer sequences, for trans-planar sequences not arranged in a crystalline domain, or for chains belonging to very defective crystals, or belonging to crystal surfaces.
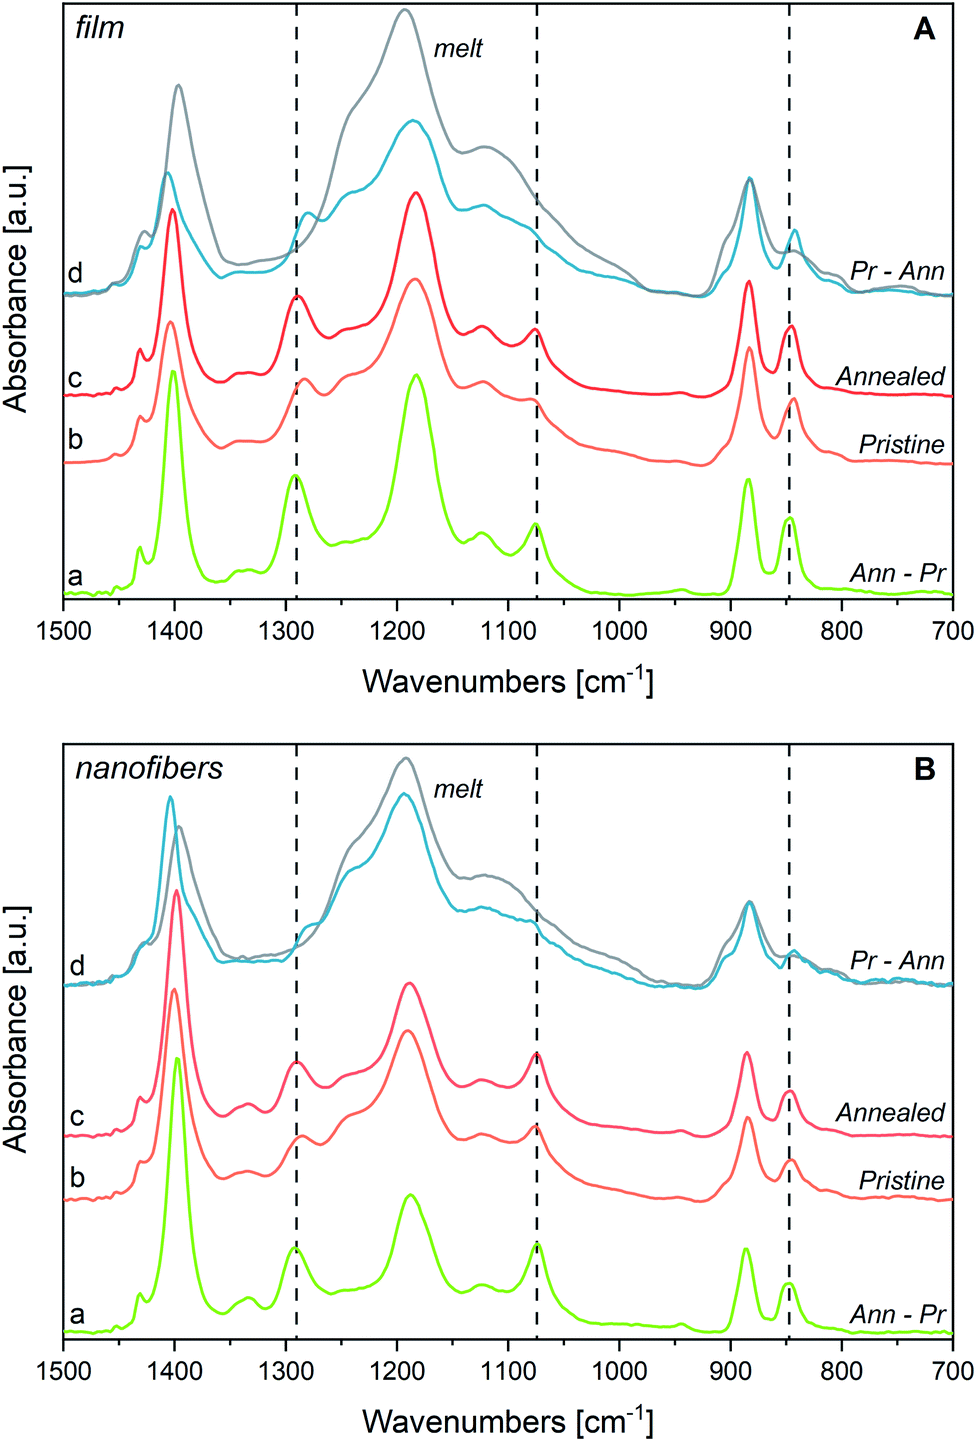 | ||
| Fig. 4 Panel A: P(VDF-TrFE) film, (a) spectrum obtained as the difference between the IR spectrum after annealing (annealed, c) and that of the same sample before annealing (pristine, b); (d) difference between the IR spectrum before annealing (pristine, b) and that of the sample after annealing (annealed, c). On spectrum (d) is also reported in grey the spectrum of the melt. Panel B: same difference spectra (a), (d) for P(VDF-TrFE) nanofibers. Spectra of the samples at room temperature, pristine (b) and annealed (c) and of the melt (d, grey) are reported for sake of comparison. Spectra normalized on 883 cm−1 peaks. | ||
Interestingly, the two features at 1333 and 1345 cm−1, previously mentioned as characteristic absorptions of P(VDF-TrFE), are clearly evident in the spectrum inferred for the pure β phase (Ann − Pr), while just the component at 1345 cm−1 survives in the spectrum (Pr − Ann) that represents the disordered component. This is a further indication that the band at 1333 cm−1 is typical of the β phase, whereas the component at 1345 cm−1 is a local mode of the TrFE unit. In a similar way, the marker band at 1124 cm−1 – assigned to vibrations localized on TrFE units – shows contributions in both difference spectra, as expected for a defect mode scarcely sensitive to the morphology of the environment.
The analysis discussed above is compared with the results obtained by the principal component analysis (PCA) of the IR spectra,30 from which the authors inferred the reference spectra ascribed to the crystalline and to the amorphous phase of a VDF-TrFE (75/25) copolymer. Such PCA-derived spectra30 show a very impressive similarity with those empirically obtained in this work, even to some minor details.
In conclusion, the analysis of the IR spectra of P(VDF-TrFE) in comparison with the spectra of PVDF films, and the results of DFT calculations allow stating that:
(1) The crystalline phase of P(VDF-TrFE) is similar to the β phase of PVDF, with marker bands at 845, 1076, and 1289 cm−1. Such markers are sensitive to the chain conformation and prove that the chains in the crystalline domains are trans-planar. The difference spectra between samples that are more crystalline (annealed P(VDF-TrFE) film) and more disordered (pristine P(VDF-TrFE) film), suggest that fully trans sequences can be found both in crystal domains and in disordered environments. Indeed, the crystallinity bands shadow non-negligible contributions (slightly displaced at lower wavenumbers) from trans-planar sequences not fully packed in a crystal.
(2) The band at 1124 cm−1 and the weak features at 1345 cm−1 are markers of TrFE units.
(3) The weak band at 1333 cm−1 behaves with temperature as a “crystallinity band”: for this reason, it should be assigned to the crystalline domains. Being absent in DFT calculations within the harmonic approximation, such band could be tentatively ascribed to a second-order transition, in analogy with the assignment proposed for the corresponding feature of PVDF.41
(4) The features at 1235 cm−1 and the high-frequency shoulder of the 883 cm−1 band observed at 905 cm−1 are markers of conformational defects; these are already present in the solid phase (amorphous component) and their contribution increases with temperature.
3.5 P(VDF-TrFE) nanofibers: structural characterization from IR spectra
Electrospinning not only represents an effective method to improve the β phase content in fluorinated polymers and copolymers, but it also opens to a wide range of nanostructure-based devices. PVDF65–72 and P(VDF-TrFE)9,11,34,37–39,52,53,73–78 nanofibers also offer the advantages of electrospinning to develop materials with a macroscopic orientation of the polymer chains.Here, the rationale coming from the spectroscopic evidence on P(VDF-TrFE) obtained before allows for the interpretation of the peculiar structural properties of P(VDF-TrFE) electrospun nanofibers. Before assessing the effect of thermal treatments on the nanofibers, it is necessary to compare the IR spectra of nanofibers and films. In Fig. 5 we compare the IR spectra of three samples: a P(VDF-TrFE) film, a mat obtained by deposition of electrospun nanofibers and a sample of macroscopically aligned electrospun nanofibers, analysed in polarized light (Fig. 5(b)). We can make several observations:
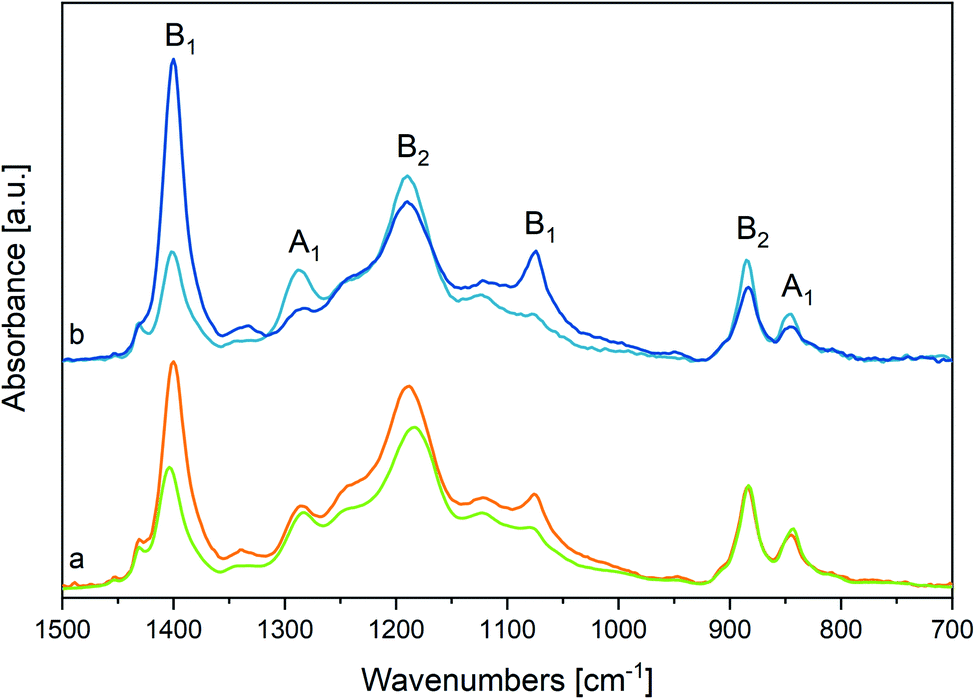 | ||
| Fig. 5 (a) Comparison between the IR spectrum of a P(VDF-TrFE) film at room temperature (green line) and that of an electrospun nanofibers random mat (orange line). Spectra normalized on 883 cm−1 peaks. (b) IR spectra of a nanofibers sample showing macroscopic orientation of the fibre axes. The spectra are recorded in polarized light in the direction parallel (deep blue line) and perpendicular (light blue line) to the fibres' axis. | ||
(i) The main peaks of the films coincide with those of the fibres: notably, the β phase markers are present in both samples, which proves that the electrospinning does not prevent the formation of β phase crystals;
(ii) The bands at 1183 and 1402 cm−1 show a non-negligible peak shift towards higher and lower wavenumbers, respectively. Because these bands shadow the contribution of domains characterized by different morphologies (see discussion, Section 3.1), this behaviour indicates that contribution from the pure β phase and from the disordered phases are different in fibres and film samples (see Section 3.1);
(iii) For the fibres mat, a remarkable intensity increase is observed for the two B1 bands at 1402 cm−1 and 1076 cm−1;
(iv) The weak band at 1333 cm−1 is more pronounced for fibres;
(v) The feature ascribed to conformational defects at 905 and 1235 cm−1 are slightly stronger for fibres;
(vi) The intensity ratio between the crystallinity band at 845 cm−1 and the band at 883 cm−1 slightly decreases in the case of fibres;
(vii) Aligned nanofibers (Fig. 5(b)) show a clear parallel polarization of the B1 bands, while A1 and B2 bands have perpendicular polarization. Remarkably, the weak band at 1333 cm−1 exhibits parallel polarization.
Observations (ii), (v), (vi) suggest that the β phase amount in the fibres mat is lower than in the film, because of the quick solidification induced by rapid solvent evaporation occurring during electrospinning.52,53
Observation (iii) and (iv) can be rationalized considering anisotropy in molecular orientation induced by electrospinning. Because of the B1 symmetry of the associated phonons, the two bands at 1183 and 1402 cm−1 exhibit a dipole moment vector variation directed along the polymer chain axis. The parallel polarization behaviour of such two bands in aligned nanofibers (point vii, see Fig. 5(b)) indicates that in nanofibers the polymer chains are mainly directed parallel to the fibre axis. Based on this evidence, the behaviour of the IR intensity of the fibres mat (point iii) can be easily rationalized, considering that the long axis of the fibres runs parallel to the substrate surface as shown by SEM images (Fig. SI1 and SI3†). A detailed discussion of the intensity pattern of the IR spectrum of fibres, based on symmetry analysis,79 is reported in ESI.† The relevant result is that the intensity behaviour observed for the fibres mat can be definitely taken as the proof that the polymer chain axes are mostly oriented along the fibre axis, while drop cast films can be described as made by an isotropic distribution of crystallites.
Furthermore, based on the above discussion of the annealing of a P(VDF-TrFE) film, we explain the observed intensification of B1 absorptions of the P(VDF-TrFE) film after annealing as the evidence of some re-arrangement of the crystallites with their c axis parallel to the substrate. Remarkably, the existence of preferential chains orientation in P(VDF-TrFE) films has been already pointed out in the literature.7,80,81
3.6 Thermal treatment of electrospun P(VDF-TrFE) nanofibers
Thermal treatments of fluorinated piezoelectric polymers and copolymers are often carried out to optimize their morphology.29,31,34,52,53,82,83 In particular, in the case of electrospun nanofibers, an increased piezoelectricity is expected after annealing above the Curie temperature, which can promote the epitaxial growth of new crystalline lamellae with polymer chains aligned to the pre-existing fibre core formed by stretch oriented, extended polymer chains. Indeed, chains belonging to the amorphous phase are already partially aligned after electrospinning, but a sudden loss of mobility due to fast evaporation of the solvent during the process may partially prevent crystallization. Moreover, the secondary crystallization occurring after annealing should guarantee the alignment of the new crystallites of the fibre core, possibly easing dipole orientation mechanisms.52,53In Fig. 3(b) we show the result of the annealing at 125 °C of a sample made by nanofibers (the temperature was set on the basis of DSC thermograms – see Fig. SI5†).
The comparison with the spectra obtained after annealing of the film shows that the thermal treatment induces similar modifications in samples with different morphology, promoting in both cases the reduction of conformational defects and a general increase of crystallinity. Moreover, the crystallinity bands sharpen. This is proved by the FWHM of the 1183 cm−1 band, which upon annealing reduces from 74 cm−1 to 58 cm−1. Interestingly, the annealing process, which exploits the increased mobility of the chains at high temperature, probably reinforces the original polymer chain orientation, mainly directed along the fibres. This is proven by the intensity pattern after annealing, which shows intensification of bands assigned to B1 phonons. Similar observations were done in ref. 50, considering the behaviour in polarized light of stretch oriented samples heated above Tc.
The above conclusion is further supported by the observed evolution of the IR spectra during thermal treatment of a fibres sample (Fig. 2, panel B). The changes of the IR pattern parallel what is observed in the case of the film, showing the loss of the β phase markers at the Curie transition, and a monotonic increase with the temperature of the bands associated to gauche defects. The trend of the absorption intensity of the B1 band at 1402 cm−1 (Fig. 2, panel C) is very interesting. For increasing temperatures below Tc the peak height ratio R of the 1402 cm−1 band to the 883 cm−1 band increases, in a parallel way, for both the film and the fibres. After melting the value of R tends to a common value. The trend of R from room temperature to Tc can be mainly ascribed to a remarkable broadening of the 883 cm−1 band. However, in fibres samples, the preferential molecular orientation with the polymer axis oriented along the fibre axis is kept up to Tc, as shown by the high R value, always larger than the R-value of the film by a factor of about 1.6.
By heating the sample up to melting and then cooling it back, crystallinity slightly increases, but chains are no more parallel to the substrate plane, as demonstrated by the weakening of the 1076 cm−1 and 1402 cm−1 peaks, giving rise to an intensity pattern very close to that of the cast film (Fig. 3(b), dashed line).
In conclusion, the annealing of a fibres mat at Tc < T < Tm allows to increase the crystallinity (β phase), with no loss of the planar orientation of the polymer chains, whereas heating at T > Tm followed by a slow cooling allows improving the crystal morphology, but results in an isotropic material.
Finally, we report in Fig. 4 (panel B) the spectra obtained as difference between the spectra of the fibres sample before and after annealing. Interestingly, the spectrum of the crystal phase (Ann − Pr) obtained for fibres shows a pattern very similar to that of the subtraction spectrum obtained for the film, with the notable exception of the intensity ratios between B1 and A1 (or B2) bands. In other words, the difference spectra coincide, except for the intensity behaviour of the B1 bands, which has been already rationalized as due to orientation phenomena that are pronounced for fibres.
Instead, the spectra (Pr − Ann), which were attributed to the disordered material which undergoes transformation upon annealing, are different in the two cases:
(i) The remarkably higher intensity shown by the fibres sample in the region 1100–1300 cm−1 indicates that before annealing the degree of crystallinity is lower in the fibres sample;
(ii) The relatively high intensity of the band at about 1400 cm−1 tells us that in the case of fibres the polymer segments lie in the substrate plane, although they do not belong to the crystalline phase;
(iii) The maximum of the band at about 1180 cm−1 is slightly displaced in the two samples, thus suggesting that the disordered phase of the film and of the fibres samples consists of a mixture of polymer chains with different structural characteristics, which are present in different amounts in the two samples.
4. Raman spectra of P(VDF-TrFE)
4.1 Vibrational assignment
We report in Table 2 the assignment of the Raman bands of P(VDF-TrFE) (crystalline β phase), as obtained by theoretical calculations on PVDF.22 Due to the C2v symmetry, the IR-active normal modes are also Raman-active. Moreover, also the IR-inactive A2 modes are expected to show up in the Raman spectrum. In Table 2, we highlight with bold-italics characters the wavenumbers of the β phase markers, which were obtained through the analysis of the Raman spectrum of PVDF.57| β-Theory | P(VDF-TrFE) 80–20 exp | P(VDF-TrFE) 80–20 exp | Symmetry species | ||
|---|---|---|---|---|---|
| Wavenumbers [cm−1] | IR intensity [km mol−1] | Relative Raman intensity | IR-wavenumbers [cm−1] | Raman-wavenumbers [cm−1] | |
| 81 | 9 | 0 | B2 | ||
| 251 | 11 | 264 | A2 | ||
| 434 | 33 | 15 | 417 | B1 | |
| 437 | 8 | 7 | B2 | ||
| 496 | 14 | 31 | 510 | A1 | |
| 840 | 56 | 100 | 845 | 841 | A1 |
| 883 | 70 | 23 | 883 | 882 | B2 |
| 1063 | 34 | 30 | 1076 | 1075 | B1 |
| 1158 | 268 | 18 | 1183 | 1170 | B2 |
| 1188 | 65 | ∼1200 (broad, vw) | A2 | ||
| 1280 | 195 | 26 | 1289 | 1286 | A1 |
| 1408 | 139 | 0 | 1402 | — | B1 |
| 1443 | 11 | 88 | 1431 | 1433 | A1 |
The strongest Raman transitions observed in Fig. 6 find a nice counterpart in the Raman data predicted by DFT (ref. 22) (Table 2). The experimental Raman spectrum of the β phase rich sample (Fig. 6(b)) is dominated by the sharp peak at 841 cm−1, which is assigned to the symmetric CF stretching “crystallinity” band of A1 symmetry. This line presents an intriguing behaviour: at difference from other Raman lines that show a good correspondence in position with their IR counterparts, the 841 cm−1 Raman line is shifted by about 5 cm−1 with respect to the IR band observed at 845 cm−1. This finding confirms a peculiarity already derived from IR experiments, through the analysis of difference spectra. Indeed, the vibrational bands of P(VDF-TrFE) usually considered as β phase markers, should be viewed as the convolution of several contributions, arising from a variety of crystalline domains with chains in fully trans conformation, and possibly from trans-planar polymer segments not fully packed in the crystal. Accordingly, the different position of the 845/840 cm−1 band in IR and Raman spectrum can be rationalized by considering that Raman and IR intensities are affected in different ways by the environmental effects felt by the trans-planar polymer chains (i.e., surroundings characterized by different polarity and crystal morphologies). This kind of phenomenology closely resembles the non-coincidence effect observed in polar liquids for Raman active bands corresponding to intense infrared absorptions.84,85
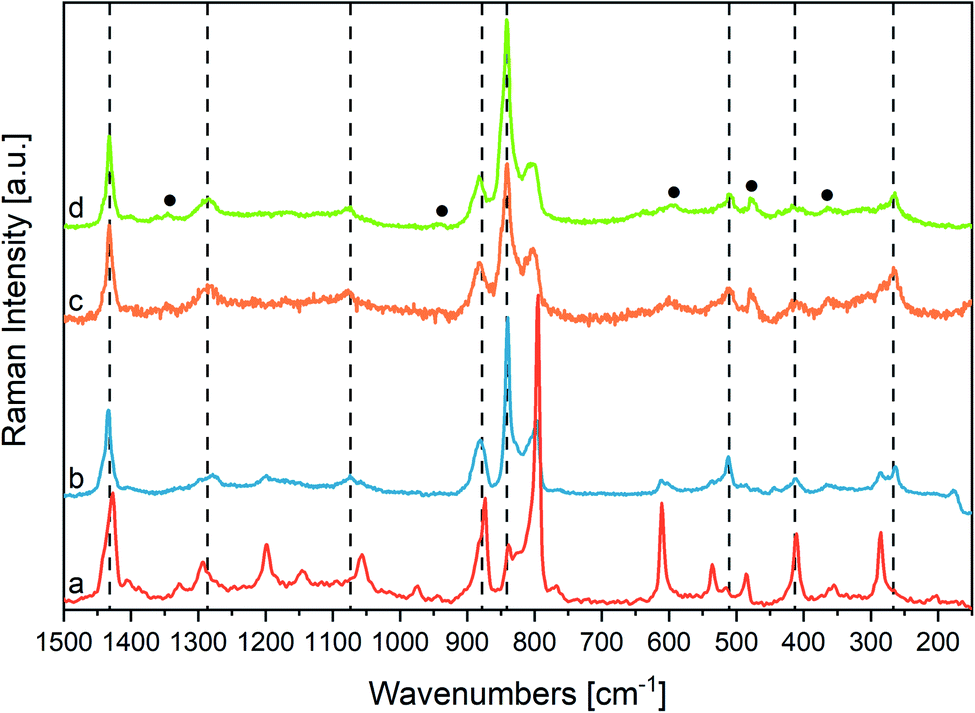 | ||
| Fig. 6 (a) and (b) Raman spectra of PVDF samples with different amounts of α and β phases (the (b) sample is richer in β phase than the (a) sample), (c) Raman spectra of P(VDF-TrFE) nanofibers (orange line), (d) P(VDF-TrFE) powder (green line); the dashed lines indicate fundamental transitions of the crystalline β phase; the black circles indicate extra-features, which can be ascribed to conformational or chemical defects. The Raman spectra have been normalized with respect to the 1433 cm−1 peaks. | ||
Interestingly, the A2 band computed by DFT at 1188 cm−1 for the β phase of PVDF shows a discrepancy with the experimental spectrum. Despite the sizeable computed Raman intensity, such A2 transition does not find any clear correspondence in the experimental Raman spectrum, which however shows several very broad and weak bands in the region 1100–1250 cm−1. This feature is a characteristic of the experimental spectrum of P(VDF-TrFE) copolymers, which parallels a similar behaviour of the β phase of PVDF. Instead of one only strong collective phonon of A2 symmetry, DFT calculations on models of a PTFE polymer containing chemical defects (i.e., TrFE units),61 display the appearance of several transitions involving CH2 twisting vibrations of the PVDF sequences variously coupled with vibrational displacements of the TrFE units (Fig. SI8†). This observation suggests that the presence of structural and/or chemical defects could result in the activation of several q ≠ 0 phonons characterized by different wavenumbers, as it happens for phonons belonging to rather steep dispersion branches, which span a wide wavenumbers range.
Other Raman features cannot be related to the transitions of an ideal β crystal, namely:
(i) The two weak features at 1345 and 1363 cm−1. The band at lower wavenumber possibly corresponds to the broad weak IR absorption at 1345 cm−1, assigned to modes involving (TrFE) units (see above); the higher wavenumber component does not find any corresponding feature in the IR spectrum, possibly because it is hidden by the strong and wide IR band at 1402 cm−1;
(ii) A peak at 939 cm−1, which shows a possible counterpart in the weak broad IR feature observed at 950 cm−1;
(iii) A strong broad band at 805 cm−1;
(iv) The broad bands at 601 and 642 cm−1, and a pair of weak features at 364 and 308 cm−1;
(v) The peak at 482 cm−1.
Features (iii) and (iv) can be tentatively assigned to disordered phases, containing gauche (G) defects; they are indeed rather close to features typical of the α phase of PVDF, which is characterized by the presence of G dihedral angles. This educated guess will be confirmed later based on the evolution of the spectra during heating. DFT calculations suggest that the features at 482 cm−1 and 1345 cm−1 are associated to modes involving the chemical defect (TrFE). See also ESI (Fig. SI8, SI9 and Table SI2†).
4.2 Effect of the annealing
In Fig. 7, we report the Raman spectra of a nanofibers mat (a) and of a powder sample (b), before and after annealing above their Curie temperature (Tc < Tann < Tm). The comparison of the Raman spectra before and after annealing shows small shifts of the main peaks, accompanied by a clear weakening of the most important features we ascribed to a disordered phase, namely the signal at 805 cm−1.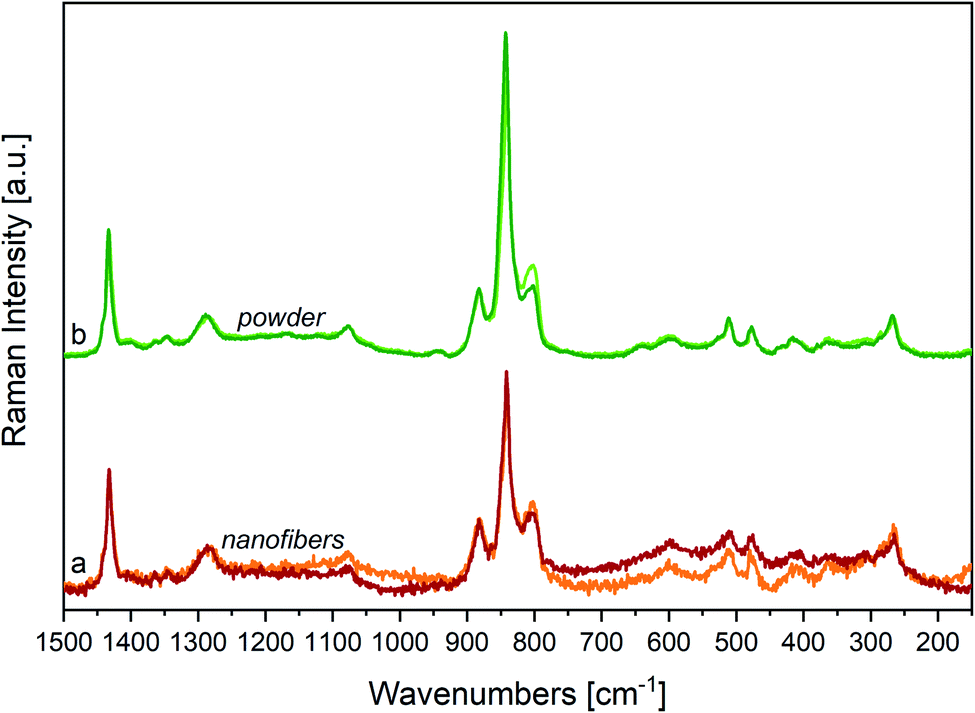 | ||
| Fig. 7 (a) Raman spectra of P(VDF-TrFE) nanofibers sample before (orange line) and after (red line) annealing at T = 130 °C; (b) Raman spectra of P(VDF-TrFE) powder sample before (light green line) and after (deep green line) annealing at T = 132 °C. Raman spectra have been normalized on 1433 cm−1 peaks. | ||
By a closer look at the strong features in the 900–800 cm−1 region, and by the analysis of difference Raman spectra (Fig. 8, panel B) we highlight some interesting phenomena:
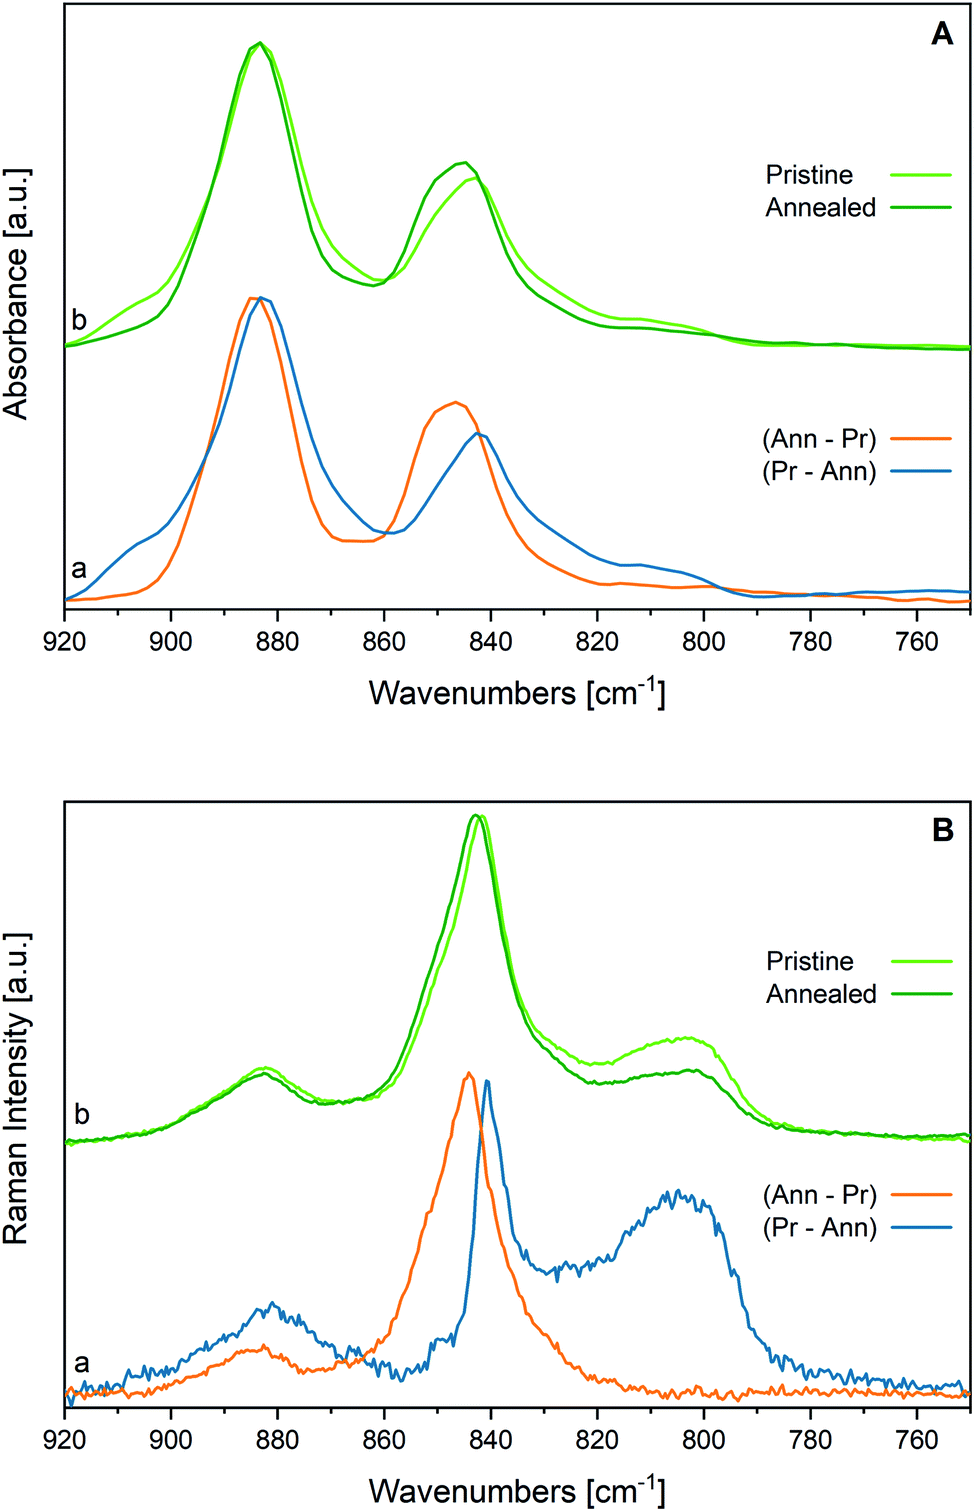 | ||
| Fig. 8 IR and Raman spectra of P(VDF-TrFE) samples in the 920–750 cm−1 region. Panel A: (a) Spectra obtained as subtraction of the IR spectrum at room temperature of a P(VDF-TrFE) film before annealing (pristine) from that obtained after annealing (annealed) (blue line) and vice versa (orange line); (b) IR spectra of P(VDF-TrFE) film at room temperature before (light green line) and after (deep green line) annealing. Panel B: (a) Spectra obtained as subtraction of Raman spectra at room temperature of the P(VDF-TrFE) powder before annealing (pristine) from that obtained after annealing (annealed) (blue line) and vice versa (orange line). (b) Raman spectra at room temperature of P(VDF-TrFE) powder before (light green line) and after (deep green line) annealing. | ||
(i) The peak position and the band shape of the “crystallinity” band at about 841 cm−1 is modulated by the thermal history of the sample, proving that such band is a convolution of contributions from matter showing a different spectroscopic response. In particular, a lower wavenumber component dominates in the spectrum of more disordered matter, which undergoes modification upon annealing (see the difference spectrum (Pr − Ann) drawn in blue). The spectrum of the more ordered phase (see the difference spectrum (Ann − Pr) drawn in orange) shows instead an impressive displacement of the “crystallinity” band at 845 cm−1, which is indeed the peak frequency observed in the IR;
(ii) As expected, the difference spectrum associated to the more ordered phase (Ann − Pr) does not show the broad features ascribed to conformational disorder;
(iii) Also, the band at 880 cm−1 shows a slightly different peak wavenumber in the two difference spectra.
Consistently, the IR “crystallinity” band at 845 cm−1 is the convolution of at least two different contributions with maximum at 845 and 841 cm−1 (see Fig. 8, panel A). Before any subtraction, in the IR spectra, this peak is very close to that of the higher wavenumber component, whereas in the Raman it is the opposite and the lower wavenumber component dominates in the spectra of the pristine material. Therefore, we can argue that the polymer segments organized in well-packed polar β crystals exhibit remarkably larger dipole derivatives – and consequently stronger IR intensities – than the all-trans chains belonging to a more disordered phase; however, the effect of a polar environment is not so remarkable for the Raman polarizability tensors. Such interpretation is nicely supported by DFT calculations of the spectra of PVDF crystals and isolated chains.22,61 This interesting spectroscopic behaviour certainly deserves further studies to unravel how the intermolecular interactions between polar bonds of CH2CF2 units in different relative geometries may affect the electron density and the spectroscopic response.61
4.3 Temperature dependence of the Raman spectra
Fig. 9 illustrates the temperature dependence of the Raman spectra of the powder (panel A) and of the fibres (panel B). For the powder, the crystallinity markers of the β phase broaden or practically disappear above the Curie temperature. As expected, after the Curie transition, we observe a remarkable intensity increase of the Raman features at 805 and 601 cm−1 ascribed to structural disorder (G defects). At Tc the 805 cm−1 band dominates the spectrum and it further grows during melting.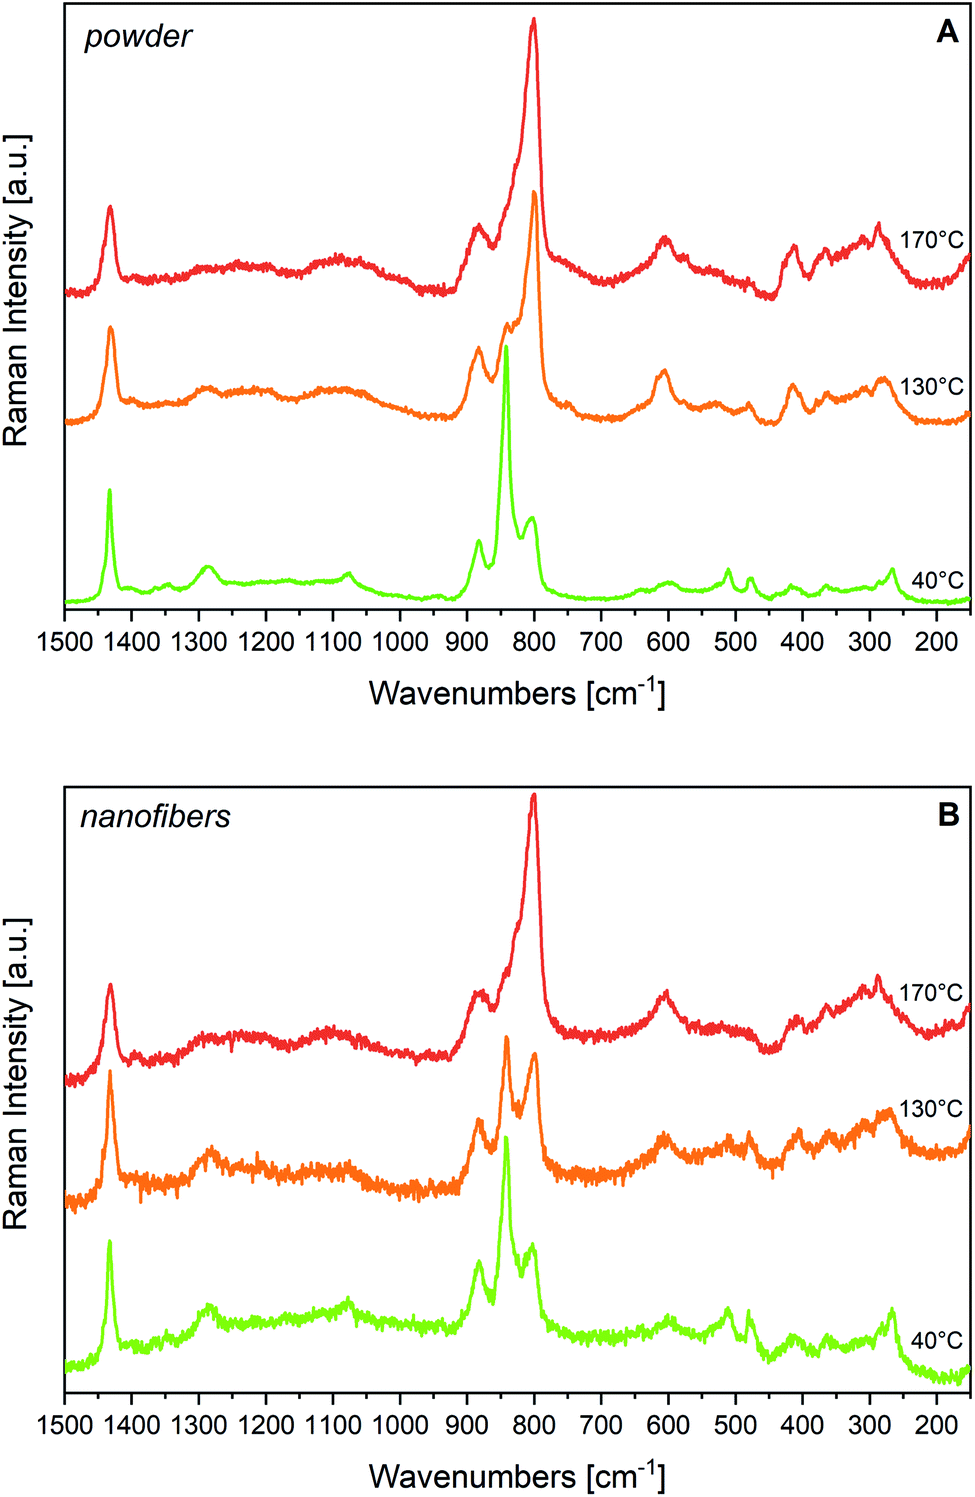 | ||
| Fig. 9 Panel A: Raman spectra of P(VDF-TrFE) powder at different temperatures. Panel B: Raman spectra of P(VDF-TrFE) fibres at different temperatures. Raman spectra have been normalized on 1433 cm−1 peaks. | ||
Consistently with IR, the Raman spectrum above Tc indicates that the Curie transition gives rise to a disordered crystalline phase, where several G defects are present; there is no evidence of the existence of conformationally ordered chains as those belonging to the α phase of PVDF. Indeed, the several Raman markers of the α phase are absent. For this reason, the appearance of a strong line at 805 cm−1 cannot be taken as a crystallinity marker, even if a maker of the α phase of PVDF has nearly the same frequency.
In the case of fibres, we find a peculiar behaviour at 132 °C, a temperature slightly above Tc: in this case, the crystallinity bands of the β form weaken, but are still clearly recognizable. In particular, the strong peak of the β phase at 840 cm−1 dominates the spectrum. Indeed, this spectrum can be described as due to the superposition of the spectrum of several trans-planar chains with the spectrum of domains that undergo the Curie transition, giving rise to the so-called gauche, paraelectric phase. Kobayashi56 describes a similar behaviour for copolymers with high TrFE content. This is the first time that this behaviour is observed for a given morphology, i.e., for nanofibers. Interestingly, this phenomenon is not evidenced by the temperature dependent IR spectra of the same samples. We propose a possible explanation of the different behaviours of films and fibres with temperature by considering that electrospun fibres often exhibit a core formed by fully extended chains, produced by the high elongational stress occurring during electrospinning. The formation of gauche defects at Tc could be partially hindered in bundles of fully extended chains, because of their peculiar morphology. The formation of GTG′ sequences above the Curie transition, causes a shortening of the chain segments belonging to the crystal, with a consequent decrease of the lamellar thickness. This change of the crystal shape can be easily accommodated by thin lamellae embedded in the amorphous phase, but in a long, highly oriented, fibre domain it could require additional energy supply.
The 1364 cm−1 line is still present at Tc and in the melt, so it can be confidently considered a marker of TrFE units. Other weaker features possibly associated with TrFE are buried under an increasingly strong and broad background. Interestingly, the feature at 601 cm−1 continuously grows while increasing temperature and evolves in a broad, strong band at the melting temperature.
We finally mention that the working hypothesis that the Raman intensity of trans-planar chains not well packed in the β crystal is intrinsically high, nicely explains why at Tc the fibres sample clearly shows the persistence of a fraction of chains in all-trans conformation. On the opposite, since the IR response of these chains should be rather low compared to that of chains well packed in the polar β crystals, such persistence is not observed through IR experiments above Tc, where the 841 cm−1 band practically disappears.
5. Conclusions
The study of the IR and Raman spectra of a variety of samples of a P(VDF-TrFE) copolymer (80% VDF molar content), allows for the detailed description of the changes in polymer structure and morphology based on (i) sample preparation procedure (film casting and electrospinning); (ii) heating up to melting, and (iii) annealing treatments. The analysis presented explicitly takes into account the complex structure of these materials, where different phases can coexist, resulting in a complex morphology consisting of a variable relative amount of amorphous phases made by chains showing more or less ordered conformations, and of crystalline domains (with different degree of perfection and size). The relevant achievements are the following:(1) We clearly identified IR and Raman “crystallinity” marker bands of the piezoelectric β phase through the comparison of the IR spectra of a P(VDF-TrFE) film with the spectra simulated by DFT22 and the spectra of PVDF films characterized by different β phase contents; the proposed vibrational assignment validates previous vibrational analyses.30,33,56
(2) Three strong and structured IR bands (883, 1183 and 1402 cm−1) are ascribed to the contributions from different phases in the polymer samples. We clearly show here for the first time that the effect of the relative abundance of different crystalline phases (for PVDF) and the amount of conformational disorder/amorphous phases (for PVDF and P(VDF-TrFE)) determine intensity and band shape of such bands and minor shifts of their main peaks.
(3) DFT calculations carried out in this work on suitable model molecules, unveil the spectroscopic markers of the TrFE units. They are observed in the IR (1124 cm−1, and the weak feature at 1345 cm−1) and in the Raman spectrum (1345–1364 cm−1). The observed persistence of such peaks in the vibrational spectra of the melt further validates this assignment.
(4) The availability of samples in the form of fibres mats, allowed to observe that the IR active B1 bands are remarkably stronger that in the spectra of the films. We have demonstrated that this finding is evidence of the orientation of the polymer chains along the fibre axis; moreover, it confirms that we deposited fibres mats where the fibres mostly run along the plane of the substrate.
We studied the changes of the polymer morphology with temperature, by simultaneously monitoring the IR and Raman spectra of samples in the form of films, fibres and powders. Not only this comparative analysis allows to validate previous results or to settle contradictory conclusions reached by different authors29,52 but also highlights unprecedented phenomena (points iii and iv below):
(i) The temperature dependence of the IR and Raman spectra allows identifying the bands associated with the conformational defects, which are already present in the room temperature phase.
(ii) Both the IR and the Raman spectra confirmed that the crystalline phase at Tc can be described as a disordered crystalline phase, where the polymer chains host G defects (gauche phase). Remarkably, statistically distributed GTG′ sequences, surrounded by all-trans segments are conformational defects easily hosted in the crystal because they do not modify the chain axis direction. This fact also explains why the polymer chain orientation in nanofibers is not lost after annealing at a temperature Tc < T < Tm. In such temperature conditions, we do not observe spectroscopic markers testifying a phase transition toward a crystalline phase similar to the α phase of PVDF.
(iii) Difference spectra obtained by subtraction of the spectra of annealed and pristine samples of P(VDF-TrFE) unveil the spectroscopic pattern of the crystalline β phase and that of the disordered phase, which undergoes structural rearrangement upon annealing. Interestingly, this analysis put into light the presence in P(VDF-TrFE) of “isolated” all-trans polymer segments and/or trans-planar chains packed in a structure different from that of the regular 3D crystal domains.
(iv) For the first time, we obtained experimental evidence of the occurrence of a peculiar phase in the case of nanofibers. Indeed, the thermal evolution of the Raman spectra just above Tc clearly shows the existence, presumably within the fibre core, of domains made by fully extended trans-planar chains not packed in β crystal lamellae. They do not show the conformational change expected at Tc (i.e., the transition to the disordered gauche phase), which instead is complete in the case of powder sample or films.
The body of evidence here summarized provides the framework for the interpretation of the spectral response of several piezoelectric fluorinated polymers, for their thorough structural diagnosis. A detailed description of the material structure is useful toward the development of procedures aimed at the optimization of the piezoelectric performance (e.g., copolymers formulation, sample preparation, mechanical and thermal treatments, poling). We have shown that also small variations in the vibrational spectra can be correlated to morphological changes of the sample. This is of utmost importance in the development of structure/property and process/structure relationships for this kind of polymeric materials.
Conflicts of interest
There are no conflicts to declare.References
- H. Kawai, The Piezoelectricity of Poly (vinylidene Fluoride), Jpn. J. Appl. Phys., 1969, 8, 975–976 CrossRef CAS.
- A. J. Lovinger, Ferroelectric Polymers, Science, 1983, 220, 1115 CrossRef CAS PubMed.
- K. S. Ramadan, D. Sameoto and S. Evoy, A review of piezoelectric polymers as functional materials for electromechanical transducers, Smart Mater. Struct., 2014, 23, 033001 CrossRef CAS.
- H. Kaczmarek, B. Krolikowski, E. Klimiec, M. Chylinska and D. Bajer, Advances in the Study of Piezoelectric Polymers, Russ. Chem. Rev., 2019, 88, 749–774 CrossRef CAS.
- S. Crossley, R. A. Whiter and S. Kar-Narayan, Polymer-Based Nanopiezoelectric Generators for Energy Harvesting Applications, Mater. Sci. Technol., 2014, 30, 1613–1624 CrossRef CAS.
- J. Chang, M. Dommer, C. Chang and L. Lin, Piezoelectric Nanofibers for Energy Scavenging Applications, Nano Energy, 2012, 1, 356–371 CrossRef CAS.
- J. Kim, J. H. Lee, H. Ryu, U. Khan, H. Kim, S. S. Kwak and S. W. Kim, High-Performance Piezoelectric, Pyroelectric, and Triboelectric Nanogenerators Based on P(VDF-TrFE) with Controlled Crystallinity and Dipole Alignment, Adv. Funct. Mater., 2017, 27, 1700702 CrossRef.
- Y. G. Jiang, L. L. Gong, X. H. Hu, Y. Zhao, H. W. Chen, L. Feng and D. Y. Zhang, Aligned P(VDF-TrFE) Nanofibers for Enhanced Piezoelectric Directional Strain Sensing, Polymers, 2018, 10, 12 Search PubMed.
- S. J. You, L. L. Zhang, J. Z. Gui, H. Cui and S. S. Guo, A Flexible Piezoelectric Nanogenerator Based on Aligned P(VDF-TrFE) Nanofibers, Micromachines, 2019, 10, 302 CrossRef PubMed.
- X. Chen, S. Y. Xu, N. Yao, W. H. Xu and Y. Shi, Potential Measurement from a Single Lead Ziroconate Titanate Nanofiber Using a Nanomanipulator, Appl. Phys. Lett., 2009, 94, 069902 CrossRef.
- G. Ico, A. Showalter, W. Bosze, S. C. Gott, B. S. Kim, M. P. Rao, N. V. Myung and J. Nam, Size-Dependent Piezoelectric and Mechanical Properties of Electrospun P(VDF-TrFE) Nanofibers for Enhanced Energy Harvesting, J. Mater. Chem. A, 2016, 4, 2293–2304 RSC.
- T. Soulestin, V. Ladmiral, F. D. Dos Santos and B. Ameduri, Vinylidene Fluoride- and Trifluoroethylene-containing Fluorinated Electroactive Copolymers. How does Chemistry Impact Properties?, Prog. Polym. Sci., 2017, 72, 16–60 CrossRef CAS.
- M. G. Broadhurst and G. T. Davis, Physical Basis for Piezoelectricity in PVDF, Ferroelectrics, 1984, 60, 3–13 CrossRef CAS.
- R. Hasegawa, Y. Takahashi, Y. Chatani and H. Tadokoro, Crystal Structures of Three Crystalline Forms of Poly(vinylidene fluoride), Polym. J., 1972, 3, 600–610 CrossRef CAS.
- R. Hasegawa, M. Kobayashi and H. Tadokoro, Molecular Conformation and Packing of Poly(vinylidene fluoride). Stability of Three Crystalline Forms and the Effect of High Pressure, Polym. J., 1972, 3, 591–599 CrossRef CAS.
- M. Bachmann, W. L. Gordon, S. Weinhold and J. B. Lando, The Crystal Structure of Phase IV of Poly(vinylidene fluoride), J. Appl. Phys., 1980, 51, 5095–5099 CrossRef CAS.
- Y. Takahashi, Y. Matsubara and H. Tadokoro, Crystal Structure of Form II of Poly(vinylidene fluoride), Macromolecules, 1983, 16, 1588–1592 CrossRef CAS.
- Y. Takahashi and H. Tadokoro, Crystal Structure of Form III of Poly(vinylidene fluoride), Macromolecules, 1980, 13, 1317–1318 CrossRef CAS.
- M. A. Bachmann and J. B. Lando, A Reexamination of the Crystal Structure of Phase II of Poly(vinylidene fluoride), Macromolecules, 1981, 14, 40–46 CrossRef CAS.
- S. Weinhold, M. H. Litt and J. B. Lando, The Crystal Structure of the γ Phase of Poly(vinylidene fluoride), Macromolecules, 1980, 13, 1178–1183 CrossRef CAS.
- M. Li, H. J. Wondergem, M.-J. Spijkman, K. Asadi, I. Katsouras, P. W. M. Blom and D. M. de Leeuw, Revisiting the δ-phase of Poly(vinylidene fluoride) for Solution-Processed Ferroelectric Thin Films, Nat. Mater., 2013, 12, 433–438 CrossRef CAS PubMed.
- A. Milani, C. Castiglioni and S. Radice, Joint Experimental and Computational Investigation of the Structural and Spectroscopic Properties of Poly(vinylidene fluoride) Polymorphs, J. Phys. Chem. B, 2015, 119, 4888–4897 CrossRef CAS PubMed.
- T. Furukawa, M. Date, E. Fukada, Y. Tajitsu and A. Chiba, Ferroelectric Behavior in the Copolymer of Vinylidenefluoride and Trifluoroethylene, Jpn. J. Appl. Phys., 1980, 19, L109–L112 CrossRef CAS.
- T. Furukawa, Ferroelectric Properties of Vinylidene Fluoride Copolymers, Phase Transitions, 1989, 18, 143–211 CrossRef CAS.
- V. V. Kochervinskii, Piezoelectricity in Crystallizing Ferroelectric Polymers: Poly(vinylidene fluoride) and its Copolymers (A Review), Crystallogr. Rep., 2003, 48, 649–675 CrossRef CAS.
- T. Furukawa, Structure and Functional Properties of Ferroelectric Polymers, Adv. Colloid Interface Sci., 1997, 71–72, 183–208 CrossRef CAS.
- A. J. Lovinger, Ferroelectric Transition in a Copolymer of Vinylidene Fluoride and Tetrafluoroethylene, Macromolecules, 1983, 16, 1529–1534 CrossRef CAS.
- A. J. Lovinger, G. T. Davis, T. Furukawa and M. G. Broadhurst, Crystalline Forms in a Copolymer of Vinylidene Fluoride and Trifluoroethylene (52/48 mol%), Macromolecules, 1982, 15, 323–328 CrossRef CAS.
- C. Y. Wan and C. R. Bowen, Multiscale-Structuring of Polyvinylidene fluoride for Energy Harvesting: the Impact of Molecular-, Micro- and Macro-Structure, J. Mater. Chem. A, 2017, 5, 3091–3128 RSC.
- K. J. Kim, N. M. Reynolds and S. L. Hsu, Spectroscopic Analysis of the Crystalline and Amorphous Phases in a Vinylidene Fluoride/Trifluoroethylene Copolymer, Macromolecules, 1989, 22, 4395–4401 CrossRef.
- A. Aliane, M. Benwadih, B. Bouthinon, R. Coppard, F. Domingues-Dos Santos and A. Daami, Impact of Crystallization on Ferro-, Piezo- and Pyro-Electric Characteristics in Thin Film P(VDF-TrFE), Org. Electron., 2015, 25, 92–98 CrossRef CAS.
- Z. Li, J. N. Liao, Z. T. Xi, W. W. Zhu and Z. C. Zhang, Influence of Steric Hindrance on Ferro- and Piezoelectric Performance of Poly(vinylidene fluoride)-Based Ferroelectric Polymers, Macromol. Chem. Phys., 2019, 220, 1900273 CrossRef CAS.
- K. Tashiro and M. Kobayashi, Structural Phase-Transition in Ferroelectric Fluorine Polymers - X-Ray Diffraction and Infrared Raman - Spectroscopic Study, Phase Transitions, 1989, 18, 213–246 CrossRef CAS.
- A. A. Prabu, J. S. Lee, K. J. Kim and H. S. Lee, Infrared Spectroscopic Studies on Crystallization and Curie Transition Behavior of Ultrathin Films of P(VDF/TrFE) (72/28), Vib. Spectrosc., 2006, 41, 1–13 CrossRef CAS.
- A. J. Lovinger, T. Furukawa, G. T. Davis and M. G. Broadhurst, Crystallographic Changes Characterizing the Curie Transition in Three Ferroelectric Copolymers of Vinylidene Fluoride and Trifluoroethylene: 1. As-Crystallized Samples, Polymer, 1983, 24, 1225–1232 CrossRef CAS.
- J. S. Green, B. L. Farmer and J. F. Rabolt, Effect of Thermal and Solution History on the Curie-Point of VF2-TrFE Random Copolymers, J. Appl. Phys., 1986, 60, 2690–2693 CrossRef CAS.
- M. Noyori, Y. Neo and H. Mimura, Single-Crystalline Poly(vinylidene fluoride–trifluoroethylene) Nanofiber Webs Fabricated by Electrospinning, Jpn. J. Appl. Phys., 2015, 54, 021601 CrossRef CAS.
- L. Persano, C. Dagdeviren, Y. W. Su, Y. H. Zhang, S. Girardo, D. Pisignano, Y. G. Huang and J. A. Rogers, High Performance Piezoelectric Devices Based on Aligned Arrays of Nanofibers of Poly(vinylidenefluoride-co-trifluoroethylene), Nat. Commun., 2013, 4, 1633 CrossRef PubMed.
- D. Mandal, S. Yoon and K. J. Kim, Origin of Piezoelectricity in an Electrospun Poly(vinylidene fluoride-trifluoroethylene) Nanofiber Web-Based Nanogenerator and Nano-Pressure Sensor, Macromol. Rapid Commun., 2011, 32, 831–837 CrossRef CAS PubMed.
- M. Kobayashi, K. Tashiro and H. Tadokoro, Molecular Vibrations of Three Crystal Forms of Poly(vinylidene fluoride), Macromolecules, 1975, 8, 158–171 CrossRef CAS.
- G. Cortili and G. Zerbi, Chain Conformations of Polyvinylidene Fluoride as Derived from its Vibrational Spectrum, Spectrochim. Acta, Part A, 1967, 23, 285–299 CrossRef.
- S. Enomoto, Y. Kawai and M. Sugita, Infrared Spectrum of Poly(vinylidene fluoride), J. Polym. Sci., Part A-2, 1968, 6, 861–869 CrossRef CAS.
- M. Benz and W. B. Euler, Determination of the Crystalline Phases of Poly(vinylidene fluoride) Under Different Preparation Conditions Using Differential Scanning Calorimetry and Infrared Spectroscopy, J. Appl. Polym. Sci., 2003, 89, 1093–1100 CrossRef CAS.
- A. Salimi and A. A. Yousefi, Analysis Method: FTIR Studies of β-phase Crystal Formation in Stretched PVDF Films, Polym. Test., 2003, 22, 699–704 CrossRef CAS.
- M. A. Bachmann, W. L. Gordon, J. L. Koenig and J. B. Lando, An infrared study of phase-III poly(vinylidene fluoride), J. Appl. Phys., 1979, 50, 6106–6112 CrossRef CAS.
- M. A. Bachmann and J. L. Koenig, Vibrational Analysis of Phase III of Poly (vinylidene fluoride), J. Chem. Phys., 1981, 74, 5896–5910 CrossRef CAS.
- K. Tashiro, M. Kobayashi and H. Tadokoro, Vibrational Spectra and Disorder-Order Transition of Poly(vinylidene fluoride) Form III, Macromolecules, 1981, 14, 1757–1764 CrossRef CAS.
- S. M. Nakhmanson, R. Korlacki, J. T. Johnston, S. Ducharme, Z. Ge and J. M. Takacs, Vibrational Properties of Ferroelectric β - Vinylidene fluoride Polymers and Oligomers, Phys. Rev. B: Condens. Matter Mater. Phys., 2010, 81, 174120 CrossRef.
- N. M. Reynolds, K. J. Kim, C. Chang and S. L. Hsu, Spectroscopic Analysis of the Electric-Field Induced Structural-Changes in Vinylidene Fluoride Trifluoroethylene Copolymers, Macromolecules, 1989, 22, 1092–1100 CrossRef CAS.
- K. J. Kim and S. L. Hsu, An Infrared Spectroscopic Study of Structural Reorganization of Uniaxially Drawn VDF TrFE Copolymer in an Electric Field, Polymer, 1994, 35, 3612–3618 CrossRef CAS.
- G. Borionetti, G. Zannoni and G. Zerbi, Lattice Dynamics and Vibrational Spectra of Conformationally Disordered Polymers: Poly(vinylidene fluoride), J. Mol. Struct., 1990, 224, 425–444 CrossRef CAS.
- M. Baniasadi, Z. Xu, S. Hong, M. Naraghi and M. M. Jolandan, Thermo-Electromechanical Behavior of Piezoelectric Nanofibers, ACS Appl. Mater. Interfaces, 2016, 8, 2540–2551 CrossRef CAS PubMed.
- M. Baniasadi, Z. Xu, S. Moreno, S. Daryadel, J. Z. Cai, M. Naraghi and M. Minary-Jolandan, Effect of Thermomechanical Post-Processing on Chain Orientation and Crystallinity of Electrospun P(VDF-TrFE) Nanofibers, Polymer, 2017, 118, 223–235 CrossRef CAS.
- K. Tashiro, K. Takano, M. Kobayashi, Y. Chatani and H. Tadokoro, Structural Study on Ferroelectric Phase Transition of Vinylidene fluoride-trifluoroethylene Copolymers (III) Dependence of Transitional Behavior on VDF Molar Content, Ferroelectrics, 1984, 57, 297–326 CrossRef CAS.
- J. S. Green, J. P. Rabe and J. F. Rabolt, Studies of Chain Conformation Above the Curie Point in a Vinylidene fluoride/trifluoroethylene Random Copolymer, Macromolecules, 1986, 19, 1725–1728 CrossRef CAS.
- K. Tashiro and M. Kobayashi, Vibrational Spectroscopic Study of the Ferroelectric Phase Transition in Vinylidene Fluoride-Trifluoroethylene Copolymers: 1. Temperature Dependence of the Raman Spectra, Polymer, 1988, 29, 426–436 CrossRef CAS.
- N. J. Ramer, T. Marrone and K. A. Stiso, Structure and Vibrational Frequency Determination for α-Poly(vinylidene fluoride) Using Density-Functional Theory, Polymer, 2006, 47, 7160–7165 CrossRef CAS.
- N. J. Ramer, C. M. Raynor and K. A. Stiso, Vibrational Frequency and LO–TO Splitting Determination for Planar–zigzag β-Poly(vinylidene fluoride) Using Density-Functional Theory, Polymer, 2006, 47, 424–428 CrossRef CAS.
- R. Dovesi, R. Orlando, A. Erba, C. M. Zicovich-Wilson, B. Civalleri, S. Casassa, L. Maschio, M. Ferrabone, M. De La Pierre, P. D'Arco, Y. Noël, M. Causà, M. Rérat and B. Kirtman, CRYSTAL14: a program for the ab initio investigation of crystalline solids, Int. J. Quantum Chem., 2014, 114, 1287–1317 CrossRef CAS.
- M. J. Frisch, G. W. Trucks, H. B. Schlegel, G. E. Scuseria, M. A. Robb, J. R. Cheeseman, G. Scalmani, V. Barone, G. A. Petersson, H. Nakatsuji, X. Li, M. Caricato, A. Marenich, J. Bloino, B. G. Janesko, R. Gomperts, B. Mennucci, H. P. Hratchian, J. V. Ortiz, A. F. Izmaylov, J. L. Sonnenberg, D. Williams-Young, F. Ding, F. Lipparini, F. Egidi, J. Goings, B. Peng, A. Petrone, T. Henderson, D. Ranasinghe, V. G. Zakrzewski, J. Gao, N. Rega, G. Zheng, W. Liang, M. Hada, M. Ehara, K. Toyota, R. Fukuda, J. Hasegawa, M. Ishida, T. Nakajima, Y. Honda, O. Kitao, H. Nakai, T. Vreven, K. Throssell, J. A. Montgomery Jr, J. E. Peralta, F. Ogliaro, M. Bearpark, J. J. Heyd, E. Brothers, K. N. Kudin, V. N. Staroverov, T. Keith, R. Kobayashi, J. Normand, K. Raghavachari, A. Rendell, J. C. Burant, S. S. Iyengar, J. Tomasi, M. Cossi, J. M. Millam, M. Klene, C. Adamo, R. Cammi, J. W. Ochterski, R. L. Martin, K. Morokuma, O. Farkas, J. B. Foresman and D. J. Fox, Gaussian 09 (Revision D.01), 2016 Search PubMed.
- G. Serra, Master thesis, Materials Engineering and Nanotechnology, Politecnico di Milano, 2020.
- Y. Abe and K. Tashiro, Computer Simulation of Structure and Ferroelectric Phase Transition of Vinylidene fluoride Copolymers: Part 3. The Motion of Molecular Chains in the Ferroelectric Phase Transition, Polymer, 2001, 42, 3409–3417 CrossRef CAS.
- A. Müller and W. H. Bragg, An X-ray Investigation of Normal Paraffins Near Their Melting Points, Proc. R. Soc. London, Ser. A, 1932, 138, 514–530 Search PubMed.
- G. Zerbi, R. Magni, M. Gussoni, K. H. Moritz, A. Bigotto and S. Dirlikov, Molecular Mechanics for Phase Transition and Melting of n-alkanes: A Spectroscopic Study of Molecular Mobility of Solid n-nonadecane, J. Chem. Phys., 1981, 75, 3175–3194 CrossRef CAS.
- F. Mokhtari, M. Latifi and M. Shamshirsaz, Electrospinning/Electrospray of Polyvinylidene Fluoride (PVDF): Piezoelectric Nanofibers, J. Text. Inst., 2016, 107, 1037–1055 CAS.
- W. A. Yee, M. Kotaki, Y. Liu and X. H. Lu, Morphology, Polymorphism Behavior and Molecular Orientation of Electrospun Poly(Vinylidene Fluoride) Fibers, Polymer, 2007, 48, 512–521 CrossRef CAS.
- E. S. Cozza, O. Monticelli, E. Marsano and P. Cebe, On the Electrospinning of PVDF: Influence of the Experimental Conditions on the Nanofiber Properties, Polym. Int., 2013, 62, 41–48 CrossRef CAS.
- C. Ribeiro, V. Sencadas, J. L. G. Ribelles and S. Lanceros-Mendez, Influence of Processing Conditions on Polymorphism and Nanofiber Morphology of Electroactive Poly(vinylidene fluoride) Electrospun Membranes, Soft Mater., 2010, 8, 274–287 CrossRef CAS.
- J. F. Zheng, A. H. He, J. X. Li and C. C. Han, Polymorphism Control of Poly(Vinylidene Fluoride) Through Electrospinning, Macromol. Rapid Commun., 2007, 28, 2159–2162 CrossRef CAS.
- X. Liu, S. X. Xu, X. L. Kuang, D. X. Tan and X. H. Wang, Nanoscale Investigations on Beta-Phase Orientation, Piezoelectric Response, and Polarization Direction of Electrospun PVDF Nanofibers, RSC Adv., 2016, 6, 109061–109066 RSC.
- M. M. Abolhasani, S. Azimi and H. Fashandi, Enhanced Ferroelectric Properties of Electrospun Poly(vinylidene fluoride) Nanofibers by Adjusting Processing Parameters, RSC Adv., 2015, 5, 61277–61283 RSC.
- T. P. Lei, P. Zhu, X. M. Cai, L. Yang and F. Yang, Electrospinning of PVDF Nanofibrous Membranes with Controllable Crystalline Phases, Appl. Phys. A: Mater. Sci. Process., 2015, 120, 5–10 CrossRef CAS.
- S. R. Kim, J. H. Yoo, Y. S. Cho and J. W. Park, Flexible Piezoelectric Energy Generators Based on P(VDF-TrFE) Nanofibers, Mater. Res. Express, 2019, 6, 11 Search PubMed.
- A. C. Wang, M. Hu, L. W. Zhou and X. Y. Qiang, Self-Powered Well-Aligned P(VDF-TrFE) Piezoelectric Nanofiber Nanogenerator for Modulating an Exact Electrical Stimulation and Enhancing the Proliferation of Preosteoblasts, Nanomaterials, 2019, 9, 349 CrossRef CAS PubMed.
- G. Y. Ren, F. Y. Cai, B. Z. Li, J. M. Zheng and C. Y. Xu, Flexible Pressure Sensor Based on a Poly(VDF-TrFE) Nanofiber Web, Macromol. Mater. Eng., 2013, 298, 541–546 CrossRef CAS.
- L. T. Beringer, X. Xu, W. Shih, W. H. Shih, R. Habas and C. L. Schauer, An Electrospun PVDF-TrFe Fiber Sensor Platform for Biological Applications, Sens. Actuators, A, 2015, 222, 293–300 CrossRef CAS.
- M. Baniasadi, J. Huang, Z. Xu, S. Moreno, X. Yang, J. Chang, M. A. Quevedo-Lopez, M. Naraghi and M. Minary-Jolandan, High-Performance Coils and Yarns of Polymeric Piezoelectric Nanofibers, ACS Appl. Mater. Interfaces, 2015, 7, 5358–5366 CrossRef CAS PubMed.
- X. H. Hu, X. Yan, L. L. Gong, F. F. Wang, Y. H. Xu, L. Feng, D. Y. Zhang and Y. G. Jiang, Improved Piezoelectric Sensing Performance of P(VDF-TrFE) Nanofibers by Utilizing BTO Nanoparticles and Penetrated Electrodes, ACS Appl. Mater. Interfaces, 2019, 11, 7379–7386 CrossRef CAS PubMed.
- R. Zbinden, Infrared Spectroscopy of High Polymers, Academic Press, New York, London, 1964 Search PubMed.
- Y. J. Wu, X. H. Li, Y. Y. Weng, Z. J. Hu and A. M. Jonas, Orientation of Lamellar Crystals and its Correlation with Switching Behavior in Ferroelectric P(VDF-TrFE) ultra-thin Films, Polymer, 2014, 55, 970–977 CrossRef CAS.
- K. Tashiro and M. Kobayashi, FTIR Study on Molecular Orientation and Ferroelectric Phase Transition in Vacuum-Evaporated and Solution-Cast Thin Films of Vinylidene fluoride—trifluoroethylene Copolymers: Effects of Heat Treatment and High-Voltage Poling, Spectrochim. Acta, Part A, 1994, 50, 1573–1588 CrossRef.
- F. Bargain, P. Panine, F. D. Dos Santos and S. Tence-Girault, From Solvent-Cast to Annealed and Poled Poly(VDF-co-TrFE) Films: New Insights on the Defective Ferroelectric Phase, Polymer, 2016, 105, 144–156 CrossRef CAS.
- R. I. Mahdi, W. C. Gan and W. H. A. Majid, Hot Plate Annealing at a Low Temperature of a Thin Ferroelectric P(VDF-TrFE) Film with an Improved Crystalline Structure for Sensors and Actuators, Sensors, 2014, 14, 19115–19127 CrossRef CAS PubMed.
- D. E. Logan, The non-coincidence effect in the Raman spectra of polar liquids, Chem. Phys., 1986, 103, 215–225 CrossRef CAS.
- M. Musso, H. Torii, P. Ottaviani, A. Asenbaum and M. G. Giorgini, Noncoincidence Effect of Vibrational Bands of Methanol/CCl4 Mixtures and Its Relation with Concentration-Dependent Liquid Structures, J. Phys. Chem. A, 2002, 106, 10152–10161 CrossRef CAS.
Footnotes |
| † Electronic supplementary information (ESI) available: SEM images of nanofibers and diameters distributions; DSC thermal analysis; results from DFT calculations and simulated IR and Raman spectra; discussion of the Infrared spectrum of fibres mats, based on symmetry considerations: intensity behaviour of B1 bands and molecular orientation. See DOI: 10.1039/d0ra05478j |
| ‡ In particular, several factors can in principle affect the vibrational frequency and transition dipole, namely: (i) the length of the trans-planar P(VDF-TrFE) sequences; (ii) the length of the VDF sequences spanning between TrFE defects; (iii) electrostatic inter-chain interactions in highly polar crystals, which can be modulated while approaching the surface of the crystal domain. For such reasons one can correlate the observed changes in band shapes, and the wavenumber shifts, to different material morphologies. |
| This journal is © The Royal Society of Chemistry 2020 |