 Open Access Article
Catalytic ozonation of phenylamine in water with a manganese ore
Yingming Fengab and
Xiaobing Li *a
*a
aNational Engineering Research Center of Coal Preparation and Purification, China University of Mining and Technology, No. 1 Daxue Road, Xuzhou, Jiangsu 221116, PR China. E-mail: Xiaobing.li@cumt.edu.cn; Tel: +86-516-83591117
bChina Kunlun Contracting & Engineering Corporation, Beijing 100013, PR China
First published on 1st October 2020
Abstract
Recalcitrant pollutants, which form surface complexes with surface metal sites of the catalyst, are difficult to remove by catalytic ozonation in water. Phenylamine (PA), one of the refractory pollutants, was degraded by ozone catalysis with manganese ore in this paper. And the effectiveness and the mechanism of catalytic ozonation with manganese ore for the degradation of PA in water were studied. After the BET test, the specific surface area of the raw and calcined manganese ore was 27.65 m2 g−1 and 33.49 m2 g−1, respectively. The effects of solution pH, catalyst dose and reaction time on the degradation of PA were evaluated. Results showed that the catalytic potential of calcined manganese ore was better than that of raw manganese ore and ozonation alone in the degradation of PA. It revealed that the increase of hydroxyl radicals generated on the surface of the catalyst or in the solution improved PA degradation. Oxidation of free radicals was the main mechanism of PA degradation in the catalytic ozonation process, occurring with a pseudo-first-order reaction rate at a constant of 0.0993 min−1 (CMP) under the pH of 7.20 and catalyst dose of 3 g L−1. Also, an activation energy of 20.4 kJ mol−1 for PA oxidation over CMP in the presence of O3 was estimated.
1. Introduction
In recent years, many organic pollutants with toxicity, carcinogenicity, mutagenicity and endocrine disrupting effects, have caused the severe contamination of water, and must be effectively removed from water.1 However, recalcitrant organic pollutants are relatively difficult to be removed from water with traditional water treatment processes. Some of these pollutants are even difficult to be efficiently degraded by oxidants like O3.2 O3, a strong oxidizing substance, has a low water solubility, so it reacts slowly with organic compounds in water.3 Advanced oxidation processes such as O3/H2O2, O3/UV, and O3/UV/H2O2,4,5 have been developed to improve the degradation of these pollutants with enhanced hydroxyl radical generation. Catalytic ozonation process (COP) with heterogeneous catalysts is studied to improve the degradation of the recalcitrant pollutants.6 In a heterogeneous COP, the mechanism of catalytic ozonation is as follows, (1) the O3 interacts with the reactive functional groups on the catalyst's surface and generates reactive radicals with much higher oxidation potential than O3 alone through a chain of reactions; (2) the catalyst provides a surface for the reaction of O3 with the pollutants; (3) the catalyst can adsorb the pollutants, which finally reacts with dissolved O3. The main significant concern in COP that still requires further investigation is the selection of a catalyst with both high potential for catalytic activity and low cost.7The catalysts are usually MnO2,8,9 TiO2,10,11 Al2O3,12–14 noble metals,15 and mixed metal oxides,16–21 Ce/AC,22 cobalt oxides,23 ZnO,24,25 SnO2,26 Rh/CeO2,27 NiO.28 Although some of these synthesized materials have shown considerable catalytic activity in ozonation process, their production will bring new environmental problems and may be cost-intensive. These defects limit the application of synthetic catalysts in full-scale systems. To overcome these challenges faced by COPs, a feasible option is to use natural-based materials as the ozonation catalyst.
MnO2 is the most widely studied metal oxide as a catalyst of the ozonation process. It is reported to be the most efficient in O3 decomposition in gaseous medium.29 It has been reported that MnOx have the highest catalytic ozonation activity to benzene series compared with the oxides of Fe, Co, Ni, Cu and Ag.30 Also, SiO2-supported manganese oxides have been shown to be obtained a large ratio of ozone decomposition rate to benzene oxidation rate, rather than Al2O3-, TiO2-, and ZrO2-supported catalysts.31 Manganese ore is a natural MnOx-containing mineral ore abundantly available in nature that contains Si, Al, Mg and other elements. This study investigated the capabilities of raw manganese-ore powder (RMP) and calcined manganese-ore powder (CMP) as MnOx-containing catalysts for the ozonation of toxic recalcitrant organic pollutants using phenylamine (PA).
The influence of solution pH, catalyst dose and the reaction time on the degradation of the selected toxic contaminant (phenylamine) was studied. A set of experiments were studied to investigate the degradation mechanism of PA in the COP reactor with the selected catalyst.
2. Materials and methods
2.1. Catalyst preparation
The manganese ore was collected from a local mine. The ore was first washed with distilled water (Vwater/Vcatalyst = 20) for 30 min to remove the extra debris, air-dried at room temperature for 2 days, and then powdered to 100 mesh using a grinder. This powder was then calcined in air in an oven at 750 °C for 4 h. The calcined materials were powdered to 100 mesh again. The prepared raw and calcined materials were finally used as catalysts in the ozonation experiments.2.2. Catalyst characterization
The raw and calcined powders were characterized by composition, textural properties and surface characteristics. The composition of the powders was determined by X-ray fluorescence (XRF) using an AxiosmAX instrument. The surface morphology of the prepared catalysts was examined using scanning electron microscopy (SEM) on a FEI-Quanta 200 F microscope. The functional groups on the surface of the particles were determined using Fourier transform infrared spectroscopy (FTIR) at wave numbers ranging from 4000 to 400 cm−1. The pH of point of zero charge (pHpzc) for the materials was determined according to the pH-drift procedure reported by Altenor et al.32 The specific surface area and the pore size of the powder particles were determined by the BET technique using the N2 adsorption/desorption method with a Quantachrome/QUADRASORB SI surface area analyzer, samples were firstly degassing under the condition of 350 °C and 2.1 Pa for 5 h.2.3. Single and catalytic ozonation experiments procedure and analysis
The ozonation experiments were carried out in glass gas washing bottles (inside diameter: 4.5 cm, height: 15 cm). Ozone was generated from dried oxygen with a laboratory ozone generator (RQ-1G, Ji Nan-Rui Qing). The dose of ozone was kept constant at 1.76 ± 0.1 mg O3 per min throughout all the ozonation experiments. The concentration of PA solution was also kept constant at 200 mg L−1. The initial pH of the PA solution was measured to be 7.20 without acidic/basic adjustment.For the COP experiments, 100 mL of PA solution with a given concentration was transferred into the reactor. The predetermined amount of catalyst (either raw or calcined powder) was added into the solution. The pH was regulated with 1 N NaOH or HCl to the desired level. And ozonation was initiated. The contents of the reactor were ozonated for a given time and then the suspension was centrifuged at 10![[thin space (1/6-em)]](https://www.rsc.org/images/entities/char_2009.gif) 000 × g for 5 min; the supernatant was finally analyzed for residual phenylamine by determining the absorbance at 195 nm using a UV-2550 UV-Vis spectrophotometer. To quench the reaction and drive away the residual ozone in the phenylamine solution, dried oxygen (3 L min−1) was added to the solution for 1 min at the end of the reaction. The same procedure was used for all the COP experiments except that no catalyst was added to the reactor.
000 × g for 5 min; the supernatant was finally analyzed for residual phenylamine by determining the absorbance at 195 nm using a UV-2550 UV-Vis spectrophotometer. To quench the reaction and drive away the residual ozone in the phenylamine solution, dried oxygen (3 L min−1) was added to the solution for 1 min at the end of the reaction. The same procedure was used for all the COP experiments except that no catalyst was added to the reactor.
The phenylamine degradation was evaluated from the difference in sample absorbance before and after the reaction divided by the initial absorbance. The chemical oxygen demanding (COD) concentration in the samples before and after the reaction were determined and could be calculated by the percentage of the COD reduction relative to the initial value. All the tests were conducted at room temperature (25 ± 3 °C) except the influence of thermal-treatment for COP with CMP. The pH was measured using a specific electrode (Shanghai Zhiguang pH meter model pHs-3CT). The concentration of ozone in the inlet-gas and off-gas streams were determined by indigo method.33 The rate of ozone decomposition in the ozonation reactor in the absence and presence of the catalyst (as needed) was determined from mass balance analysis between the inlet ozone and off-gas ozone. The fraction of ozone decomposed was calculated from the ratio of the dose of decomposed ozone to inlet ozone.
3. Results and discussion
3.1. Characteristics of the catalyst
The chemical composition, surface morphology, pore volume, size and specific surface area, and surface chemistry of the RMP, used (for the fifth-time) RMP, fresh CMP, and used (for the fifth-time) CMP materials were determined using XRF, SEM, BET, and FTIR techniques. The results are presented and discussed as below.Table 1 gives the chemical analysis of the fresh RMP, used RMP, fresh CMP, and used CMP by the XRF method. It shows that MnO, Fe2O3, SiO2, and Al2O3 compounds are the main components of the selected samples, nearly 80–95%. The proportion of other compounds such as BaO, MgO, Na2O, K2O, CaO and NiO is low (about 2%). The amount of SiO2 is greater in CMP than in RMP, implying that the CMP is more stable than the RMP. Table 1 indicates that the composition of the used CMP is not much different from the fresh one, while the amount of SiO2 in the RMP decreased obviously, suggesting that the CMP is more suitable to be catalyst than the RMP. Most of these metal oxides including in the manganese ore have been shown to have significant catalytic potential in the ozonation of various organics.30 To sum up, the selected manganese ore, which is abundant on Earth may be a promising catalyst for ozonation processes (Table 2).
| Compound | Fresh RMP (%) | Used RMP (%) | Fresh CMP (%) | Used CMP (%) |
|---|---|---|---|---|
| a Loss of ignition. | ||||
| MnO | 17.750 | 20.477 | 14.929 | 14.753 |
| Fe2O3 | 10.136 | 11.579 | 8.892 | 8.798 |
| Al2O3 | 3.961 | 3.224 | 4.955 | 4.688 |
| SiO2 | 48.807 | 32.533 | 65.342 | 60.851 |
| MgO | 0.082 | 0.071 | 0.099 | 0.092 |
| NiO | 0.099 | 0.114 | 0.090 | 0.095 |
| BaO | 0.433 | 0.625 | 0.316 | 0.328 |
| CaO | 0.125 | 0.093 | 0.134 | 0.138 |
| Na2O | 0.345 | 0.570 | 0.269 | 0.307 |
| K2O | 0.255 | 0.277 | 0.338 | 0.306 |
| P2O5 | 0.178 | 0.167 | 0.203 | 0.171 |
| Rests | 0.429 | 0.470 | 0.433 | 0.371 |
| LOIa | 17.400 | 29.800 | 4.000 | 9.100 |
| Material | Specific surface area (m2 g−1) | Total pore volume (cm3 g−1) | Pore size (nm) |
|---|---|---|---|
| RMP | 27.65 | 0.043 | 6.26 |
| CMP | 33.49 | 0.072 | 8.59 |
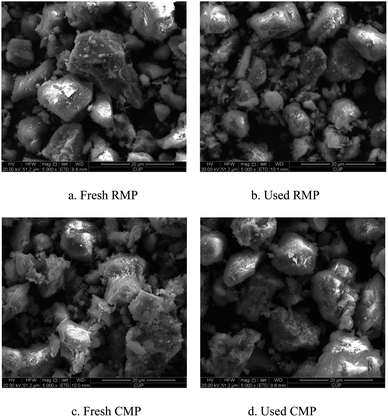
Fig. 1 shows SEM micrographs of fresh RMP (a), used RMP (b), fresh CMP (c) and used CMP (d) at the same magnification. The comparison between Fig. 1a and c reveals that high temperature (750 °C) changed the surface morphology of the catalyst, the surface of the CMP appears rougher than the RMP, which may be because the calcination destructed some compounds and generated many pores on the surface of the materials. However, the morphologies of fresh CMP and used CMP do not seem to have changed much, suggesting that CMP is a stable material that can be used as a catalyst in ozonation processes. While the morphologies of fresh RMP and used RMP shows obvious different, resulting from the strength of the fresh RMP is low and some components run off during the catalytic ozonation process, these changes are even more evident in the XRF plots (Table 3).
| COP with the CMP | |||
|---|---|---|---|
| Temperature (K) | 298.15 | 308.15 | 318.15 |
| SOP: k (min−1) | 0.0454 | 0.0633 | 0.0865 |
| COP: k (min−1) | 0.0993 | 0.1297 | 0.1667 |
| Arrhenius equation | |
|---|---|
| SOP | Ea = 25.4 kJ mol−1 |
| COP | Ea = 20.4 kJ mol−1 |
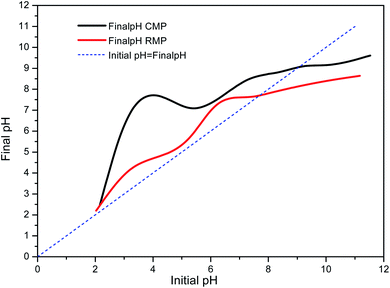
The pH of point of zero charge (pHpzc) of the RMP and CMP were tested as shown in Fig. 2. The pHpzc for the RMP and CMP were determined to be 7.45 and 9.06, respectively. The surface of catalysts is positively charged at solution pHs below pHpzc, oppositely, negatively charged at solution pHs above pHpzc.38 The higher pHpzc of the CMP is likely because calcination converted some components in the raw material into metal oxides40 (shown in Table 1), resulting in an alkaline character to the surface of the material. The pHpzc values suggest that CMP would likely have higher catalytic potential than RMP.
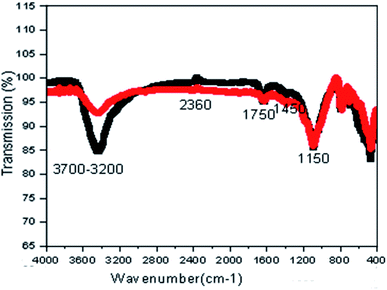
Fig. 3 shows the FTIR spectra of the prepared catalysts, indicating several intense peaks and revealing the presence of a number of important functional groups on the surface of the catalysts. As shown in Fig. 3, the FTIR spectra of fresh CMP and used CMP almost overlap, revealing that CMP is a stable material which can be frequently reused in the COP. A broad absorption peak at wavenumbers between 3700 and 3200 cm−1 is assigned to H–O–H vibration. An intense peak with the maximum adsorption at 1150 cm−1 wavenumber is attributed to C–H stretching in functional groups. The sharp peak at 1450 cm−1 is assigned to the symmetric C–O stretching. The FTIR bands in the range of 350–800 cm−1 in Fig. 3 are assigned to the vibration modes of Fe–O, Si–O and Mn–O bonds represented Fe2O3, SiO2 and MnO.
The specific surface area of the selected catalysts (RMP and CMP) was determined from the N2 adsorption/desorption BET isotherm with values of 27.65 m2 g−1 and 33.49 m2 g−1, respectively. The total pore volume of the RMP and CMP were found to be 0.043 cm3 g−1 and 0.072 cm3 g−1, respectively. The average pore size of RMP and CMP were 6.26 nm and 8.59 nm, respectively. These results indicate that a 21.12% increase in the specific surface area of the material upon calcination, suggesting greater catalytic potential for the CMP.30 The increase of the BET surface area as well as pore volume and size of the powder upon calcination can be related to some substances in the natural ore are burned off or broken down at high temperatures.
3.2. Effectiveness in improving PA degradation
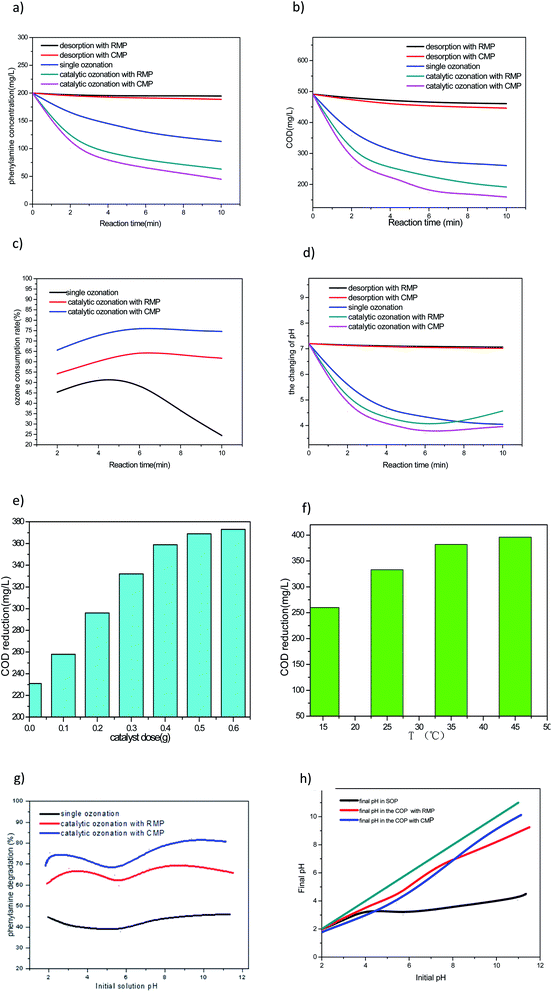
Fig. 4a shows the degradation of PA in single ozonation process (SOP), COP with CMP, COP with RMP, adsorption by CMP and adsorption by RMP. As observed in Fig. 4, the maximum removal of PA by adsorption onto the RMP was 2.7% obtained at pH = 7.20, and the maximum removal of PA by adsorption onto the CMP was 5.6% obtained at the same pH. This result implies that no matter CMP or RMP had no significant effect on the attained PA removal by adsorption, but the CMP gets the stronger potential to adsorption PA than the RMP. It is clear that the degradation of PA by SOP began to slow down after 4 min. Instantaneous ozone decomposition occurs at the initial phase of ozonation which generates a significant amount of hydroxyl radicals.34,35 The PA degradation at the initial phase of ozonation can be attributed to the generation of hydroxyl radicals. Of course, a part of PA will be oxidized in the bulk solution with dissolved molecular ozone, and this will be proved in the following test. Catalytic ozonation with CMP degrade 77.5% of PA within 10 min, the PA degradation efficiency trend is consistent with those in the COP with RMP and in the SOP, even if the latter two processes have a low degradation rate. For instance, the PA degradations at pH 7.20 under the selected conditions are 43.5%, 68.4% and 77.5% in the SOP, the COP with RMP and the COP with CMP, respectively.3.3. Effectiveness in improving COD removal
After investigating the degradation effectiveness of PA, a set of experiments was conducted to determine COD reduction at pH of 7.20 and catalyst concentration of 3 g L−1 over a reaction period of 10 min. The results in Fig. 5 show that a much higher COD removal was attained in the COP compared with in the SOP under similar experimental conditions. According to Fig. 4b, the maximum COD removal by adsorption onto the RMP was 6.21% obtained at pH = 7.20, and the maximum COD removal by adsorption onto the CMP was 9.20% obtained at the same pH. This result implies that no matter CMP or RMP had no significant effect on the attained COD removal by adsorption. Catalytic ozonation with CMP attained 67.7% COD removal within 10 min, although at a, respectively, lower rate, the same COD removal efficiency trends were observed in the COP with RMP and in the SOP. For instance, the COD removal at pH 7.20 under the selected conditions was 46.9%, 61% and 67.7% in the SOP, the COP with RMP, and the COP with CMP, respectively. In addition, the ozone consumption rate and the change of PA solution pH after reaction in the SOP, the COP with RMP, and the COP with CMP are evaluated.3.4. The ozone consumption rate at different reaction processes
Fig. 4c shows the ozone consumption rate in SOP, COP with CMP, COP with RMP. As observed in Fig. 6, CMP and RMP in COPs have the same varying tendency of ozone consumption rate, but the former attain a higher potential to deplete ozone. The maximum ozone consumption rate in the COP with CMP is 76.7% at 6 min, while the maximum ozone consumption rate in the COP with RMP is only 65.3%. According to Fig. 6, the ozone consumption rate in the SOP is quite different from the COP. For instance, the ozone consumption rate decrease sharply after 4 min, the reason is that, PA degradation can mainly be attributed to the generation of hydroxyl radicals at the initial time of the reaction, while at the following 6 min, PA is degraded by dissolved molecular ozone.34,35 However, ozone has low water solubility and low stability, so it reacts slowly with some organic compounds.36 This may be the reason why the SOP have a lower ozone consumption rate than the COP.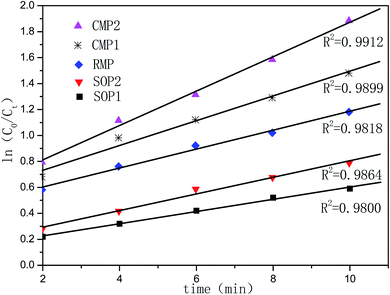 | ||
| Fig. 6 Pseudo-first-order plots of the PA (200 mg L−1) degradation reaction. (1) At 25 °C; (2) at 35 °C, pH = 7.20, catalyst: 0.3 g. | ||
3.5. Change of PA solution pH at different reaction processes
Fig. 4d shows the change of PA solution pH in SOP, COP with CMP, COP with RMP, adsorption by CMP and adsorption by RMP at different time. As observed in Fig. 7, no matter CMP or RMP both have no significant effect on the change of PA solution pH by adsorption. In the SOP experiment, the final pH of the solution is markedly reduced by the reaction at all tested time. This result suggests that PA is degraded into acidic intermediates, thereby reducing the solution pH. Accordingly, not enough hydroxyl ions have been available to initiate/continue the chain reaction formation of hydroxyl radicals.37 When the catalyst is added to the reaction, it provides a surface for ozone to react with the metal oxide, thereby generating more reactive radicals than molecular ozone and accelerating the degradation rate. So, the COP can generate more acidic intermediates than the SOP at the initial 6 min with a lower pH shown in Fig. 4d. After 6 min, the pH of COP begin to increase slower, because of the acidic intermediates were further degraded by ·OH, which is very difficult to be degraded in the SOP.3.6. Effect of CMP dose on COD removal rate
Because the CMP has strong potential in the COP of PA, this and the next experimental runs are conducted in the COP with CMP catalyst at pH 7.20. Fig. 4e shows the effect of the dose CMP on catalytic ozonation of PA with 1.76 ± 0.1 mg min−1 ozone flow rate. Fig. 8 shows that COD removal rate increases with the increase of CMP dose, and a maximum of 75.8% COD removal is obtained at 10 min oxidation time when the dose of catalyst reaches 6 g L−1, this result can be attributed to the fact that the more catalyst are added, the more active sites are available for interaction with ozone, more ·OH radicals generate by the chain reaction. However, the COD removal rate increased slower with the increase of CMP when it is over 3 g L−1, resulting from the reaction between ·OHs will happen with the increase of ·OHs. So considering the cost, the optimum dose of CMP is 3 g L−1.3.7. Effect of temperature of PA solution on COD removal rate
As observed in Fig. 4f, COD removal rate increases with the increase of temperature of PA solution, and a maximum of 80.7% COD removal is obtained at 10 min oxidation, when the temperature increased to 45 °C. Following the increasing of temperature, get more the kinetic energy of ozone molecules in the solution increases, its movement frequency increases, so the frequency of contacting with the active sites on catalyst surface increased, improving the generation of more ·OH radicals, leading to COD removal rate increases. However, at the same time, we also find that with the increase of temperature, especially above 35 °C, the COD removal rate will slow down, because the solubility of ozone in water is inversely proportional to the temperature.3.8. Mechanism of PA degradation at various solution pHs
To find the optimum operating pH, the influences of solution pH ranging from 1.82 to 11.35 on the degradation of PA are evaluated in the COP with raw and calcined manganese ore (0.3 g) as the catalyst at a reaction time of 10 min. For blank control, the degradation of PA in the SOP is also investigated under similar conditions. The percentage of PA removal is presented in Fig. 4g, revealing higher PA degradation rates in the COP with CMP than in the other two systems, but the COP with raw and calcined manganese ores have the same change tendency almostly. Under the acid solution, the PA degradation both first increase with the increase of pH, then reduce with a further increase of the pH; while under the alkaline solution, the maximum removal of PA is attained when the pH of solution was close to the pHpzc of CMP or RMP. That is the fact that ozonation can proceed via two routes: (1) direct molecular ozone reactions at acid pH mainly and (2) indirect pathway leading to ozone decomposition and the generation of hydroxyl radicals (OH˙) at alkaline mainly. The influence of pH was mainly due to the fact that OH− could induce O3 decomposition to produce ·OH. In addition, pH also determined the charge type of water solution or catalyst surface. When the pH of the solution was higher than the pHpzc of the catalyst, the catalyst surface would undergo deprotonation reaction; on the contrary, when the pH of the solution was lower than the pHpzc of the catalyst, the catalyst surface would undergo protonation reaction. In the lower pH range, the reaction was dominated by O3.38–42 According to Fig. 4g, the COP with CMP attained 69.3% degradation at an initial solution pH of 1.84. Increasing the pH to 2.07, the PA degradation efficiency reached to 75.8%, then the degradation rate reduced to 65.2% when increasing the pH to 5.42. Whereas a further increase of the pH to 9.38, which is close to its pHpzc, resulted in a corresponding increase of PA degradation to 82.4%. Although at a, respectively, lower rate, the same PA degradation efficiency trends were observed in the COP with RMP and in the SOP. For instance, the PA degradation at pH 11 under the selected conditions was 46.1%, 65.9% and 80.7% in the SOP, the COP with RMP, and the COP with CMP, respectively. The above findings indicate a high degree of catalytic activity for the CMP. The achievement of higher recalcitrant pollutants removal in the COP than the SOP has been reported in many books with other materials such as Fe(III)-AC,43 Ru-AC,44 Ni-AC45 and TiO2.46 The higher PA removal at pH 2 than that at pH 5 is related to the direct oxidation of ozone with PA, which is best performed at a more acidic pH, because at pH 2, ozone owes a higher redox potential than that at pH 5. The difference in the percentage of degradation among the selected processes can be explained by considering the influence of pH on water chemistry and on the catalyst's surface properties (i.e., pHpzc).The initial and final pHs of the PA solution (the solution pHs at the beginning and end of the reaction), are shown in Fig. 4h. The greater efficacy of COP with calcined ore than with raw ore as the catalyst can be partly attributed to composition of the material used as the catalyst. MnO2 is the predominant iron oxide in the calcined catalyst, and the catalytic potential of MnO2 is greater than MnO. Moreover, because of the higher potential to mineralize PA which can make the acidic intermediates degrade deeply and the basic character of this catalyst's surface, the pH of the solution in the COP did not drop so markedly as the SOP during the reaction and remained almost at the initial value. Therefore, with this higher solution pH, more hydroxide ions are available on the surface of the catalyst.47 As the hydroxide ions act as an initiator for the ozone decomposition, a greater amount of ·OH generate when more hydroxide ions are present, which in turn promoted PA degradation. The ozone consumed in the COP was likely decomposed into more reactive species at Lewis sites of the metal oxides,48 particularly MnO, MnO2, Al2O3, Fe2O3, BaO, SiO2, MgO, Na2O, K2O and CaO (Table 1). This subsequently results in the generation of radical species, in particular ·OH,49,50 which are considerably more reactive than molecular ozone. To confirm the above conclusion, the mass ratio of PA degraded to the total ozone consumed (as mg PA per mg O3) was calculated, the initial PA concentration (100 mg PA per L), removal percentage (43.5% in SOP and 77.5% in COP with the CMP) together with the total ozone dose, were also be considered. This method is different from which Gholamreza Moussavi et al.7 put forward. The results show that the mass ratio of PA degraded to the total ozone dose (as mg PA per mg O3) was 4.9 and 8.8 in the SOP and COP with the CMP, respectively. This result further confirms that the ozone consumed in the COP was decomposed on the surface of the catalyst into more reactive species. Our findings are in accordance with the related literature. For instance, Ikhlaq, et al.51 reported that adding alumina and zeolites in water as a catalyst increased ozone consumption efficiency.
3.9. Influence of hydroxyl radical scavenger
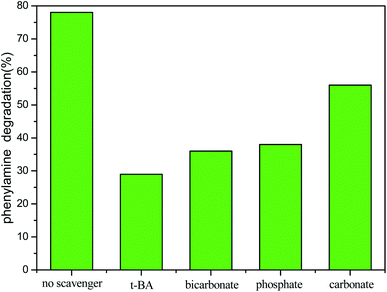
Since PA adsorption on the manganese ore was very weak and the direct ozone oxidation of PA is quite slow, the enhanced PA degradation by the catalytic ozonation is possibly ascribed to accelerated the generation of hydroxyl radicals from ozone. To determine the mechanism by which the PA was degraded in the developed COP, several PA degradation tests were run in the COP in the presence of 1 g L−1 of various radical inhibitors and scavengers including phosphate, carbonate, bicarbonate and tert-butanol. The experiments were conducted with 200 mg PA per L at an optimum initial pH 9, 0.3 g CMP, and a reaction time of 10 min. The PA degradation efficiency of the COP in the presence of the selected radical inhibitors and scavengers is presented in Fig. 5. As observed in Fig. 5, the effect with which the degradation of PA in COP in the absence of radical scavengers was 82.4% under the selected conditions. When bicarbonate, tert-butanol, carbonate or phosphate was added to the PA solution, the degradation of PA dropped drastically to 35.4%, 28.7%, 56.2% or 37.6%, respectively. The reduced degradation rates in the presence of phosphate, carbonate or bicarbonate can be explained by the fact that these ions have a high affinity for the Lewis sites on the surface of the catalyst48,52 and thus impair and deactivate the catalyst's active sites thereby inhibiting the catalytic decomposition of ozone on catalyst surface. In addition, bicarbonate may also scavenge the hydroxyl radicals from the surface of the catalyst produced by the COP process. The tert-butanol (TBA) is different from these three ions. The tert-butanol is characterized by its reaction with hydroxyl radicals53 mainly in bulk, generating inert intermediates and consequently quenching ozone decomposition in water. Therefore, the significant potential of CMP to catalyze the ozonation of the PA and recalcitrant compounds is confirmed, that oxidation via radical species (in particular ·OH) on the surface of the catalyst and in bulk solution was the main mechanism of PA degradation in the developed COP. Additionally, a minor level of PA likely took place through oxidation in the bulk solution by molecular ozone. Another point illustrated by Fig. 5 is that the degradation rate of PA can be reduced to below 20% by adding any other radical scavengers to the reactor. This conclusion is not consistent with the view by Gholamreza Moussavi et al.7 it can be related to the deference in the composition of the catalyst materials.3.10. Kinetics of PA degradation in the COP with CMP
Considering the reaction of ozonation with CMP, PA conversion activity is higher than that with RMP. We only conducted the kinetic study over CMP catalyzes ozonation. As shown in the Fig. 6, the data for PA removal at various reaction times at each temperature in different reaction processes (SOP and COP) was fitted with the pseudo-first-order (PFO) reaction rate model. This study also investigates the activation energies of PA oxidation in the SOP or in the COP with CMP. The relationship between the reaction rate constant and temperature is expressed by the Arrhenius equation54,55
 | (1) |
The rate of PA oxidation achieved with CMP and ozone is described by
 | (2) |
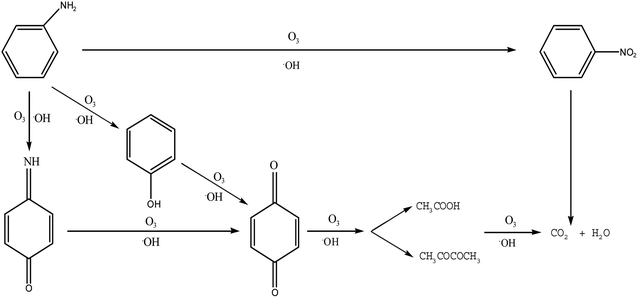
In order to understand the oxidation pathways during PA ozonation, the intermediates and by-products of PA were test by GC-MS. The parameters of gas chromatography-mass spectrometry were set as follows: inlet temperature 280 °C, EI ion source temperature 230 °C, and quadrupole rod temperature 150 °C. Carrier gas of high purity helium (purity > 99.999%), without fractional injection of 1.0 L. The heating procedure was as follows: the initial temperature was 80 °C, maintained for 2 min, the speed of 10 °C min−1 rose to 320 °C, and maintained for 6 min. Full scanning mode was adopted for mass spectrometry detection, with the detection range of 50–550 (m/z). By analysis of the degradation products of the intermediates and by-products of PA oxidation, it can be concluded the following degradation pathways.
3.11. Stability experiment of CMP catalyst in sequential reaction
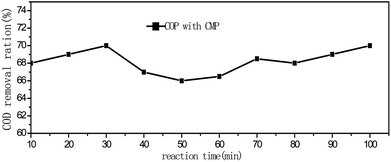
To explore the stability of CMP catalyst, the test was performed in the 200 mg L−1 PA solution under the sequential reaction conditions (3 g L−1 catalyst, 10 min oxidation retention time, 1.76 ± 0.1 mg min−1 ozone flow rate). The test lasted 100 min. The results are shown in Fig. 8. It revealed that the COD removal rate was maintained at a near constant level after 80 min of continuous reaction, which suggests that the catalytic capacity of CMP catalyst did not decreasing rapidly with time under such conditions. As shown in Fig. 8, the morphology of the new CMP and the spent one did not differ significantly after 100 min sequential reaction in the catalytic ozonation of PA, demonstrated that the CMP catalyst is effective and stable in the ozonation of PA.4. Conclusion
The catalytic ozonation of recalcitrant PA wastewater by RMP and CMP was evaluated. The CMP had greater catalytic potential under alkaline conditions. The phenylamine was degraded by pseudo-first-order heterogeneous reactions with ·OH on the surface of the catalyst and in the solution. The COP with manganese ore catalyst in this study achieved a high effectiveness of PA degradation. Accordingly, the overall conclusion from this work is that the CMP is a very active catalyst, better than the RMP, resulting from its metal oxide composition, larger specific surface area (33.49 m2 g−1) and higher pHpzc. It is a promising catalyst for the ozonation of recalcitrant environmental contaminants.Conflicts of interest
There are no conflicts to declare.Acknowledgements
The authors are grateful to the Opened-end Fund of National Engineering Research Center of Coal Preparation and Purification (No. 2018NERCCPP-B07), Jiangsu Province Key Research and Development Project (BE2018635) and Six Talents Peaks Project in Jiangsu Province (JNHB-077).References
- L. F. Liotta, M. Gruttadauria, G. DiCarlo, G. Perrini and V. Librandod, J. Hazard. Mater., 2009, 162, 588–608 CrossRef CAS.
- U. V. Gunten, Water Res., 2003, 37, 1443–1467 CrossRef.
- B. Kasprzyk-Hordern, M. Ziólek and J. Nawrocki, Appl. Catal., B, 2003, 46, 639–669 CrossRef CAS.
- K. H. Aziz, Chemosphere, 2019, 228, 377–383 CrossRef.
- K. H. Aziz, H. Miessner, S. Mueller, A. Mahyar and D. Kalass, J. Hazard. Mater., 2018, 343, 107–115 CrossRef.
- T. Zhang and J. Ma, J. Mol. Catal. A: Chem., 2008, 279, 82–89 CrossRef CAS.
- G. Moussavi, R. Khosravi and N. R. Omran, Appl. Catal., A, 2012, 445–446, 42–49 CrossRef CAS.
- J. Ma and N. J. D. Graham, Water Res., 2000, 34, 3822–3828 CrossRef CAS.
- J. Ma, M. H. Sui, T. Zhang, C. Y. Guan and X. Bao, Water Res., 2005, 39, 779–786 CrossRef CAS.
- R. Gracia, S. Cortes, J. Sarasa, P. Ormad and J. L. Ovelleiro, Water Res., 2000, 34, 1525–1532 CrossRef CAS.
- F. J. Beltrán, F. J. Rivas and R. Montero-de-Espinosa, Appl. Catal., B, 2002, 39, 221–231 CrossRef.
- C. N. Ni and J. N. Chen, Water Sci. Technol., 2001, 43, 213–220 CrossRef CAS.
- M. Ernst, F. Lurot and J. C. Schrotter, Appl. Catal., B, 2004, 47, 15–25 CrossRef CAS.
- B. Kasprzyk-Hordern, U. Raczyk-Stanisławiak, J. Swietlik and J. Nawrocki, Appl. Catal., B, 2006, 62, 345–358 CrossRef CAS.
- F. Delanoë, B. Acedo, N. Karpel Vel Leitner and B. Legube, Appl. Catal., B, 2001, 29, 315–325 CrossRef.
- C. Cooper and R. Burch, Water Res., 1999, 33, 3695–3700 CrossRef CAS.
- Y. Z. Pi, M. Ernst and J. C. Schrotter, Ozone: Sci. Eng., 2003, 25, 393–397 CrossRef CAS.
- C. B. Udrea, Ozone: Sci. Eng., 2003, 25, 335–343 CrossRef.
- F. J. Beltrán, F. J. Rivas and R. Montero-de-Espinosa, Appl. Catal., B, 2004, 47, 101–109 CrossRef.
- F. J. Beltrán, F. J. Rivas and R. Montero-de-Espinosa, Water Res., 2005, 39, 3553–3564 CrossRef.
- F. J. Rivas, M. Carbajo, F. J. Beltrán, B. Acedo and O. Gimeno, Appl. Catal., B, 2006, 62, 93–103 CrossRef CAS.
- L. S. Li, W. Y. Ye and Q. Y. Zhang, J. Hazard. Mater., 2009, 170, 411–416 CrossRef CAS.
- P. C. C. Faria, D. C. M. Monteiro, J. J. M. Orfao and M. F. R. Pereira, Chemosphere, 2009, 74, 818–824 CrossRef CAS.
- H. Y. Jung and H. C. Choi, Appl. Catal., B, 2006, 66, 288–294 CrossRef CAS.
- M. Muruganandham and J. J. Wu, Appl. Catal., B, 2008, 80, 32–41 CrossRef CAS.
- Y. F. Zeng, Z. L. Liu and Z. Z. Qin, J. Hazard. Mater., 2009, 162, 682–687 CrossRef CAS.
- M. Carbajo, F. J. Rivas, F. J. Beltran, P. Alvares and F. Medina, Ozone: Sci. Eng., 2006, 28, 229–235 CrossRef CAS.
- S. M. Avramescu, C. Bradu, I. Udrea, N. Mihalache and F. Ruta, Catal. Lett., 2008, 9, 2386–2391 CAS.
- S. T. Oyama, Catal. Rev.: Sci. Eng., 2000, 42, 279–322 CrossRef CAS.
- H. Einaga and S. Futamura, J. Catal., 2004, 227(2), 304–312 CrossRef CAS.
- H. Einaga and A. Ogata, J. Hazard. Mater., 2009, 164, 1236–1241 CrossRef CAS.
- S. Altenor, B. Carene, E. Emmanuel, J. Lambert, J. J. Ehrhardt and S. Gaspard, J. Hazard. Mater., 2009, 165, 1029–1039 CrossRef CAS.
- H. Bader and J. Hoigne, Water Res., 1981, 15, 449–456 CrossRef CAS.
- J. Hoigné and J. Bader, Ozone: Sci. Eng., 1994, 16, 121–134 CrossRef.
- H. S. Park, T. M. Hwang, J. W. Kang, H. C. Choi and H. J. Oh, Water Res., 2001, 35, 2607–2614 CrossRef CAS.
- B. Kasprzyk-Hordern, M. Ziólek and J. Nawrocki, Appl. Catal., B, 2003, 46, 639–669 CrossRef CAS.
- J. Ma, M. H. Sui, T. Zhang and C. Y. Guan, Water Res., 2005, 39, 779–786 CrossRef CAS.
- A. L. Kowal and M. Swiderska-Broz, Oczyszczaniewody, Wydawnictwo Naukowe, PWN, Warszawa, 2007 Search PubMed.
- B. Langlais, D. A. Reckhow and D. R. Brink, Ozone in Water Treatment: Application and Engineering, Lewis Publishers, 1991 Search PubMed.
- Water Treatment Handbook, Degremont, Rueil-Malmaison Cedex, France, 2007 Search PubMed.
- R. D. Letterman, Water Quality and Treatment: A Handbook of Community Water Supplies, American Water Works Association/McGraw-Hill, Inc., 5th edn, 1999 Search PubMed.
- J. Nawrocki and S. Bilozor, Uzdatnianie wody. Procesy chemiczne i biologiczne,PWN, Poznan-Warszawa, 2000 Search PubMed.
- W. C. Ling, Z. M. Qiang, Y. W. Shi, T. Zhang and B. Z. Dong, J. Mol. Catal. A: Chem., 2010, 342–343, 23–29 Search PubMed.
- J. B. Wang, Y. R. Zhou, W. P. Zhu and X. W. He, J. Hazard. Mater., 2009, 166, 502–507 CrossRef CAS.
- X. K. Li, Q. Y. Zhang, L. L. Tang, P. Lu, F. Q. Sun and L. S. Li, J. Hazard. Mater., 2009, 163, 115–120 CrossRef CAS.
- C. F. Hsu, H. W. Chen and Y. Y. Wu, Sep. Purif. Technol., 2013, 103, 101–108 CrossRef CAS.
- R. C. Martins and R. M. Quinta-Ferreira, Appl. Catal., B, 2009, 90, 268–277 CrossRef CAS.
- J. Nawrocki and B. Kasprzyk-Hordern, Appl. Catal., B, 2010, 99, 27–42 CrossRef CAS.
- L. C. Lei, L. Gu, X. W. Zhang and Y. L. Su, Appl. Catal., A, 2007, 327, 287–294 CrossRef CAS.
- G. Moussavi and M. Mahmoud, Chem. Eng. J., 2009, 152, 1–7 CrossRef CAS.
- A. Ikhlaq, D. R. Browna and B. Kasprzyk-Hordernc, Appl. Catal., B, 2013, 129, 437–449 CrossRef CAS.
- L. Zhang, C. Hu, Y. L. Nie and J. H. Qu, Appl. Catal., B, 2010, 100, 62–67 CrossRef.
- G. V. Buxton, C. L. Greenstock, W. P. Helman and W. P. Ross, J. Phys. Chem. Ref. Data, 1988, 17, 513–886 CrossRef CAS.
- K. Everaert and J. Baeyens, J. Hazard. Mater., 2004, 109, 113–139 CrossRef CAS.
- C. C. Yang, S. H. Chang, B. Z. Hong, K. H. Chi and M. B. Chang, Chemosphere, 2008, 73, 890–895 CrossRef CAS.
| This journal is © The Royal Society of Chemistry 2020 |

