 Open Access Article
Hydrogen storage behavior of nanocrystalline and amorphous Mg–Ni–Cu–La alloys
Zhonghui Houab,
Wei Zhang *a,
Xin Weia,
Zeming Yuanb and
Qilu Gea
aDepartment of Functional Material Research, Central Iron and Steel Research Institute, Beijing 100081, China. E-mail: zhangwei94264@126.com
bKey Laboratory of Integrated Exploitation of Baiyun Obo Multi-Metal Resources, Inner Mongolia University of Science and Technology, Baotou 014010, China
First published on 8th September 2020
Abstract
Alloying and structural modification are two effective ways to enhance the hydrogen storage kinetics and decrease the thermal stability of Mg and Mg-based alloys. In order to enhance the characteristics of Mg2Ni-type alloys, Cu and La were added to an Mg2Ni-type alloy, and the sample alloys (Mg24Ni10Cu2)100−xLax (x = 0, 5, 10, 15, 20) were prepared by melt spinning. The influences of La content and spinning rate on the gaseous and electrochemical hydrogen storage properties of the sample alloys were explored in detail. The structural identification carried out by XRD and TEM indicates that the main phase of the alloys is Mg2Ni and the addition of La results in the formation of the secondary phases LaMg3 and La2Mg17. The as-spun alloys have amorphous and nanocrystalline structures, and the addition of La promotes glass formation. The electrochemical properties examined by an automatic galvanostatic system show that the samples possess a good activation capability and achieve their maximal discharge capacities within three cycles. The discharge potential characteristics were vastly ameliorated by melt spinning and La addition. The discharge capacities of the samples achieve their maximal values as the La content changes, and the discharge capacities always increase with increasing spinning rate. The addition of La leads to a decline in hydrogen absorption capacity, but it can effectively enhance the rate of hydrogen absorption. The addition of La and melt spinning significantly increase the hydrogen desorption rate due to the reduced activation energy.
Introduction
Hydrogen is considered to be one of the main contenders as a candidate for modern fuels.1–3 One of the largest advantages of hydrogen is that clean energy is obtained when it is burnt in air, which has been noticed all over the world in recent decades. Moreover, the amount of hydrogen available is very large and it remains available for an infinite period. As a globally accepted clean fuel, hydrogen can be used in various applications, such as jet planes, generating electricity, hydrogen-powered industries, vehicle fuel, cooking food and most other inland energy requirements. Using hydrogen as fuel in vehicles has been investigated extensively, which is very hopeful for eliminating the environmental problems resulting from fossil fuel consumption.4–6 How to prepare a practically usable hydrogen storage system is a key technical issue for the application of hydrogen fuel in a vehicle.7–10 Among all hydrogen storage materials, metal hydride hydrogen storage systems are thought to be preferential choices for meeting the requirements of mobile facilities.11 The application goal has been achieved by some reported hydrogen storage materials. What is more, some AB2-type and other alloys appear regularly in daily life. Unfortunately, for automotive applications, there is no material that can achieve all the performance demands set out by the U.S. Department of Energy.12 Among the potential hydrogen storage materials, Mg2Ni-type metallic hydrides are used in automobiles powered by Ni–MH batteries or hydrogen fuel cells,13 because of their merits, like the high theoretical gaseous hydrogenation capacity and electrochemical capacity of Mg2NiH4.14,15 Although Mg-based alloys have many intrinsic defects that restrict their practical application, including poor electrochemical cycle stability, low hydrogen absorption/desorption kinetics and high dehydrogenation temperature,16 they are still considered to be an option for increasing hydrogen storage capabilities. Two approaches of alloying and microstructure modification are usually used to improve the hydrogen storage capability of alloys.17,18 Specifically, for Mg-based alloys, replacing some Mg with transition and/or rare earth elements will decrease the hydride stability and facilitate hydrogen desorption.19,20 Moreover, the hydrogenation and dehydrogenation dynamics of Mg-based alloys can be improved by diminishing the grain size, especially to smaller than micron scale.21,22 Nanocrystalline and amorphous alloys in which the elements are homogeneously distributed can be synthesized in many ways including melt spinning and mechanical milling.23,24 Huang et al.25 prepared an amorphous and nanocrystalline (Mg60Ni25)90Nd10 alloy by melt-spinning which achieved a maximum discharge capacity of 580 mA h g−1. Spassov et al.19 reported that for the melt-spun nanocrystalline/amorphous Mg75Ni20Mm5 alloy (Mm = Ce, La-rich mischmetal), Mm apparently improved the hydrogen absorption capacity. Adding transition elements to Mg-based alloys can improve their hydrogen storage properties. Vyas et al.26 added Cu to an Mg2Ni alloy in varying amounts (0, 2, 5, 10 wt%) and found that the stability of the hydride was decreased by this addition. Shi et al.27 reported that partially replacing Ni with Cu in the LaMg8.52Ni2.38 alloy decreases its initial dehydrogenation temperature by 18.20 K.Our previous research has shown that for the Mg2Ni alloy, the addition of Nd and Y can dramatically enhance the alloy in some aspects, including the gaseous and electrochemical hydrogen storage kinetics.28–30 Besides the rare earths Nd and Y, La is also a commonly used alloying element in Mg-based alloys.31–33 Moreover, compared with Nd and Y, La has a lighter atomic mass. Ren et al.34 partially replaced Mg with La in the Mg2Ni alloy and found that appropriate La content can improve the hydrogen storage properties of the Mg2Ni alloy in terms of hydrogen storage capacity and hydrogen desorption kinetics. Ming et al.35 showed that adding La can reduce the thermodynamic stability of Mg–Ni composites. So we introduced La in Mg24Ni10Cu2 in this study. For the (Mg24Ni10Cu2)100−xLax (x = 0–20) alloys, the influences of the two factors of spinning rate and La content on the structure and hydrogen storage properties have been researched in detail.
Experimental
The sample alloys (Mg24Ni10Cu2)100−xLax (x = 0, 5, 10, 15, 20) were made in a vacuum induction furnace. The purity of all ingredients was above 99.9%, as provided by CISRI Corporation. As the volatilization of Mg needs to be avoided, the furnace was filled with a helium atmosphere and the pressure was controlled at 0.04 MPa. The main difference between the alloy compositions is the La content, so we name them La0, La5, La10, La15 and La20. After obtaining the as-cast alloys, a portion of the alloys was subjected to melt spinning. The spinning rate was represented by the linear velocity of the copper roller which was 10, 20, 30 or 40 m s−1. To facilitate a comparison, a spinning rate of 0 m s−1 is used to represent the as-cast alloys.By way of X-ray diffraction (XRD) (D/max/2400), the phase structures of the as-cast and spun alloys were examined. The experimental parameters were set as 160 mA, 40 kV and 10° min−1. For the as-spun alloys, the thin film samples were subjected to ion etching and examined under a high-resolution transmission electron microscope (HRTEM) (JEM-2100F). The crystalline states were verified by electron diffraction (ED).
After mechanical milling, the alloys were changed into fine powders with a diameter of 30 μm, and then carbonyl nickel powder and the alloy powder were mixed in a weight ratio of 4![[thin space (1/6-em)]](https://www.rsc.org/images/entities/char_2009.gif) :
:![[thin space (1/6-em)]](https://www.rsc.org/images/entities/char_2009.gif) 1. The mixture was cold pressed at 35 MPa into a round electrode pellet 15 mm in diameter and 1 g in weight. At 303 K, the electrochemical properties were tested using a tri-electrode open-cell consisting of a working electrode, a Hg/HgO reference electrode and a sintered Ni(OH)2/NiOOH counter electrode, and the electrolyte was 6 M KOH. The so-called discharge voltage was the voltage between the reference and negative electrodes. During every cycle, the alloy electrode was first charged at a constant current density, and after a break of 15 min, the alloy electrode was discharged to −500 mV at the same current density.
1. The mixture was cold pressed at 35 MPa into a round electrode pellet 15 mm in diameter and 1 g in weight. At 303 K, the electrochemical properties were tested using a tri-electrode open-cell consisting of a working electrode, a Hg/HgO reference electrode and a sintered Ni(OH)2/NiOOH counter electrode, and the electrolyte was 6 M KOH. The so-called discharge voltage was the voltage between the reference and negative electrodes. During every cycle, the alloy electrode was first charged at a constant current density, and after a break of 15 min, the alloy electrode was discharged to −500 mV at the same current density.
The hydrogenation/dehydrogenation kinetics was measured using an automatically controlled Sieverts apparatus. Before testing the de-/hydrogenation kinetics, several hydrogenation and dehydrogenation cycles were needed to activate the sample alloys. Hydrogen absorption happened at 2 MPa and 473 K, and dehydrogenation was carried out at 1 × 10⁻⁴ MPa and 523 K.
Results and discussion
Microstructure characteristics
The XRD profiles of the as-spun (Mg24Ni10Cu2)100−xLax (x = 0–20) alloys are shown in Fig. 1. The XRD pattern of the as-cast La20 alloy in Fig. 1(a) shows three phases including the main phase Mg2Ni (PDF#35-1225) and the secondary phases La2Mg17 (PDF#17-0399) and LaMg3 (PDF#26-0426). However, only Mg2Ni (PDF#35-1225) can be identified in the XRD pattern of the La0 alloy spun at 40 m s−1 shown in Fig. 1(b). Both the as-cast La20 alloy and the as-spun La0 alloy have fairly sharp diffraction peaks, implying that a crystalline structure is formed. The diffraction peaks of all the La-containing as-spun alloys are much wider and smoother, showing the formation of amorphous phases. Increasing the La content and spinning rate leads to an increase in the degree of amorphization, demonstrating that glass formation is promoted in Mg2Ni-type alloys.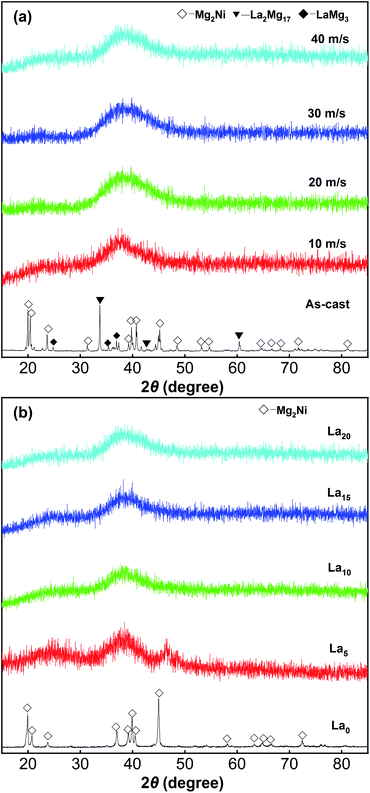 | ||
| Fig. 1 XRD profiles of the as-cast and spun (Mg24Ni10Cu2)100−xLax (x = 0–20) alloys: (a) La20 alloy, (b) as-spun alloys (40 m s−1). | ||
In this study, the morphology of the alloys was observed by HRTEM and the crystal state was observed by ED, as shown in Fig. 2. Fig. 2(a)–(c) show that the as-spun La20 alloy has a nanocrystalline and amorphous structure, and that the amorphous phase content clearly increases with increasing spinning rate, indicating that the proportion of the glass phase is strongly impacted by the spinning rate. Fig. 2(d) shows the nanocrystalline structure of the as-spun La0 alloy which contains crystal defects and disordered areas. The sharp multi-halos seen in the electron diffraction (ED) pattern imply that it has a nanocrystalline structure as well. Nevertheless, the as-spun La10 and La20 alloys display apparent characteristics of nanocrystalline materials implanted in amorphous structures. Broad and dull halos appear in their electron diffraction patterns, revealing the appearance of amorphous structures in the alloys, in keeping with the results from XRD.
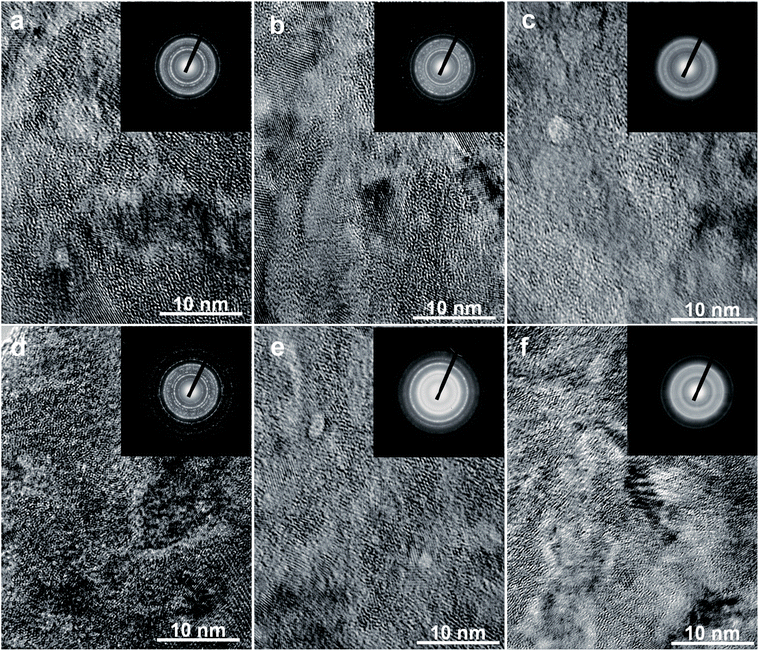 | ||
| Fig. 2 TEM micrographs and ED patterns of the as-spun alloys: (a)–(c) La20 alloy spun at 10, 20, and 30 m s−1; (d)–(f) as-spun (40 m s−1) La0, La10, and La20 alloys. | ||
Electrochemical hydrogen storage properties
Fig. 3 depicts the alteration of the discharge capacity with cycle number at a current density of 60 mA g−1, reflecting the activation process of the sample alloys, namely the discharge capacity reaches its top value with increasing cycle number. A conclusion can be made that after at most three charge/discharge cycles, the maximal discharge capacity can be reached, showing a great activation capability. As is well known, a change in the internal energy during the hydrogenation process affects the activation capability of alloy electrodes significantly. The activation capability will decrease as a result of an increase in internal energy.36 Generally speaking, there are two kinds of energy, namely the interface energy and the strain energy, that correspond to the internal energy. The interface energy originates from the oxidized film on the electrode alloy surface, and the strain energy appears during the process of H atom diffusion into interstitial sites in the octahedral or tetrahedral lattice. The excellent activation performance of alloys depends on the nanocrystalline/amorphous structure created during melt spinning, which is the reason for the plentiful grain boundaries. During the hydrogen absorption process, the strain energy and lattice distortion could be released greatly by these grain boundaries.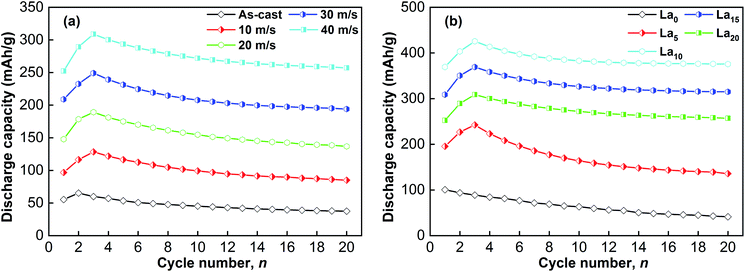 | ||
| Fig. 3 Evolution of the discharge capacity of the as-cast and spun (Mg24Ni10Cu2)100−xLax (x = 0–20) alloys with cycle number: (a) La20 alloy, (b) as-spun alloys (40 m s−1). | ||
Fig. 4 demonstrates the relationships between the discharge potential and discharge capacity of different experimental alloys. It has been noted that the improvement in discharge capacity always occurs with a decrease in discharge potential, implying instability of the output power. The stability of a cell is directly decided by the discharge potential characteristics, key parameters of sample electrodes reflected by the potential plateau of a discharge curve. A curve with a long and horizontal discharge potential plateau indicates excellent discharge potential characteristics. According to the findings, the discharge potential properties can be significantly improved by two factors, namely La addition and melt spinning, which will elongate and enhance the discharge plateau. The internal resistance mainly consists of ohmic internal resistance and polarization resistance. The potential characteristics of an electrode basically depend on its internal resistance, which is determined by the diffusion capability of H atoms inside the electrode. Increasing the diffusion coefficient of H atoms will reduce the internal resistance of alloys.37 The positive impact caused by La addition and melt spinning is related to the refinement of grains and the increase in grain boundaries, which increases the diffusion coefficient of hydrogen atoms by providing diffusion paths.38
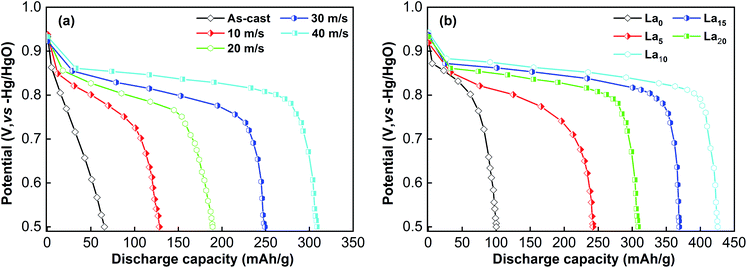 | ||
| Fig. 4 Discharge potential curves of the as-cast and spun (Mg24Ni10Cu2)100−xLax (x = 0–20) alloys: (a) La20 alloy, (b) as-spun alloys (40 m s−1). | ||
For the as-cast and spun (Mg24Ni10Cu2)100−xLax (x = 0–20) alloys, their discharge capacities vary with the changes in La content and spinning rate, as Fig. 5 shows. The discharge capacity usually increases with an increase in spinning rate. Increasing the spinning rate from 0 to 40 m s−1 enhances the discharge capacity of the La0 alloy from 42.5 to 100.6 mA h g−1, and the discharge capacity of the La10 alloy from 80.4 to 425.6 mA h g−1. Moreover, at a fixed spinning rate, varying the La content can result in a change in discharge capacity as well. The alloys spun at 0, 10, 20, 30 and 40 m s−1 achieve their maximal discharge capacities of 80.4, 166.9, 221.7, 358.6 and 425.6 mA h g−1, respectively, when x = 10.
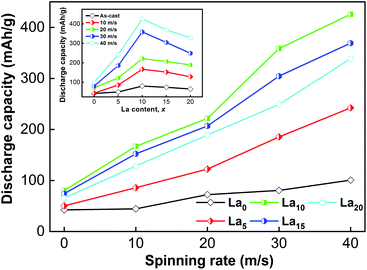 | ||
| Fig. 5 Evolution of the discharge capacity of the as-cast and spun (Mg24Ni10Cu2)100−xLax (x = 0–20) alloys with spinning rate and La content. | ||
Compared with the interior of grains and amorphous areas, grain boundaries have much higher hydrogen concentration.39 Melt spinning can improve the discharge capacity of alloys by creating an amorphous and nanocrystalline structure that holds a large amount of grain boundaries. Moreover, the absorbability of hydrogen atoms on the surface of nanocrystalline nickel is stronger than that on polycrystalline nickel, which accelerates the dissociation of H and improves the electrode capacity.40 The alloys have maximal discharge capacities when the spinning rate is fixed and the La content changes, which shows both positive and negative influences of La addition on the discharge capacity of alloys. Because the discharge capacity will increase with increasing cell volume, the beneficial effect is connected with the increased cell volume caused by adding La.34 As to the unfavorable influence, it is related to the decrease in the amount of the Mg2Ni phase, which results from the combination of Mg and newly added La to form La2Mg17 and LaMg3 as secondary phases. In this experiment, the two secondary phases La2Mg17 and LaMg3 appear when the La content reaches x = 10. Electrochemical hydrogen desorption at room temperature is hard for the two new secondary phases.
Gaseous hydrogen absorption and desorption kinetics
Under the initial conditions of 473 K and 2 MPa, the as-cast and spun (Mg24Ni10Cu2)100−xLax (x = 0–20) alloys were tested in order to investigate the relationships between hydrogenation capacity and time, as displayed in Fig. 6. We can see that the samples exhibit a very quick initial hydrogenation rate, and then the hydrogenation rate declines dramatically. The hydrogen concentration in the alloys becomes saturated gradually over time. The saturated hydrogenation capacity obviously falls with increasing La content, owing to the decreased amount of the major Mg2Ni phase which results from adding La. For a comparison, the hydrogen absorption kinetics are represented by the hydrogen absorption saturation ratio (Rt) established as Rt = Ct/C100 × 100%, where Ct means the hydrogenation capacity at t min and C100 represents that at 100 min. When the hydrogen absorption time is 100 min, all the sample alloys can reach more than 98% of their saturated hydrogenation capacity. So, we use C100 to approximately represent the saturated hydrogenation capacity for each sample in this work. Based on the above definition, we take the R5 (t = 5) value as a criterion to compare the effects of spinning rate and La content on the hydrogen absorption kinetics, as shown in Fig. 6. An increase in spinning rate and La content enhances the R5 value. For example, raising the spinning rate from 0 to 40 m s−1 makes the R5 value increase from 41.3% to 94.7% for the La20 alloy, and raising the La content from 0 to 20 results in the R5 value rising from 88.4% to 94.7% for the as-spun (40 m s−1) alloys. The results suggest that the alloy’s hydrogenation kinetics can be affected by its composition and structure. Through refining the alloy grains, melt spinning can improve the hydrogen absorption kinetics of alloys. The refinement will provide many new paths for hydrogen atoms to diffuse through by creating numerous new grains and grain boundaries. Adding La gives rise to enlargement of the cell volume. The volume expansion required for hydrogenation will be smaller for a bigger cell, consequently resulting in lower diffusion activation energy. Thus, adding La facilitates the hydrogen absorption kinetics.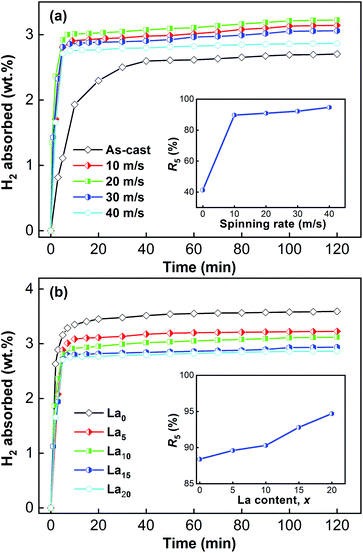 | ||
| Fig. 6 Hydrogen absorption kinetic curves of the as-cast and spun (Mg24Ni10Cu2)100−xLax (x = 0–20) alloys: (a) La20 alloy, (b) as-spun alloys (40 m s−1). | ||
Over time, the dehydrogenation capacities of the alloys change. The variation of the dehydrogenation capacities of the sample alloys at 523 K and 1 × 10⁻⁴ MPa is displayed in Fig. 7. The dehydrogenation capacity can be enhanced by melt spinning and adding La. Moreover, the dehydrogenation capacity also increases with increasing spinning rate and La content. The relationships between the dehydrogenation kinetics and the spinning rate and La content were investigated as well. The symbol rt is used to represent the dehydrogenation kinetics according to the expression rt = ct/C100 × 100%, where ct means the dehydrogenation capacity at t min, and C100 has been defined previously. Taking the dehydrogenation capacity at 10 min (r10) as a benchmark, the effects of La content and spinning rate on the dehydrogenation kinetics could be established and compared, as demonstrated in Fig. 8. Increasing the La content and spinning rate clearly enhances the r10 value. The r10 value of the La20 alloy is increased from 31.1% to 55.2% when the spinning rate rises from 0 to 40 m s−1, and the r10 value of the as-spun (40 m s−1) alloys is enhanced from 38.9% to 55.2% on increasing the La content from 0 to 20. As is well known, there are two key determinants of the dehydrogenation kinetics, which are the H atom diffusion capability and the hydride thermal stability. As to the beneficial influence on dehydrogenation kinetics caused by melt spinning, it is related to the newly formed nanocrystalline and amorphous structure, which has a mass of grain boundaries and a high specific surface area, thus facilitating the dehydrogenation reaction.41 Zaluski et al. found that the dehydrogenation temperature of a polycrystalline Mg2Ni alloy dropped below 473 K on decreasing the grain size to nanometer-scale.42 The beneficial effect of adding La on the dehydrogenation kinetics is connected with two aspects, namely reducing hydride stability and facilitating amorphous phase formation.18,19
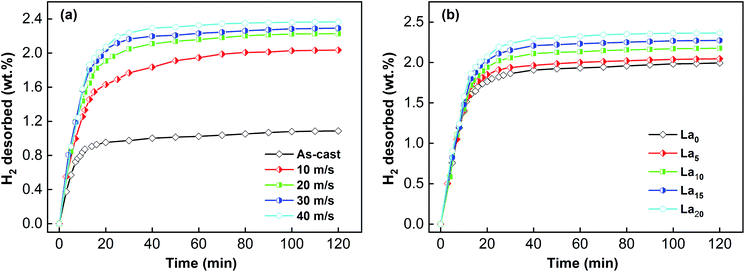 | ||
| Fig. 7 Hydrogen desorption kinetic curves of the as-cast and spun (Mg24Ni10Cu2)100−xLax (x = 0–20) alloys: (a) La20 alloy, (b) as-spun alloys (40 m s−1). | ||
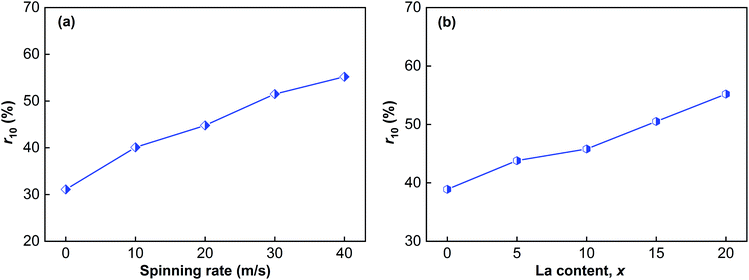 | ||
| Fig. 8 Evolution of the r10 values of the as-cast and spun (Mg24Ni10Cu2)100−xLax (x = 0–20) alloys with spinning rate and La content: (a) La20 alloy, (b) as-spun alloys (40 m s−1). | ||
Hydrogen desorption activation energy
The whole potential barrier is represented by the gas–solid reaction activation energy which is a crucial part of the kinetic properties of the reaction. Recent research has suggested that the gaseous hydrogen desorption reaction is related to the whole energy barrier.36 The Kissinger method is a useful way to obtain the dehydrogenation activation energy of an alloy. By the Kissinger equation, the dehydrogenation activation energy (Ek) can be calculated:43| d[ln(β/Tp/Tp)]/d(1/Tp) = −Ek/R | (1) |
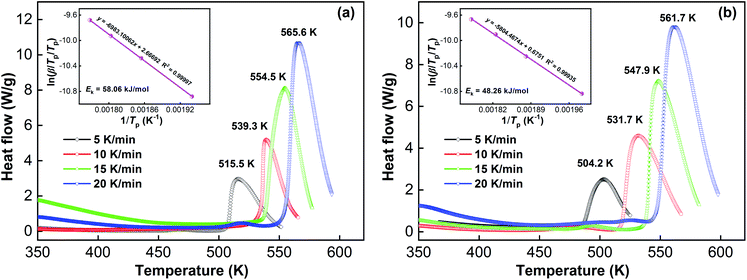 | ||
| Fig. 9 DSC curves and Kissinger plots of the as-spun (40 m s−1) La10 and La20 alloys: (a) La10 alloy, (b) La20 alloy. | ||
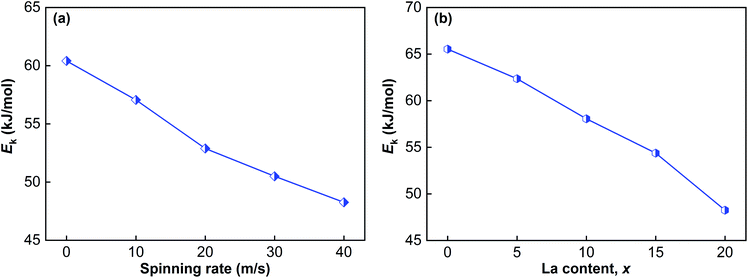 | ||
| Fig. 10 Evolution of the Ek values of the as-cast and spun (Mg24Ni10Cu2)100−xLax (x = 0–20) alloys with spinning rate and La content: (a) La20 alloy, (b) as-spun alloys (40 m s−1). | ||
Conclusions
(1) The as-spun (Mg24Ni10Cu2)100−xLax (x = 0–20) alloys have a nanocrystalline and amorphous structure. The main phase of the alloys is Mg2Ni. La addition facilitates amorphous phase formation and leads to the formation of the secondary phases La2Mg17 and LaMg3.(2) The electrochemical hydrogenation/dehydrogenation reactions of the alloys at room temperature show that the electrochemical discharge capacity always increases with increasing spinning rate. However, a maximum value appears during the variation of La content. Furthermore, the discharge potential characteristics can be improved by melt spinning and adding La.
(3) Adding La reduces the gaseous hydrogenation capacity. However, it can significantly improve the de-/hydrogenation kinetics. The values of R5 and r10 can be obviously increased by increasing the La content and spinning rate.
(4) By the Kissinger method, we found that raising the spinning rate and La content clearly decreases the dehydrogenation activation energy, which is regarded as the true driving force behind the hydrogen desorption kinetics being improved by raising the spinning rate and La content.
Conflicts of interest
There are no conflicts to declare.Acknowledgements
This work is financially supported by the National Natural Science Foundation of China (51761032, 51871125 and 51901105), the Natural Science Foundation of Inner Mongolia, China (2019BS05005) and the Inner Mongolia University of Science and Technology Innovation Fund (2019QDL-B11).References
- U. B. Demirci, O. Akdim and P. Miele, Int. J. Hydrogen Energy, 2009, 34, 2638–2645 CrossRef CAS.
- G. W. Crabtree and M. S. Dresselhaus, MRS Bull., 2008, 33, 421–428 CrossRef CAS.
- Y. H. Zhang, P. P. Wang, W. G. Bu, Z. M. Yuan, Y. Qi and S. H. Guo, RSC Adv., 2018, 8, 23353–23363 RSC.
- I. P. Jain, Int. J. Hydrogen Energy, 2009, 34, 7368–7378 CrossRef CAS.
- M. S. El-Eskandarany, RSC Adv., 2019, 9, 9907–9930 RSC.
- D. Mori and K. Hirose, Int. J. Hydrogen Energy, 2009, 34, 4569–4574 CrossRef CAS.
- Z. M. Yuan, W. Zhang, P. L. Zhang, Y. H. Zhang, W. G. Bu, S. H. Guo and D. L. Zhao, RSC Adv., 2017, 7, 56365–56374 RSC.
- L. Vellingiri, K. Annamalai, R. Kandasamy and I. Kombiah, RSC Adv., 2019, 9, 31483–31496 RSC.
- L. Zubizarreta, J. A. Menéndez, J. J. Pis and A. Arenillas, Int. J. Hydrogen Energy, 2009, 34, 3070–3076 CrossRef CAS.
- S. Satyapal, J. Petrovic and G. Thomas, Sci. Am., 2007, 296, 80–87 CrossRef CAS.
- Q. Qin, T. Sun, H. Wang, P. Brault, H. An, L. Xie and Q. Peng, Nanomaterials, 2020, 10, 344 CrossRef CAS.
- Y. H. Zhang, Y. Q. Ji, Z. M. Yuan, W. G. Bu, Y. Qi and S. H. Guo, RSC Adv., 2018, 8, 28969–28977 RSC.
- A. Ebrahimi-Purkani and S. F. Kashani-Bozorg, J. Alloys Compd., 2008, 456, 211–215 CrossRef CAS.
- D. Chandra, A. Sharma, R. Chellappa, W. N. Cathey, F. E. Lynch, R. C. Bowman Jr, J. R. Wermer and S. N. Paglieri, J. Alloys Compd., 2008, 452, 312–324 CrossRef CAS.
- L. Schlapbach and A. Züttel, Nature, 2001, 414, 353–358 CrossRef CAS.
- X. Xie, M. Chen, M. Hu, B. Wang, R. Yu and T. Liu, Int. J. Hydrogen Energy, 2019, 44, 10694–10712 CrossRef CAS.
- Y. F. Liu, H. G. Pan, M. X. Gao and Q. D. Wang, J. Mater. Chem., 2011, 21, 4743–4755 RSC.
- A. L. Eric, Int. J. Hydrogen Energy, 2011, 36, 10787–10796 CrossRef.
- T. Spassov and U. Köster, J. Alloys Compd., 1999, 287, 243–250 CrossRef CAS.
- N. Juahir, N. S. Mustafa, A. M. Sinin and M. Ismail, RSC Adv., 2015, 5, 60983–60989 RSC.
- A. Teresiak, A. Gebert, M. Savyak, M. Uhlemann, C. Mickel and N. Mattern, J. Alloys Compd., 2005, 398, 156–164 CrossRef CAS.
- K. Siarhei, R. Lars, R. Thomas, G. Thomas, W. Thomas and K. Bernd, Int. J. Hydrogen Energy, 2011, 36, 1592–1600 CrossRef.
- W. Lv and Y. Wu, J. Alloys Compd., 2019, 789, 547–557 CrossRef CAS.
- M. Y. Song, E. Choi and Y. J. Kwak, Mater. Res. Bull., 2020, 130, 110938 CrossRef CAS.
- L. J. Huang, G. Y. Liang, Z. B. Sun and D. C. Wu, J. Power Sources, 2006, 160, 684–687 CrossRef CAS.
- D. Vyas, P. Jain, J. Khan, V. Kulshrestha, A. Jain and I. P. Jain, Int. J. Hydrogen Energy, 2012, 37, 3755–3760 CrossRef CAS.
- H. Shi, S. Han, Y. Jia, Y. Liu, X. Zhao and B. Liu, J. Rare Earths, 2013, 31, 79–84 CrossRef CAS.
- Y. H. Zhang, T. Yang, W. G. Bu, Y. Cai, G. F. Zang and D. L. Zhao, Trans. Nonferrous Met. Soc. China, 2013, 23, 3668–3676 CrossRef CAS.
- Y. H. Zhang, S. Xu, T. T. Zhai, T. Yang, Z. M. Yuan and D. L. Zhao, Trans. Nonferrous Met. Soc. China, 2014, 24, 3524–3533 CrossRef CAS.
- Y. H. Zhang, Z. M. Yuan, T. Yang, Y. Qi and D. L. Zhao, J. Solid State Electrochem., 2015, 19, 1187–1195 CrossRef CAS.
- L. Ouyang, F. Liu, H. Wang, J. Liu, X. Yang, L. Sun and M. Zhu, J. Alloys Compd., 2020, 832, 154865 CrossRef CAS.
- B. Liao, Y. Q. Lei, L. X. Chen, G. L. Lu, H. G. Pan and Q. D. Wang, J. Power Sources, 2004, 129, 358–367 CrossRef CAS.
- J. Zhang, Z. Li, Y. Wu, X. Guo, J. Ye, B. Yuan, S. Wang and L. Jiang, RSC Adv., 2019, 9, 408–428 RSC.
- H. P. Ren, Y. H. Zhang, B. W. Li, D. L. Zhao, S. H. Guo and X. L. Wang, Int. J. Hydrogen Energy, 2009, 34, 1429–1436 CrossRef CAS.
- A. Ming, Mater. Sci. Eng., B, 2005, 117, 37–44 CrossRef.
- T. Sadhasivam, M. S. L. Hudson, S. K. Pandey, A. Bhatnagar, M. K. Singh, K. Gurunathan and O. N. Srivastava, Int. J. Hydrogen Energy, 2013, 38, 7353–7362 CrossRef CAS.
- W. H. Lai and C. Z. Yu, Chin. Battery, 1996, 26, 189–191 CAS.
- Y. Wu, W. Hana, S. X. Zhou, M. V. Lototsky, J. K. Solberg and V. A. Yartys, J. Alloys Compd., 2008, 466, 176–181 CrossRef CAS.
- T. Spassov, L. Lyubenova, U. Koster and M. D. Baro, Mater. Sci. Eng., A, 2004, 375–377, 794–799 CrossRef.
- X. Y. Zhao, Y. Ding, L. Q. Ma, L. Y. Wang, M. Yang and X. D. Shen, Int. J. Hydrogen Energy, 2008, 33, 6727–6733 CrossRef CAS.
- T. Spassov and U. Köster, J. Alloys Compd., 1998, 279, 279–286 CrossRef CAS.
- L. Zaluski, A. Zaluska and J. O. Ström-Olsen, J. Alloys Compd., 1997, 70, 253–254 Search PubMed.
- L. Z. Ouyang, J. M. Huang, C. J. Fang, Q. A. Zhang, D. L. Sun and M. Zhu, Int. J. Hydrogen Energy, 2012, 37, 12358–12364 CrossRef CAS.
- T. Liu, T. W. Zhang, X. Z. Zhang and X. G. Li, Int. J. Hydrogen Energy, 2011, 36, 3515–3520 CrossRef CAS.
| This journal is © The Royal Society of Chemistry 2020 |
