DOI:
10.1039/D0RA05274D
(Paper)
RSC Adv., 2020,
10, 27911-27922
Structural, mechanical, dielectric properties and magnetic interactions in Dy3+-substituted Co–Cu–Zn nanoferrites
Received
16th June 2020
, Accepted 12th July 2020
First published on 27th July 2020
Abstract
Sol–gel-synthesized Co–Cu–Zn ferrite nanoparticles diluted with Dy3+ ions were investigated in terms of their structural, morphological, elastic, magnetic and dielectric properties. X-ray diffraction patterns showed the formation of a single-phase cubic spinel structure. As the concentration of Dy3+ ions was increased, the lattice length gradually increased from 8.340 to 8.545 Å, obeying Vegard's law. The Williamson–Hall (W–H) method was employed to observe the change in the lattice strain. Crystallite size obtained from W–H plots followed a pattern similar to that observed using the Scherrer equation. The cation distribution suggested a strong preference of Dy3+ ions for the octahedral B site while Cu2+ and Fe3+ ions were distributed over both A and B sites. The microstructures of the samples were visualized using transmission electron microscopy. Mechanical properties such as stiffness constant, longitudinal and transverse wave velocities, Young's modulus, bulk modulus, rigidity modulus, Poisson's ratio and Debye temperature were investigated by acquiring infrared spectra recorded in the range of 300 to 800 cm−1. Replacement of Fe3+ ions with the strongly magnetic Dy3+ ions increased the saturation magnetization and coercivity. Dielectric constant increased with Dy3+ substitution but decreased with applied frequency.
Introduction
Nanocrystalline spinel oxides such as ferrites display integral properties of magnetization and electrical insulation simultaneously and thus have attracted enormous attention of researchers and have prompted them to intensively investigate these systems. Ferrites offer numerous technological applications including telecommunications and electronic engineering, microwave-absorbing devices, transformer cores, magnetic recording media, magnetic resonance imaging, sensors, computer memory chips, ferro-fluids, radio frequency coil fabrication, catalysis, photocatalysis, magnetically guided drug delivery, hyperthermia, etc.1–6 Nanodimension spinel ferrites constitute a primary class of nanomaterials having advantageous ferromagnetic properties that have promoted their technological applicability.7–9 Among the ferrimagnetic spinel ferrites, CoFe2O4 with an MgAl2O4 inverse spinel-like crystal structure displays particularly excellent magnetic properties such as excellent saturation magnetization (Ms ∼ 80 emu g−1), coercivity (Hc ∼ 3−5 kOe), first-order magnetocrystalline anisotropy constant (K1 ∼ 10 × 106 erg cm−1) and Curie temperature (Tc ∼ 870 K).10,11 Structural, elastic, magnetic and electrical properties of CoFe2O4 have been reportedly enhanced by the substitution of Cu and/or Zn ions.1,12,13
Apparently, properties of spinel ferrite have been shown to be modified by substitutions of rare earth (RE3+) ions at the octahedral B site.14 These modifications have been attributed to the RE3+ ions having large magnetic moments, very large magnetostriction and large magnetocrystalline anisotropy as a result of their strong spin–orbit coupling of the angular momentum and unpaired 4f electrons.
Furthermore, the 4f shell of RE3+ ions is covered by 5s25p6 electrons and is not influenced by the potential field of the neighbouring metal ions. The substitution of RE3+ into ferrites can establish the 4f–3d couplings that govern magnetocrystalline anisotropy and hence improve the magnetic properties of the ferrites.15,16 Also, RE3+ oxides have good electrical resistivity of >105 Ω cm at room temperature.17,18 Among the RE3+ ions, substitution of Dy3+ ions have yielded particularly marked improvements in the properties of ferrites.19,20 In the current work, the structural, elastic, magnetic and dielectric properties of Co0.4Cu0.1Zn0.5DyxFe2−xO4 (where, x = 0.0, 0.015, 0.03, 0.045) nanoparticles synthesized using the sol–gel auto-combustion route were revealed, for the first time to the best of our knowledge.
The sol–gel auto-combustion method was used in the present work for the synthesis of Co0.4Cu0.1Zn0.5DyxFe2−xO4 materials since use of this method has been shown to produce nanoparticles. Importantly, relative to other available processes such as co-precipitation and hydrothermal methods, the sol–gel auto-combustion method displays advantages such as the ability to form a desired phase and composition, control over crystal size and aggregation state, short processing time, easy process, and use of inexpensive raw materials.1
The main objective of the present work was to investigate the effect of Dy3+ ions on the structural, optical and magnetic properties of the Co–Cu–Zn ferrite. Regarding structural properties, the crystallite size and strain effect were investigated systematically. Elastic behavior was investigated using infrared spectroscopy. Magnetic properties such as saturation magnetization and coercivity of the investigated samples were also studied for their possible applications in technological devices.
Materials and methods
Pure, ultrafine nanopowders of Co0.4Cu0.1Zn0.5DyxFe2−xO4 (x = 0.0, 0.015, 0.03, 0.045) were fabricated by applying the sol–gel autocombustion method. Ultrapure ((>99%) metal nitrates of Co(NO3)2·6H2O, Cu(NO3)2·6H2O, Zn(NO3)2·6H2O, Fe(NO3)3·9H2O, and Dy(NO3)3·9H2O) were used in combination with (C6H8O7·H2O) as a chelating agent in the molar ratio of 1![[thin space (1/6-em)]](https://www.rsc.org/images/entities/char_2009.gif) :
:![[thin space (1/6-em)]](https://www.rsc.org/images/entities/char_2009.gif) 3. Liquid ammonia was slowly introduced into the solution in order to adjust the pH to be ≅7. Until a viscous gel formed, the whole mixture was continuously stirred at a constant temperature of 90 °C. After a self-ignition process was carried out, the burnt powders were sintered at 700 °C for 6 h and ground in order to obtain the desired fine nanoparticles.
3. Liquid ammonia was slowly introduced into the solution in order to adjust the pH to be ≅7. Until a viscous gel formed, the whole mixture was continuously stirred at a constant temperature of 90 °C. After a self-ignition process was carried out, the burnt powders were sintered at 700 °C for 6 h and ground in order to obtain the desired fine nanoparticles.
Powder samples were characterized by subjecting them to X-ray diffraction analysis using a Rigaku (Miniflux II) diffractometer spanning diffraction angles from 20−80° at a slow rate of 2° per minute together with using Cu-Kα radiation (λ = 1.5406 Å) at 40 kV. The microstructures and surface morphologies of the samples were investigated using transmission electron microscopy (JEOL JEM 2100). Elasticity parameters were computed from FTIR spectra recorded in the range 300–800 cm−1. FTIR measurements were performed on disc-shaped samples made by using ferrite-KBr with a ratio of 1![[thin space (1/6-em)]](https://www.rsc.org/images/entities/char_2009.gif) :
:![[thin space (1/6-em)]](https://www.rsc.org/images/entities/char_2009.gif) 10. Magnetic characterization was carried out using a vibrating sample magnetometer and applying a magnetic field of up to 5 kOe. The dielectric behavior of the samples was investigated by first forming silver-pasted discs of them and then analyzing the discs by using a Hioki HiTESTER 3532-50.
10. Magnetic characterization was carried out using a vibrating sample magnetometer and applying a magnetic field of up to 5 kOe. The dielectric behavior of the samples was investigated by first forming silver-pasted discs of them and then analyzing the discs by using a Hioki HiTESTER 3532-50.
Results and discussion
Structural analysis
Bragg reflections from the (220), (311), (222), (400), (422), (333), (440), and (533) planes (indexed by ICCD # 00-008-0234) were observed in the X-ray diffraction (XRD) patterns of Co0.4Cu0.1Zn0.5DyxFe2−xO4 (Fig. 1). These patterns clearly indicated the formation of a single phase, in particular a cubic spinel structure belonging to the space group Fd![[3 with combining macron]](https://www.rsc.org/images/entities/char_0033_0304.gif) m.23 Neither any impurity nor a secondary phase was indicated from an analysis of the XRD patterns. Addition of Dy3+ ions shifted the peak positions of Co0.4Cu0.1Zn0.5Fe2O4 slightly towards the lower angles, as depicted in Fig. 1. The experimental lattice length aexp was computed by employing the equation21
m.23 Neither any impurity nor a secondary phase was indicated from an analysis of the XRD patterns. Addition of Dy3+ ions shifted the peak positions of Co0.4Cu0.1Zn0.5Fe2O4 slightly towards the lower angles, as depicted in Fig. 1. The experimental lattice length aexp was computed by employing the equation21  , where (h k l) are the Miller indices and d is the interplanar distance. As shown in Fig. 2a, the lattice length of Co0.4Cu0.1Zn0.5DyxFe2−xO4 increased from 8.340 to 8.545 Å with the substitution of Dy3+ ions. This change in aexp can be understood in terms of the ionic radii of the constituent ions, where Fe3+ ions of smaller ionic radii (0.67 Å) were replaced with Dy3+ ions of greater ionic radii (0.99 Å). The observed increase in aexp indicated the substitution of Dy3+ ions into Co0.4Cu0.1Zn0.5Fe2O4 possibly inducing tensile strain into the lattice by deforming it elastically.
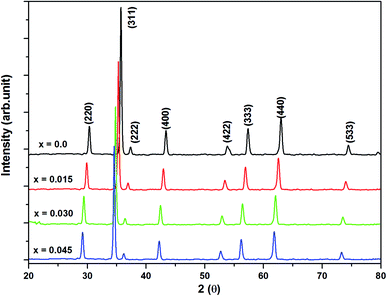 |
| | Fig. 1 X-ray powder diffraction patterns of all of the investigated samples of Co0.4Cu0.1Zn0.5DyxFe2−xO4. | |
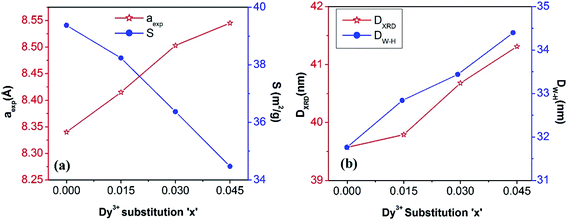 |
| | Fig. 2 (a) Experimental lattice length (aexp) and specific surface area (s) values and (b) crystallite sizes obtained from XRD (DXRD) and from W–H plots (DW–H) of Co0.4Cu0.1Zn0.5DyxFe2−xO4 ferrites. | |
The nanocrystalline nature of the samples obtained from the Debye–Scherrer relationship and the microstrain induced in the crystal lattice were studied by using the Williamson–Hall (W–H) relationship22
| |
 | (1) |
where
C = 0.94 for the nanocrystals of uniform size,
DW–H is the crystallite size,
λ is incident wavelength, and
ε is the microstrain induced in the crystal lattice. In comparison to the Debye–Scherrer relationship, W–H analysis gives better information about crystallite size.
23 Values of
ε and
DW–H were obtained from the slope and
y-intercept of the fitted line drawn between 4
![[thin space (1/6-em)]](https://www.rsc.org/images/entities/char_2009.gif)
sin
![[thin space (1/6-em)]](https://www.rsc.org/images/entities/char_2009.gif) θ
θ and
β![[thin space (1/6-em)]](https://www.rsc.org/images/entities/char_2009.gif)
cos
![[thin space (1/6-em)]](https://www.rsc.org/images/entities/char_2009.gif) θ
θ as shown in
Fig. 3. Strain values are given in the inset of
Fig. 3 and
DW–H values for various Dy concentrations are shown in
Fig. 2b.
DW–H obtained from W–H plots were observed to range from 31.76 to 34.40 nm for the tested concentrations, and the strain values ranged from 3.133 × 10
−4 to 4.344 × 10
−4. Positive values of slope here indicated that the tensile type of strain induced on the lattice increased with the Dy substitution. The increase in tensile strain with Dy substitution was also consistent with the observed change in the lattice length described above.
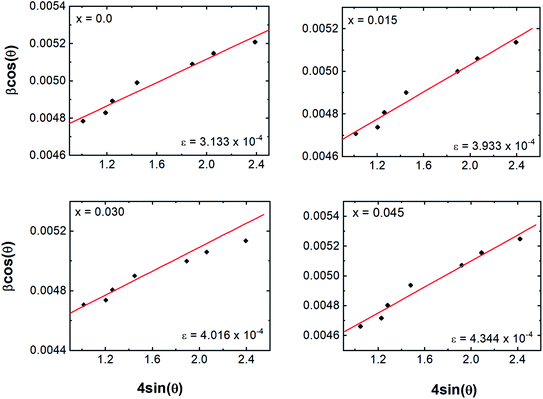 |
| | Fig. 3 Williamson–Hall analysis plots of β![[thin space (1/6-em)]](https://www.rsc.org/images/entities/char_2009.gif) cos cos![[thin space (1/6-em)]](https://www.rsc.org/images/entities/char_2009.gif) θ versus 4 θ versus 4![[thin space (1/6-em)]](https://www.rsc.org/images/entities/char_2009.gif) sin sin![[thin space (1/6-em)]](https://www.rsc.org/images/entities/char_2009.gif) θ of Co0.4Cu0.1Zn0.5DyxFe2−xO4. θ of Co0.4Cu0.1Zn0.5DyxFe2−xO4. | |
The crystallite diameter DXRD of the powders was also obtained by using the peak broadening (β) and Bragg angle (θ) of the (311) peak from the well-known Debye–Scherrer23 equation DXRD = (Cλ/β![[thin space (1/6-em)]](https://www.rsc.org/images/entities/char_2009.gif) cos
cos![[thin space (1/6-em)]](https://www.rsc.org/images/entities/char_2009.gif) θ), where C = 0.94 and λ = 1.5406 × 10⁻¹⁰ m. Addition of Dy3+ ions into Co–Cu–Zn ferrites increased the DXRD from 39.57 to 41.31 nm (Fig. 2b). The specific surface area (S) was computed by using the relationship24
θ), where C = 0.94 and λ = 1.5406 × 10⁻¹⁰ m. Addition of Dy3+ ions into Co–Cu–Zn ferrites increased the DXRD from 39.57 to 41.31 nm (Fig. 2b). The specific surface area (S) was computed by using the relationship24
| |
 | (2) |
where
dX is X-ray density and 6 is the shape factor. As shown in
Fig. 2a,
S decreased from 39.37 m
2 g
−1 to 34.47 m
2 g
−1 as Dy was substituted. This decrease was related to the increased
DXRD of the samples with Dy substitution.
Cation distribution
The Bertaut method25 was adopted to compute the cation distribution in Co0.4Cu0.1Zn0.5DyxFe2−xO4. When using this method, a few pairs of the most sensitive reflections were selected according to the expression (IObs.hkl/IObs.h′k′l′) = (ICal.hkl/ICal.h′k′l′), where ICal.hkl and IObs.hkl denote the calculated and observed intensities, respectively. Cation distribution was obtained by comparing the ratios of calculated and experimental intensities for the (220), (400) and (440) reflections. These reflections have been shown (i) to be not dependent on oxygen, (ii) to have similar intensities, (iii) to have intensities varying inversely with cation occupancy. The corresponding integrated intensity Ihkl was evaluated by using the relationship derived by Buerger,26,27 namelywhere LP, P and F denote the Lorentz polarization, multiplicity and structure factor, respectively. LP was obtained by using the relationship23| |
 | (4) |
The cation distribution of Co0.4Cu0.1Zn0.5DyxFe2−xO4 spinel ferrite system obtained using the XRD technique is depicted in Table 1. Cu2+ ions occupied tetrahedral A site and octahedral B site. Zn2+ ions showed a preference for the A site whereas Co2+ ions occupied the B site. Dy3+ occupied the octahedral B site by replacing Fe3+ from the octahedral sites, a result consistent with the high B-site energy of RE3+ ions.
Table 1 Distributions of cations at the tetrahedral A site and octahedral B site and intensity ratios for Co0.4Cu0.1Zn0.5DyxFe2−xO4
| Comp. x |
Cation distribution |
Intensity ratios |
| (220/440) |
(440/422) |
| A site |
B site |
Obs. |
Cal. |
Obs. |
Cal. |
| 0.0 |
Cu0.05Zn0.5Fe0.45 |
Cu0.05Co0.4Fe1.55 |
0.692 |
0.701 |
3.957 |
4.094 |
| 0.015 |
Cu0.05Zn0.5Dy0.005Fe0.445 |
Cu0.05Co0.4Dy0.01Fe1.54 |
0.709 |
0.714 |
4.056 |
4.073 |
| 0.03 |
Cu0.05Zn0.5Dy0.01Fe0.44 |
Cu0.05Co0.4Dy0.02Fe1.53 |
0.708 |
0.729 |
4.069 |
4.043 |
| 0.045 |
Cu0.05Zn0.5Dy0.015Fe0.435 |
Cu0.05Co0.4Dy0.03Fe1.52 |
0.716 |
0.736 |
4.056 |
4.024 |
Cation distribution data of Co0.4Cu0.1Zn0.5DyxFe2−xO4 and ionic radii of constituent ions therein were used to determine values for the ionic radius of the A site, abbreviated as rA, and that of the B site, i.e., rB. As shown in Fig. 4a, rA and rB both increased with the Dy3+ substitution, attributed to the larger ionic radii of Dy ions compared to those of the Fe ions. The oxygen parameter u was obtained from the oxygen ion radius RO (1.32 Å) and rA using the equation:27
| |
 | (5) |
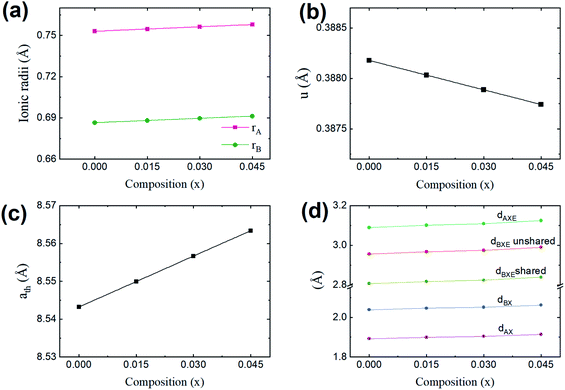 |
| | Fig. 4 (a) Values of the mean ionic radii at the tetrahedral A site (rA) and octahedral B site (rB), (b) oxygen positional parameter (u), (c) theoretical lattice length (ath) and (d) allied parameters such as; tetrahedral bond (dAX), octahedral bond (dBX), tetrahedral edge (dAXE), and octahedral edge (dBXE) shared and unshared, for the Co0.4Cu0.1Zn0.5DyxFe2−xO4 ferrites. | |
As shown in Fig. 4b, u decreased from 0.3882 Å to 0.3877 Å with the Dy substitution. According to many researchers, u would be expected to be 0.250 Å for the origin at the octahedral sites, and about 0.375 Å for the origin at tetrahedral sites and a centric crystal structure.28,29 According to XRD studies of some researchers, u > 0.375 Å for substituted ferrites.29,30 In the present study, u was determined to be higher than its expected “ideal” value of 0.375 Å.
The theoretical lattice length, ath, was determined using the relationship31
| |
 | (6) |
As shown in Fig. 4c, ath increased from 8.543 to 8.563 Å with the Dy3+ substitution in Co0.4Cu0.1Zn0.5Fe2O4 ferrite.
Shared and unshared octahedral edges (dBXE and dBXEU), the tetrahedral edge (dAXE) and tetrahedral and octahedral bond lengths (dAX and dBX) were obtained using relationships discussed elsewhere. As shown in Fig. 4d, dBXE, dBXEU, dAX, dBX and dAXE increased with the Dy3+ substitution. Such a change was ascribed to the increase in the value of aexp of Co0.4Cu0.1Zn0.5Fe2O4 with Dy3+ substitution.
Transmission electron microscopy
Fig. 5a and b depict the transmission electron microscopy images of the x = 0.0 and x = 0.045 samples, respectively. TEM images revealed the homogeneity of the sol–gel-synthesized samples with uniform particle size distribution. Most of the particles showed spherical shapes, in accordance with the tendency of cubic crystals to form spherical shapes in order to minimize surface tension.32,33 The agglomerations observed in the particles may be related to the interactions of magnetic dipoles arising within the ferrite nanoparticles.34 The main purpose of our acquiring the TEM images was to estimate the particle size, which was measured by employing ImageJ software (Version 1.52V). Fig. 5c and d show the histograms of the particle size distribution for the x = 0.0 and x = 0.45 samples, respectively. For the x = 0.0 sample, the particle sizes were observed to be in the range 28.53 to 97.16 nm with an average value of 62.632 nm. For the x = 0.045 sample, the particle sizes were observed to be in the range 41.97 to 114.215 nm with an average value of 77.789 nm.
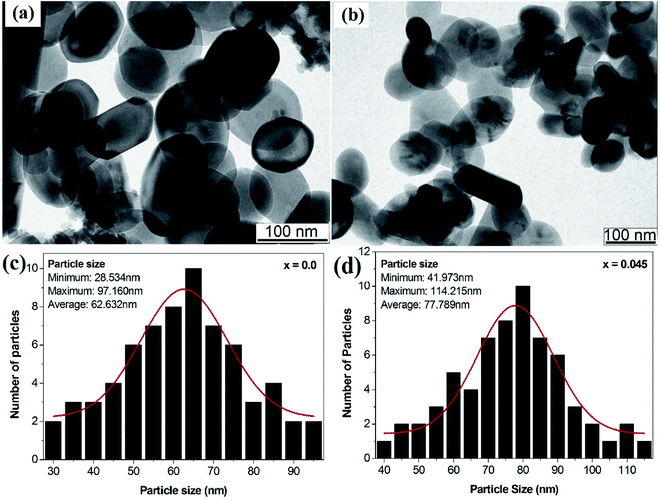 |
| | Fig. 5 (a) TEM image of the x = 0.0 sample, (b) TEM image of the x = 0.045 sample, and (c) histogram of the particle size distribution for the x = 0.0 sample and (d) histogram of the particle size distribution for the x = 0.045 sample of the Co0.4Cu0.1Zn0.5DyxFe2−xO4 ferrites. | |
Elastic properties
Infrared spectra spanning wavenumbers of 300–800 cm−1 were obtained for the Co0.4Cu0.1Zn0.5DyxFe2−xO4 samples (Fig. 6). The vibration bands observed in the vicinity of νA ∼ 585 cm−1 and νB ∼ 375 cm−1 were related to the stretching vibrations of metal ion and oxygen bond at the A and B sites, respectively, which confirmed that the powders crystallized in the cubic spinel structure.35
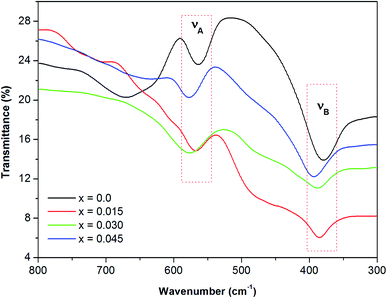 |
| | Fig. 6 Infrared spectra of all of the investigated samples of the Co0.4Cu0.1Zn0.5DyxFe2−xO4 ferrites. | |
For the present series, νA and νB varied with the Dy3+ ions substitution in Co0.4Cu0.1Zn0.5Fe2O4 (Table 2). The insertion of Dy3+ ions was seen to shift νA and νB slightly towards higher frequencies. This shifting of absorption bands was ascribed to the crystallite size35 and cation occupancy. The force constant of the A site, denoted as KT, and that of the B site, denoted as KO, were estimated by employing relationships discussed elsewhere.36 KT and KO were computed by using the positions of the high- and low-frequency bands νA and νB and are presented in Table 2. The average force constant was obtained using the expression Kav = (KO + KT)/2, and the values are given in Table 2.
Table 2 Band positions (νA and νB), force constants (KT, KO and Kav), elastic parameters such as stiffness constant (C11), longitudinal wave velocity (Vl), transverse wave velocity (Vt), bulk modulus (B), rigidity modulus (G), Poisson's ratio (σ), Young's modulus (E), mean wave velocity (Vm) and Debye temperatures (θD) obtained using the Waldron and Anderson methods for Co0.4Cu0.1Zn0.5DyxFe2−xO4
| Comp. ‘x’ |
0.0 |
0.015 |
0.030 |
0.045 |
| νA (cm−1) |
564.19 |
567.08 |
575.76 |
577.69 |
| νB (cm−1) |
379.02 |
384.81 |
387.70 |
393.49 |
| KT (×105 dynes per cm) |
195.49 |
198.81 |
206.29 |
209.03 |
| KO (×105 dynes per cm) |
120.30 |
124.84 |
127.58 |
132.29 |
| Kav (×105 dynes per cm−1) |
157.90 |
161.82 |
166.93 |
170.66 |
| C11 (GPa) |
189.32 |
192.30 |
196.32 |
199.72 |
| Vl (m s−1) |
5889.60 |
5996.52 |
6133.83 |
6211.11 |
| Vt (m s−1) |
3400.36 |
3462.09 |
3541.37 |
3585.99 |
| B (GPa) |
189.32 |
192.30 |
196.32 |
199.72 |
| G (GPa) |
63.11 |
64.10 |
65.44 |
66.57 |
| σ |
0.35 |
0.35 |
0.35 |
0.35 |
| E (GPa) |
170.39 |
173.07 |
176.69 |
179.75 |
| Vm (m s−1) |
3775.04 |
3843.58 |
3931.59 |
3981.13 |
| ΘD (K) (Waldron) |
678.17 |
684.41 |
692.73 |
698.28 |
| θD (K) (Anderson) |
539.17 |
544.03 |
550.72 |
554.97 |
Force constants obtained from infrared spectra and the crystallographic parameters were used to calculate the stiffness constant and various elastic parameters. According to Waldron,35 stiffness constant C11 = C12 for the materials possessing the cubic spinel crystal structure and is given by the equation C11 = Kav/a. Various elasticity parameters such as rigidity modulus G, bulk modulus B, Young's modulus E, longitudinal wave velocity Vl, transverse wave velocity Vt, mean wave velocity Vm and Poisson's ratio σ were calculated by using the relationships37
| |
 | (7) |
| |
 | (11) |
and
| |
 | (13) |
The changes in the various elasticity parameters and modulus with Dy3+ being substituted into the Co–Cu–Zn ferrite system are presented in Table 2. Stiffness constant C11 and all elastic moduli (B, G, and E) increased with the addition of Dy3+ ions into the Co–Cu–Zn ferrites. Poisson's constant was indeed constant (σ = 0.35) for all of the investigated compositions. According to isotropic elasticity theory35,38,39 and literature reports, Poisson's ratio must be in the range −1 to 0.5 in order to achieve good elastic behaviour. In general, elastic moduli values are related to the interionic bonding. As suggested by A. Bhaskar,40 strong bonding between the ions would enhance the values of the elastic moduli. In the present case, the increasing values of the elastic moduli with the addition of Dy3+ ions could ascribed to the increasing interatomic bonding between the ions of the Dy3+-substituted Co–Cu–Zn ferrites.
Debye temperatures (θD) values of all of the investigated compositions were estimated from the relationship suggested by Anderson,41 namely
| |
 | (14) |
where
k and
h are Boltzmann's and Planck's constants, respectively,
NA is Avogadro's number,
n is the number of atoms per unit cell (for cubic spinel,
n = 8),
ρ denotes density,
Vm is the mean wave velocity, and
M is the molecular weight. The Debye temperature can also be obtained by using the relationship suggested by Waldron,
35 namely
| |
 | (15) |
where
νav is the average of the absorption bands (
νA,
νB) and is given by
νav = (
νA +
νB)/2. Both values of Debye temperatures obtained from the relationships suggested by Anderson and Waldron are given in
Table 2. Addition of Dy
3+ ions increased
θD from 539.17 to 554.97 K and
ΘD from 678.17 to 698.28 K. The change in Debye temperature may be understood based on the theory of specific heat.
42 Increasing P-type conduction in the materials may have increased the Debye temperature. Also, the increased rigidity of the Dy
3+-doped Co–Cu–Zn ferrites may have contributed to its increased Debye temperature.
The elastic moduli (B, G and E) are not reliable unless the correction made to the zero porosity, which can be obtained by the void fraction (P) using the Hosselmann and Fulrath formula40
| |
 | (16) |
| |
 | (17) |
| |
 | (18) |
and
| |
 | (19) |
Void-free corrected values of Poisson's ratio (σ0), rigidity modulus (G0), Young's modulus (E0) and bulk modulus (B0) are presented in Table 3. All of these elastic moduli of Co–Cu–Zn ferrites tended to increase with the increasing amount of substituted Dy3+ ions, consistent with above-described corresponding strengthening of the bonding between the corresponding ions.
Table 3 Void-free corrected values of elastic parameters, including Poisson's ratio (σ0), rigidity modulus (G0), Young's modulus (E0) and bulk modulus (B0), for Co0.4Cu0.1Zn0.5DyxFe2−xO4
| Comp. ‘x’ |
0.0 |
0.015 |
0.030 |
0.045 |
| E0 (GPa) |
198.07 |
203.55 |
210.27 |
216.48 |
| G0 (GPa) |
72.54 |
74.47 |
76.86 |
79.05 |
| B0 (GPa) |
254.08 |
254.29 |
265.30 |
275.95 |
| σ0 |
0.365 |
0.367 |
0.368 |
0.369 |
Magnetic properties
In general, three magnetic interactions such as A–A, A–B and B–B take place between the cations and neighboring anions in spinel ferrites through a super-exchange mechanism. The strengths of the energies of interaction between the magnetic ions (MeI and MeII) are related to the cation–anion bond lengths and the MeI–O–MeII angle (θ). Apparently, in general, the length of the A–B bond is less than that of the A–A bond. Thus, an A–B super-exchange interaction would be stronger than A–A and B–B super-exchange interactions. The maximum angle θ of 180° connecting the cations would result in the highest interaction energy. The cation–anion (MeI–O) (p, q, r, and s) and cation–cation (MeI–MeII) (b, c, d, e, and f) interionic distances, and bond angles (θ1, θ2, θ3, θ4, and θ5) for the cations and cation–anion, were determined by using the equations listed in Table 4.43 Fig. 7a–c show that the cation distances, MeI–MeII, increased with an increasing amount of Dy substituted in the Co–Cu–Zn ferrite. In the case of distances between the cation and anion, namely MeI–O, P and S increased whereas Q and R decreased with an increasing amount of Dy substituted. The substitution of larger Dy3+ ions for Fe3+ ions at the BO6 octahedral site resulted in an increased bond length. As shown Fig. 7c, the angles associated with the A–B interaction (θ1 and θ2) increased, those associated with the B–B interaction (θ3 and θ4) decreased, and that associated with the A–A interaction (θ5) increased by small margin with an increasing amount of Dy3+ substituted. The variation in bond angles revealed that A–O–B interaction, which governs the magnetization in the system, strengthened with an increasing amount of Dy ions substituted. Such a change should increase the magnetization levels of the Co–Cu–Zn ferrites. Thus magnetic properties were investigated by employing VSM with a peak field strength of 5 kOe. Fig. 8a presents the magnetic hysteresis loops obtained from our system; these loops clearly indicated that the saturation magnetization (Ms) increased with increases in Dy3+ concentration. The RE-Dy3+ ions showed a greater magnetic moment (10.48 μB) compared to that of Fe3+ (5 μB). The increased content of Dy3+ ions at the B sites increased the magnetization of these sites, which resulted in the increase in the Ms.
Table 4 Expressions for determining the interionic distances for the cation–cation (MeI–MeII (b, c, d, e, and f), cation–anion MeI–O (p, q, r, and s), and bond angles (θ1, θ2, θ3, θ4, and θ5)
| MeI–MeII |
MeI–O |
Bond angles |
 |
 |
 |
 |
 |
 |
 |
 |
 |
 |
 |
 |
 |
|
 |
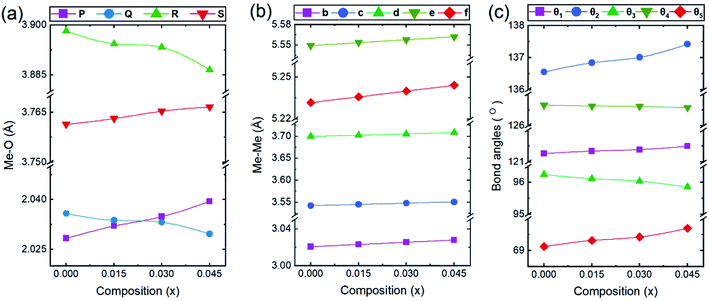 |
| | Fig. 7 The calculated values of (a and b) the interionic distances for the (a) cation–anion MeI–O (p, q, r, and s), (b) cation–cation MeI–MeII (b, c, d, e, and f), and (c) bond angles (θ1, θ2, θ3, θ4, and θ5). | |
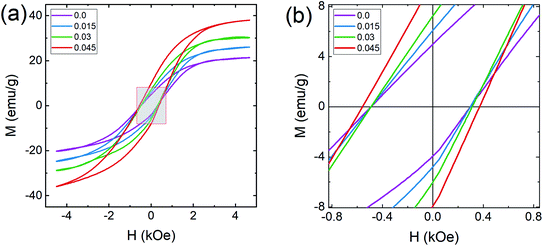 |
| | Fig. 8 Magnetization curves of Co0.4Cu0.1Zn0.5DyxFe2−xO4. (a) Magnetization (M) as a function of applied magnetic field (H) and (b) expanded view of the M–H plots at low applied magnetic field strengths. | |
Coercivity (Hc) is generally governed by the magneto-crystalline anisotropy constant (K1), permeability (μO) and Ms through the Brown relationship44
| |
 | (20) |
The coercivity value is independent of Ms and can be controlled by heat treatment or structural deformation. Values of Ms, Hc, remnant magnetization (Mr) and remanence ratio (R = Mr/Ms), each as a function of the relative amount of Dy3+ substituted, are shown in Fig. 9a–d. As shown in Fig. 8b and 9c, Hc increased with increasing amount Dy3+ substituted. An increased Hc is in general directly related to the higher K1 of rare earth ions such as Dy.
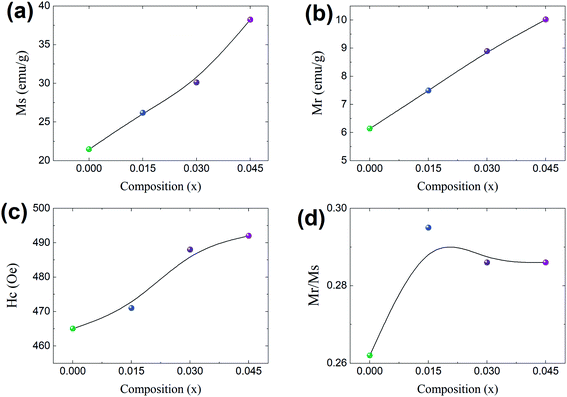 |
| | Fig. 9 Co0.4Cu0.1Zn0.5DyxFe2−xO4 magnetism properties each as a function of Dy composition (x). (a) Magnetization (Ms), (b) remnant magnetization (Mr), (c) coercivity (Hc), and (d) the remnant ratio Mr/Ms. | |
In general, cation distribution, particle sizes and magnetic moments of the cations are the major parameters affecting magnetic properties. However, oxygen vacancies and variation in the valence state of Fe, namely between Fe3+ and Fe2+, can also influence the magnetic properties.10 However, in the present case, all of the materials were sintered in an air atmosphere and thus the possibility of having oxygen vacancies can be neglected. Secondly, the Dy and Fe ions in the materials used had the same valence state of 3+. Considering these factors, a change in the valence state between Fe3+ and Fe2+ can be ignored in the present work, though it can be studied in the future using XPS.
Dielectric measurements
The dielectric constant (ε′) was obtained using a cylindrical ferrite pellet sample and the relationship| |
 | (21) |
where d is the pellet thickness, Cp is the capacitance, A is the area of pellet surface and ε0 is the permittivity of free space. Fig. 10a and b show dielectric constant (ε′) and dielectric loss tangent (tan![[thin space (1/6-em)]](https://www.rsc.org/images/entities/char_2009.gif) δ) values, each as a function of frequency. These two values decreased with increasing frequency, confirming the dispersion at lower frequency.45 The dispersion and higher value of ε′ at low frequency may be ascribed to the grain heterogeneity of material.46 The change in dielectric dispersion can be understood via the Maxwell–Wagner model47,48 and Koop's49 phenomenological theory. The exchange of 3d orbital electrons between Fe2+ and Fe3+ can be localized at the metal ions, resulting in a local shift of electrons (e−) toward the direction of the applied electric field and helping to determine the polarization strength. The variation in ε′ and tan
δ) values, each as a function of frequency. These two values decreased with increasing frequency, confirming the dispersion at lower frequency.45 The dispersion and higher value of ε′ at low frequency may be ascribed to the grain heterogeneity of material.46 The change in dielectric dispersion can be understood via the Maxwell–Wagner model47,48 and Koop's49 phenomenological theory. The exchange of 3d orbital electrons between Fe2+ and Fe3+ can be localized at the metal ions, resulting in a local shift of electrons (e−) toward the direction of the applied electric field and helping to determine the polarization strength. The variation in ε′ and tan![[thin space (1/6-em)]](https://www.rsc.org/images/entities/char_2009.gif) δ at low frequency may also be related to the ‘grain-boundary-induced high resistivity’. Thus more energy is needed at the low-frequency region for the exchange of electrons between Fe2+ and Fe3+ ions, which gives higher values of ε′ and tan
δ at low frequency may also be related to the ‘grain-boundary-induced high resistivity’. Thus more energy is needed at the low-frequency region for the exchange of electrons between Fe2+ and Fe3+ ions, which gives higher values of ε′ and tan![[thin space (1/6-em)]](https://www.rsc.org/images/entities/char_2009.gif) δ. In contrast, at the higher-frequency region, dispersion is related to ‘grain-induced lower resistivity’. Thus, less energy is needed for inter-cation electron exchange. Furthermore, a higher tan
δ. In contrast, at the higher-frequency region, dispersion is related to ‘grain-induced lower resistivity’. Thus, less energy is needed for inter-cation electron exchange. Furthermore, a higher tan![[thin space (1/6-em)]](https://www.rsc.org/images/entities/char_2009.gif) δ at lower frequency may be related to crystal defects, impurities and moisture. The conduction of Cu2+, Co2+, Zn2+ with Fe3+ ions at the B site is possible through following mechanisms:
δ at lower frequency may be related to crystal defects, impurities and moisture. The conduction of Cu2+, Co2+, Zn2+ with Fe3+ ions at the B site is possible through following mechanisms:| | |
Fe3+ + Cu2+ ↔ Fe2+ + Cu3+
| (22) |
| | |
Fe3+ + Zn2+ ↔ Fe2+ + Zn3+
| (23) |
| | |
Fe3+ + Co2+ ↔ Fe2+ + Co3+
| (24) |
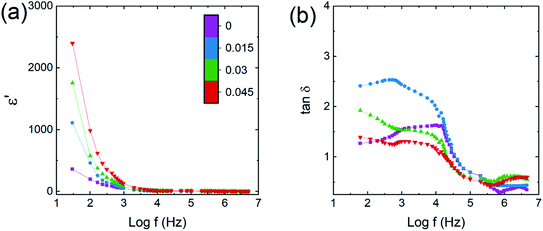 |
| | Fig. 10 Co0.4Cu0.1Zn0.5DyxFe2−xO4 dielectric parameters, each as a function of logarithm of frequency (f). (a) Real part of dielectric constant (ε′) and (b) dielectric loss tangent (tan![[thin space (1/6-em)]](https://www.rsc.org/images/entities/char_2009.gif) δ). δ). | |
The value of tan![[thin space (1/6-em)]](https://www.rsc.org/images/entities/char_2009.gif) δ reflects the energy loss within a material and it appears whenever polarization does not follow the applied alternating field. A broad relaxation-related hump in each of the tan
δ reflects the energy loss within a material and it appears whenever polarization does not follow the applied alternating field. A broad relaxation-related hump in each of the tan![[thin space (1/6-em)]](https://www.rsc.org/images/entities/char_2009.gif) δ plots was observed (Fig. 10b) and can be understood based on the Rezlescu model.50 The condition for a broad hump in the tan
δ plots was observed (Fig. 10b) and can be understood based on the Rezlescu model.50 The condition for a broad hump in the tan![[thin space (1/6-em)]](https://www.rsc.org/images/entities/char_2009.gif) δ of a dielectric material is related to the equation
δ of a dielectric material is related to the equation
where
τ is the relaxation time and
ω = 2π
fmax. The value of
τ is related to the jumping probability according to the relationship
| |
 | (26) |
or
Thus, a broad hump or maximum can be obtained as a result of frequency of charge hopping between cations perfectly coinciding with the frequency of the electric field. The Co–Cu–Zn ferrite samples with x = 0.045 showed the highest ε′ and lowest tan![[thin space (1/6-em)]](https://www.rsc.org/images/entities/char_2009.gif) δ.
δ.
The increase in ε′ for Co–Cu–Zn ferrite with increasing amount of Dy3+ substituted could be mainly related to the increase in grain size and decrease in conductivity. An increase in grain size would increase the probability of hopping occurring between Fe, Co and Cu ions, resulting in an enhancement in dielectric constant. On the other hand, an increase in grain size would decrease the resistivity of the materials because of the resulting fewer grain boundaries, and that would also be beneficial for enhancing the dielectric constant and decreasing the dielectric loss tangent.
Conclusions
Single-phase cubic spinel structured Co0.4Cu0.1Zn0.5DyxFe2−xO4 nanoparticles were successfully prepared using the sol–gel autocombustion route. The Dy substitution resulted in an increase in tensile strain in the materials from 3.1 (x = 0.0) to 4.3 × 10⁻⁴ (x = 0.045), consistent with the lattice length having increased from 8.340 to 8.545 Å. The average crystallite size increased from 39.5 to 41 nm with the Dy substitution. Zn2+ ions occupied the A site only; Co2+ and Dy3+ occupied the B site whereas Cu2+ and Fe3+ occupied both crystallographic sites. Force constants, elastic parameters and Debye temperatures increased with Dy substitution. Increases in grain size, magnetocrystalline anisotropy, and 4f–3d couplings and strengthening of the A–B interaction with the Dy substitution resulted in increases in all of the magnetic properties. Saturation magnetization increased from 21 to 38 emu g−1 whereas coercivity increased from 480 to 560 Oe with the increase in Dy substitution. The enhancement in saturation magnetization was also related to the higher magnetic moment of Dy ions compared to that of Fe ions. The dielectric constant increased from 355 to 2400, and dielectric loss also slightly decreased, when Dy was included. This ability to modify the magnetic properties of the prepared material makes it a suitable candidate for magnetic recording media.
Conflicts of interest
All the authors declare no conflict of interest.
Acknowledgements
Author RHK thanks Dr Babasaheb Ambedkar Marathwada University, Aurangabad (M.S.) for providing financial assistance under the minor research project scheme vide letter No. STAT/VI/R.G./College/2018-19/3184-85 dated 21.02.2019. Author K. M. Batoo is grateful for the Researchers Supporting Project (RSP-2020/148) at King Saud University for their financial support.
References
- S. E. Shirsath, D. Wang, S. S. Jadhav, M. L. Mane and S. Li, Ferrites obtained by sol-gel method, in Handbook of Sol-Gel Science and Technology, ed. L. Klein, M. Aparicio and A. Jitianu, Springer, Cham, 2018, pp. 695–735 Search PubMed.
- H. Kaur, A. Singh, V. Kumar and D. S. Ahlawat, Structural, thermal and magnetic investigations of cobalt ferrite doped with Zn2+ and Cd2+ synthesized by auto combustion method, J. Magn. Magn. Mater., 2019, 474, 505–511 CrossRef CAS.
- G. Mustafa, M. U. Islam, W. Zhang, Y. Jamil, A. W. Anwar, M. Hussain and M. Ahmad, Investigation of structural and magnetic properties of Ce3+ substituted nanosized Co–Cr ferrites for variety of applications, J. Alloys Compd., 2015, 618, 428 CrossRef CAS.
- A. Goldman, Modern Ferrite Technology, 2nd edn, Springer, 2006 Search PubMed.
- P. Jadoun, J. Sharma, S. Kumar, S. N. Dolia, D. Bhatnagar and V. K. Saxena, Structural and magnetic behavior of nanocrystalline Cr doped Co–Mg ferrite, Ceram. Int., 2018, 44, 6747 CrossRef CAS.
- S. E. Shirsath, R. H. Kadam, M. L. Mane, A. Ghesami, Y. Yasukawa, X. Liu and A. Morisako, Permeability and magnetic interactions in Co2+ substituted Li0.5Fe2.5O4 alloys, J. Alloys Compd., 2013, 575, 145–151 CrossRef CAS.
- M. A. Amer, T. M. Meaz, A. G. Mostafa and H. F. El-Ghazally, Annealing effect on the structural and magnetic properties of the CuAl0.6Cr0.2Fe1.2O4 nano-ferrites, Mater. Res. Bull., 2015, 67, 207 CrossRef CAS.
- C. N. R. Rao, P. J. Thoma and G. U. Kulkarni, Nanocrystals: Synthesis, Properties and Applications, Springer-Verlag, Berlin Hiedelberg, 2007 Search PubMed.
- W. S. Mohamed, M. Alzaid, M. S. M. Abdelbaky, Z. Amghouz, S. García-Granda and A. M. Abu-Dief, Impact of Co2+ Substitution on Microstructure and Magnetic Properties of CoxZn1-xFe2O4 Nanoparticles, Nanomaterials, 2019, 9(11), 1602 CrossRef CAS PubMed.
- S. E. Shirsath, X. Liu, Y. Yasukawa, S. Li and A. Morisako, Switching of magnetic easy-axis using crystal orientation for large perpendicular coercivity in CoFe2O4 thin films, Sci. Rep., 2016, 6, 30074 CrossRef CAS PubMed.
- S. E. Shirsath, X. Liu, M. H. N. Assadi, A. Younis, Y. Yasukawa, S. Kumar Karan, J. Zhang, J. Kim, D. Wang, A. Morisako, Y. Yamauchi and S. Li, Au quantum dots engineered room temperature crystallization and magnetic anisotropy in CoFe2O4 thin films, Nanoscale Horiz., 2019, 4, 434–444 RSC.
- D. R. Mane, D. D. Birajdar, S. Patil, S. E. Shirsath and R. H. Kadam, Redistribution of cations and enhancement in magnetic properties of sol-gel synthesized Cu0.7-xCoxZn0.3Fe2O4 (0 < x < 0.5), J. Sol. Gel Sci. Technol., 2011, 58, 70 CrossRef CAS.
- M. Hashim, S. K. Alimuddin, B. H. Koo, S. E. Shirsath, E. M. Mohammed, J. Shah, R. K. Kotnala, H. K. Choi, H. Chung and R. Kumar, Structural, electrical and magnetic properties of Co-Cu ferrite nanoparticles, J. Alloys Compd., 2012, 518, 11–18 CrossRef CAS.
- W. S. Mohamed and A. M. Abu-Dief, Impact of rare earth europium (RE-Eu3+) ions substitution on microstructural, optical and magnetic properties of CoFe2−xEuxO4 nanosystems, Ceram. Int., 2020, 46, 16196–16209 CrossRef CAS.
- S. R. Naik and A. V. Salker, Change in the magneto structural properties of rare earth doped cobalt ferrites relative to the magnetic anisotropy, J. Mater. Chem., 2012, 22, 2740–2750 RSC.
- S. E. Shirsath, R. H. Kadam, S. M. Patange, M. L. Mane, A. Ghasemi and A. Morisako, Enhanced magnetic properties of Dy3+ substituted Ni-Cu-Zn ferrite nanoparticles, Appl. Phys. Lett., 2012, 100, 042407 CrossRef.
- E. Rezlescu, N. Rezlescu, P. D. Mangeron, L. Rezlescu and C. Pasxick, The influence of R2O3 (R = Yb, Er, Dy, Tb, Gd, Sm, and Ce) on the electric and mechanical properties of a nickel–zinc ferrite, Phys. Status Solidi A, 1997, 162, 673 CrossRef CAS.
- S. E. Shirsath, S. S. Jadhav, B. G. Toksha, S. M. Patange and K. M. Jadhav, Remarkable influence of Ce4+ ions on the electronic conduction of Ni1-2xCexFe2O4, Scr. Mater., 2011, 64, 773–776 CrossRef CAS.
- M. A. Almessiere, Y. Slimani, A. D. Korkmaz, S. Güner, A. Baykal, S. E. Shirsath, I. Ercan and P. Kögerler, Sonochemical synthesis of Dy3+ substituted Mn0.5Zn0.5Fe2-xO4 nanoparticles: structural, magnetic and optical characterization, Ultrason. Sonochem., 2020, 61, 04836 CrossRef.
- M. Hashim, A. Ahmed, S. A. Ali, S. E. Shirsath, M. M. Ismail, R. Kumar, S. Kumar, S. S. Meena and D. Ravinder, Structural, optical, elastic and magnetic properties of Ce and Dy doped cobalt ferrite, J. Alloys Compd., 2020, 834, 155089 CrossRef CAS.
- M. V. Chaudhari, S. E. Shirsath, A. B. Kadam, R. H. Kadam, S. B. Shelke and D. R. Mane, Site occupancies of Co-Mg-Cr-Fe ions and their impact on the properties of Co0.5Mg0.5CrxFe2-xO4, J. Alloys Compd., 2013, 552, 443–450 CrossRef CAS.
- T. Tatarchuk, M. Myslin, I. Mironyuk, M. Bououdina, A. T. Pedziwiatr, R. Gargula, B. F. Bogacz and P. Kurzydlo, Synthesis, morphology, crystallite size and adsorption properties of nanostructured Mg-Zn ferrites with enhanced porous structure, J. Alloys Compd., 2020, 819, 152945 CrossRef CAS.
- B. D. Cullity, Introduction to Magnetic Materials, Addison-Wesley, Massachusetts, 1972 Search PubMed.
- R. H. Kadam, A. R. Biradar, M. L. Mane and S. E. Shirsath, Sol-gel autocombustion synthesis of Li3xMnFe2-xO4 and their characterization, J. Appl. Phys., 2012, 112, 043902 CrossRef.
- L. Weil, F. Bertaut and L. Bochirol, Propriétés magnétiques et structure de la phase quadratique du ferrite de cuivre, J. Phys. Radium, 1950, 11, 208 CrossRef CAS.
- K. B. Modi, S. J. Shah, C. R. Kathad, D. K. Sonigra, H. P. Parmar and K. M. Jadhav, On the relationship between structural – elastic properties of Co-Zn ferrites at 300 K, Adv. Mater. Res., 2016, 1141, 147 Search PubMed.
- K. J. Standley, Oxide magnetic materials, Clarendon Press, Oxford, 1972 Search PubMed.
- J. W. Vrewey and E. L. Heilmann, Physical properties and cation arrangement of oxides with spinel structures I. Cation arrangement in spinels, J. Chem. Phys., 1947, 15, 174–180 CrossRef.
- G. Fagherazzi and F. Garbassi, X-ray diffraction measurements of the cation distribution in spinel structures, J. Appl. Crystallogr., 1972, 5, 18–23 CrossRef CAS.
- R. H. Kadam, K. Desai, V. S. Shinde, M. Hashim and S. E. Shirsath, Influence of Gd3+ ions substitution on the MnCrFeO4 for their nanoparticle shape formation and magnetic properties, J. Alloys Compd., 2016, 657, 487–494 CrossRef CAS.
- R. Valenzuela, Magnetic ceramics, Cambridge University Press, 1994 Search PubMed.
- K. Parikh, R. V. Upadhyay, L. Belova and K. V. Rao, Ternary monodispersed Mn0.5Zn0.5Fe2O4 ferrite nanoparticles: preparation and magnetic characterization, Nanotechnology, 2006, 17, 5970–5975 CrossRef.
- T. K. Pathak, N. H. Vasoya, V. K. Lakhani and K. B. Modi, Structural and magnetic phase evolution study on needle-shaped nanoparticles of magnesium ferrite, Ceram. Int., 2010, 36, 275–281 CrossRef CAS.
- R. H. Kadam, S. T. Alone, M. L. Mane, A. R. Birajdar and S. E. Shirsath, Phase evaluation of Li+ substituted CoFe2O4 nanoparticles, their characterizations and magnetic properties, J. Magn. Magn. Mater., 2014, 355, 70 CrossRef CAS.
- R. Waldron, Infrared spectra of ferrites, Phys. Rev., 1955, 99, 1727 CrossRef CAS.
- A. A. Birajdar, S. E. Shirsath, R. H. Kadam, M. L. Mane and D. R. Mane, Permeability and magnetic properties of Al3+ substituted Ni0.7Zn0.3Fe2O4 nanoparticles, J. Appl. Phys., 2012, 112, 053908 CrossRef.
- D. Boukkeze, J. Massoudi, W. Hzez, M. Smari, A. Bougoffa, K. Khirouni, E. Dhahri and L. Bessais, Investigation of the structural, optical, elastic and electrical properties of spinel LiZn2Fe3O8 nanoparticles annealed at two distinct temperature, RSC Adv., 2019, 9, 40940 RSC.
- K. B. Modi, S. J. Shah, N. B. Pujara, T. K. Pathak, N. H. Vasoya and I. G. Jhala, Infrared spectral evolution, elastic, optical and thermodynamic properties study on mechanically milled Ni0.5Zn0.5Fe2O4 spinel ferrite, J. Mol. Struct., 2013, 1049, 250 CrossRef CAS.
- M. B. Mohamed and A. M. Wahba, Structural, magnetic and elastic properties of nanocrystalline Al-substituted Mn0.5Zn0.5Fe2O4 ferrite, Ceram. Int., 2014, 40, 11773 CrossRef CAS.
- A. Bhaskar and S. R. Murthy, Effect of sintering temperature on the elastic properties of Mn(1%) added MgCuZn ferrites, J. Magn. Magn. Mater., 2014, 355, 100 CrossRef CAS.
- R. S. Yadav, I. Kuritka, J. Havlica, M. Hnatko, C. Alexander, J. Masilko, L. Kalina, M. Hajduchova, J. Rusnak and V. Enev, Structural, magnetic, elastic, dielectric and electrical properties of hot-press sintered Co1-xZnxFe2O4 (x = 0.0, 0.5) spinel ferrite nanoparticles, J. Magn. Magn. Mater., 2018, 447, 48–57 CrossRef.
- S. A. Mazen, S. F. Mansour, E. Dhahri, H. M. Zaki and T. A. Elmosalami, The infrared absorption and dielectric properties of Li-Ga ferrite, J. Alloys Compd., 2009, 470, 294 CrossRef CAS.
- R. A. Pawar, S. M. Patange, A. R. Shitre, S. K. Gore, S. S. Jadhav and S. E. Shirsath, Crystal chemistry and single-phase synthesis of Gd3+ substituted Co-Zn ferrite nanoparticles for enhanced magnetic properties, RSC Adv., 2018, 8, 25258–25267 RSC.
- V. Choudhari, R. H. Kadam, M. L. Mane, S. E. Shirsath, A. B. Kadam and D. R. Mane, Effect of La3+ impurity on magnetic and electrical properties of Co-Cu-Cr-Fe nanoparticles, J. Nanosci. Nanotechnol., 2014, 14, 1–8 CrossRef.
- V. G. Patil, S. E. Shirsath, S. D. More, S. J. Shukla and K. M. Jadhav, Effect of zinc substitution on structural and elastic properties of cobalt ferrite, J. Alloys Compd., 2009, 488, 199 CrossRef CAS.
- M. B. Kothale, K. K. Patankar, S. L. Kadam, V. L. Mathe, A. V. Rao and B. K. Chougule, Dielectric behaviour and magnetoelectric effect in copper-cobalt ferrite + barium lead titanate composites, Mater. Chem. Phys., 2002, 78, 691 Search PubMed.
- J. C. Maxwell, Electricity Magnetism, Oxford University Press, Oxford, 1954, ch. 328, vol. 1 Search PubMed.
- K. W. Wagner, The distribution of relaxation times in typical dielectrics, Ann. Phys., 1973, 40, 817–819 Search PubMed.
- C. G. Koops, On the dispersion of resistivity and dielectric constant of some semiconductors at audiofrequencies, Phys. Rev., 1951, 83, 121 CrossRef CAS.
- N. Rezlescu and E. Rezlescu, Dielectric properties of copper containing ferrites, Phys. Status Solidi, 1974, 23, 575 CrossRef CAS.
|
| This journal is © The Royal Society of Chemistry 2020 |
Click here to see how this site uses Cookies. View our privacy policy here.  Open Access Article
 b,
M. L. Manec,
D. R. Maned,
K. M. Batooe and
Sagar E. Shirsath
 *fg
*fg
![[thin space (1/6-em)]](https://www.rsc.org/images/entities/char_2009.gif) :
:![[thin space (1/6-em)]](https://www.rsc.org/images/entities/char_2009.gif) 3. Liquid ammonia was slowly introduced into the solution in order to adjust the pH to be ≅7. Until a viscous gel formed, the whole mixture was continuously stirred at a constant temperature of 90 °C. After a self-ignition process was carried out, the burnt powders were sintered at 700 °C for 6 h and ground in order to obtain the desired fine nanoparticles.
3. Liquid ammonia was slowly introduced into the solution in order to adjust the pH to be ≅7. Until a viscous gel formed, the whole mixture was continuously stirred at a constant temperature of 90 °C. After a self-ignition process was carried out, the burnt powders were sintered at 700 °C for 6 h and ground in order to obtain the desired fine nanoparticles.
![[thin space (1/6-em)]](https://www.rsc.org/images/entities/char_2009.gif) :
:![[thin space (1/6-em)]](https://www.rsc.org/images/entities/char_2009.gif) 10. Magnetic characterization was carried out using a vibrating sample magnetometer and applying a magnetic field of up to 5 kOe. The dielectric behavior of the samples was investigated by first forming silver-pasted discs of them and then analyzing the discs by using a Hioki HiTESTER 3532-50.
10. Magnetic characterization was carried out using a vibrating sample magnetometer and applying a magnetic field of up to 5 kOe. The dielectric behavior of the samples was investigated by first forming silver-pasted discs of them and then analyzing the discs by using a Hioki HiTESTER 3532-50.![[3 with combining macron]](https://www.rsc.org/images/entities/char_0033_0304.gif) m.23 Neither any impurity nor a secondary phase was indicated from an analysis of the XRD patterns. Addition of Dy3+ ions shifted the peak positions of Co0.4Cu0.1Zn0.5Fe2O4 slightly towards the lower angles, as depicted in Fig. 1. The experimental lattice length aexp was computed by employing the equation21
m.23 Neither any impurity nor a secondary phase was indicated from an analysis of the XRD patterns. Addition of Dy3+ ions shifted the peak positions of Co0.4Cu0.1Zn0.5Fe2O4 slightly towards the lower angles, as depicted in Fig. 1. The experimental lattice length aexp was computed by employing the equation21  , where (h k l) are the Miller indices and d is the interplanar distance. As shown in Fig. 2a, the lattice length of Co0.4Cu0.1Zn0.5DyxFe2−xO4 increased from 8.340 to 8.545 Å with the substitution of Dy3+ ions. This change in aexp can be understood in terms of the ionic radii of the constituent ions, where Fe3+ ions of smaller ionic radii (0.67 Å) were replaced with Dy3+ ions of greater ionic radii (0.99 Å). The observed increase in aexp indicated the substitution of Dy3+ ions into Co0.4Cu0.1Zn0.5Fe2O4 possibly inducing tensile strain into the lattice by deforming it elastically.


![[thin space (1/6-em)]](https://www.rsc.org/images/entities/char_2009.gif) sin
sin![[thin space (1/6-em)]](https://www.rsc.org/images/entities/char_2009.gif) θ and β
θ and β![[thin space (1/6-em)]](https://www.rsc.org/images/entities/char_2009.gif) cos
cos![[thin space (1/6-em)]](https://www.rsc.org/images/entities/char_2009.gif) θ as shown in Fig. 3. Strain values are given in the inset of Fig. 3 and DW–H values for various Dy concentrations are shown in Fig. 2b. DW–H obtained from W–H plots were observed to range from 31.76 to 34.40 nm for the tested concentrations, and the strain values ranged from 3.133 × 10⁻⁴ to 4.344 × 10⁻⁴. Positive values of slope here indicated that the tensile type of strain induced on the lattice increased with the Dy substitution. The increase in tensile strain with Dy substitution was also consistent with the observed change in the lattice length described above.
θ as shown in Fig. 3. Strain values are given in the inset of Fig. 3 and DW–H values for various Dy concentrations are shown in Fig. 2b. DW–H obtained from W–H plots were observed to range from 31.76 to 34.40 nm for the tested concentrations, and the strain values ranged from 3.133 × 10⁻⁴ to 4.344 × 10⁻⁴. Positive values of slope here indicated that the tensile type of strain induced on the lattice increased with the Dy substitution. The increase in tensile strain with Dy substitution was also consistent with the observed change in the lattice length described above.
![[thin space (1/6-em)]](https://www.rsc.org/images/entities/char_2009.gif) cos
cos![[thin space (1/6-em)]](https://www.rsc.org/images/entities/char_2009.gif) θ), where C = 0.94 and λ = 1.5406 × 10⁻¹⁰ m. Addition of Dy3+ ions into Co–Cu–Zn ferrites increased the DXRD from 39.57 to 41.31 nm (Fig. 2b). The specific surface area (S) was computed by using the relationship24
θ), where C = 0.94 and λ = 1.5406 × 10⁻¹⁰ m. Addition of Dy3+ ions into Co–Cu–Zn ferrites increased the DXRD from 39.57 to 41.31 nm (Fig. 2b). The specific surface area (S) was computed by using the relationship24


![[thin space (1/6-em)]](https://www.rsc.org/images/entities/char_2009.gif) δ) values, each as a function of frequency. These two values decreased with increasing frequency, confirming the dispersion at lower frequency.45 The dispersion and higher value of ε′ at low frequency may be ascribed to the grain heterogeneity of material.46 The change in dielectric dispersion can be understood via the Maxwell–Wagner model47,48 and Koop's49 phenomenological theory. The exchange of 3d orbital electrons between Fe2+ and Fe3+ can be localized at the metal ions, resulting in a local shift of electrons (e−) toward the direction of the applied electric field and helping to determine the polarization strength. The variation in ε′ and tan
δ) values, each as a function of frequency. These two values decreased with increasing frequency, confirming the dispersion at lower frequency.45 The dispersion and higher value of ε′ at low frequency may be ascribed to the grain heterogeneity of material.46 The change in dielectric dispersion can be understood via the Maxwell–Wagner model47,48 and Koop's49 phenomenological theory. The exchange of 3d orbital electrons between Fe2+ and Fe3+ can be localized at the metal ions, resulting in a local shift of electrons (e−) toward the direction of the applied electric field and helping to determine the polarization strength. The variation in ε′ and tan![[thin space (1/6-em)]](https://www.rsc.org/images/entities/char_2009.gif) δ at low frequency may also be related to the ‘grain-boundary-induced high resistivity’. Thus more energy is needed at the low-frequency region for the exchange of electrons between Fe2+ and Fe3+ ions, which gives higher values of ε′ and tan
δ at low frequency may also be related to the ‘grain-boundary-induced high resistivity’. Thus more energy is needed at the low-frequency region for the exchange of electrons between Fe2+ and Fe3+ ions, which gives higher values of ε′ and tan![[thin space (1/6-em)]](https://www.rsc.org/images/entities/char_2009.gif) δ. In contrast, at the higher-frequency region, dispersion is related to ‘grain-induced lower resistivity’. Thus, less energy is needed for inter-cation electron exchange. Furthermore, a higher tan
δ. In contrast, at the higher-frequency region, dispersion is related to ‘grain-induced lower resistivity’. Thus, less energy is needed for inter-cation electron exchange. Furthermore, a higher tan![[thin space (1/6-em)]](https://www.rsc.org/images/entities/char_2009.gif) δ at lower frequency may be related to crystal defects, impurities and moisture. The conduction of Cu2+, Co2+, Zn2+ with Fe3+ ions at the B site is possible through following mechanisms:
δ at lower frequency may be related to crystal defects, impurities and moisture. The conduction of Cu2+, Co2+, Zn2+ with Fe3+ ions at the B site is possible through following mechanisms:
![[thin space (1/6-em)]](https://www.rsc.org/images/entities/char_2009.gif) δ).
δ).![[thin space (1/6-em)]](https://www.rsc.org/images/entities/char_2009.gif) δ reflects the energy loss within a material and it appears whenever polarization does not follow the applied alternating field. A broad relaxation-related hump in each of the tan
δ reflects the energy loss within a material and it appears whenever polarization does not follow the applied alternating field. A broad relaxation-related hump in each of the tan![[thin space (1/6-em)]](https://www.rsc.org/images/entities/char_2009.gif) δ plots was observed (Fig. 10b) and can be understood based on the Rezlescu model.50 The condition for a broad hump in the tan
δ plots was observed (Fig. 10b) and can be understood based on the Rezlescu model.50 The condition for a broad hump in the tan![[thin space (1/6-em)]](https://www.rsc.org/images/entities/char_2009.gif) δ of a dielectric material is related to the equation
δ of a dielectric material is related to the equation
![[thin space (1/6-em)]](https://www.rsc.org/images/entities/char_2009.gif) δ.
δ.


