 Open Access Article
Investigation of angiotensin-I-converting enzyme (ACE) inhibitory tri-peptides: a combination of 3D-QSAR and molecular docking simulations†
Fangfang Wang *a and
Bo Zhoub
aSchool of Life Science, Linyi University, Linyi, 276000, China. E-mail: yu100288@163.com
bState Key Laboratory of Functions and Applications of Medicinal Plants, College of Basic Medical, Guizhou Medical University, Guizhou, 550004, China
First published on 30th September 2020
Abstract
Angiotensin-I-converting enzyme (ACE) is a key enzyme in the regulation of peripheral blood pressure and electrolyte homeostasis. Therefore, ACE is considered as a promising target for treatment of hypertension. In the present work, in order to investigate the binding interactions between ACE and tri-peptides, three-dimensional quantitative structure–activity relationship (3D-QSAR) models using comparative molecular field analysis (CoMFA) and comparative molecular similarity indices analysis (CoMSIA) methods were developed. Three different alignment methods (template ligand-based, docking-based, and common scaffold-based) were employed to construct reliable 3D-QSAR models. Statistical parameters derived from the QSAR models indicated that the template ligand-based CoMFA (Rcv2 = 0.761, Rpred2 = 0.6257) and CoMSIA (Rcv2 = 0.757, Rpred2 = 0.6969) models were better than the other alignment-based models. In addition, molecular docking studies were carried out to predict the binding modes of the peptides to ACE. The peptide–enzyme interactions were consistent with the derived 3D contour maps. Overall, the insights gained from this study would offer theoretical references for understanding the mechanism of action of tri-peptides when binding to ACE and aid in the design of more potent tri-peptides.
1. Introduction
Research has proven that food proteins can act as a significant source of active peptides with antihypertensive, opioid, immunomodulation, antioxidative, antimicrobial, antithrombotic, antiamnestic, hypocholesterolemic, and other activities.1,2 Among these bioactive peptides, angiotensin I-converting enzyme (ACE) inhibitory peptides have been extensively studied for their capability to prevent hypertension, which has been estimated to affect one third of the western population.3 Therefore, ACE peptides can be applied as potent functional food additive and represent natural alternative to ACE inhibitor drugs.ACE is a peptidyl-dipeptidase that is activated by chloride and possesses broad in vitro substrate specificity.4 Studies indicate that ACE is widely distributed in mammalian tissues, such as vascular endothelial cells, absorptive epithelial, neuroepithelial, and male germinal cells et al.5,6 In addition, two distinct isoforms (the somatic and smaller testicular types) are generated from a single gene at alternative initiation sites.7 Generally, ACE can convert the biologically inactive angiotensin I to the potent vasoconstrictor and cardiovascular trophic factor angiotensin II,8–10 which possesses some actions, such as increasing arterial pressure, increasing sodium and fluid retention, enhancing sympathetic adrenergic function and causing cardiac and vascular remodeling. Evidences suggest that inhibition of ACE is considered to be a useful therapeutic method in the treatment of hypertension. Therefore, ACE has become a vital target in the development of drugs to control high blood pressure.
Up to now, a large number of potent and specific ACE inhibitors have been developed as orally drugs that were used in the treatment of hypertension.11 In 1977, Cushman et al.12 synthesized ACE inhibitor captopril for the first time. Since the drug was approved for use in 1981, the role of ACE inhibitors in the clinical treatment of hypertension has been generally recognized by the medical community. The commonly used ACE inhibitors can be divided into two categories, thiol-containing (SH) group and non-thiol-containing (carboxyl, phosphoryl) group.13 The sulphydryl group-containing ACE inhibitor is captopril,14 the carboxyl group-containing ACE inhibitor includes benazeri, celazapril, enalapril, imidapril, lisinopril, perindopril, quinapril, ramipril, and trandolapril,15 and the phosphoryl-based ACE inhibitor mainly refers to fosinopril.16 However, these ACE inhibitors would give rise to several side effects, such as rapid absorption and excretion, cough, first dose hypotension, hyperkalemia, increased creatinine, kidney damage, and taste dysfunction, etc.17–20 To this end, researchers hope to find a safer alternative to antihypertensive drugs. Meanwhile, the food-derived ACE inhibitory peptide also exerts significant antihypertensive effect on hypertensive patients, but no antihypertensive effect on those patients with normal blood pressure. Researches have proven that the food-derived ACE inhibitory peptide possesses some advantages, such as easily absorbed, high safety, small toxic and side effects on normal kidneys and blood vessels. Therefore, ACE peptides will have good application prospects as antihypertensive drugs and health foods.21–23
The experimental approach to examine the relationship between activities and structures is time-consuming and laborious. An alternative method, before large experimental studies of peptides is to be considered, which can be used to draw on the advantage of previously found relationship between bioactivities and chemical structures. Quantitative structure–activity relationship (QSAR) analysis has been successfully used as a modelling and predictive tool for predicting the functional activity of peptides.24,25 Furthermore, QSAR methods are defined to find a series of quantitatively correlated relationship between the physical–chemical characteristics of compounds and the biological effects employing the theoretical calculation and statistical analyses. In addition, QSAR plays a significant role in drug design and medicinal chemistry, and it finds application in predicting the binding activity of novel compounds by mathematical expression.26,27
Several QSAR models have been constructed, namely multiple linear regression (MLR),28 artificial neural networks (ANN)29 and partial least squares regression (PLS),30 to screen a large amount of peptides efficiently and to predict the potential ACE inhibitory activities. In recent years, much attention has been paid to the discovery and synthesis of novel peptides with ACE inhibitory activity. Therefore, the objectives of this work are to (1) construct 3D-QSAR models to elucidate the relationship between the structure and activity of ACE tri-peptides; (2) further predict the activities of novel potent ACE inhibitory peptides based on the developed models.
2. Materials and methods
2.1 Data collection
For 3D-QSAR and molecular docking studies, a series of ACE tri-peptides with inhibitory activities (IC50) were compiled from researches.31–38 Initially, the structure of peptides was minimized by Tripos force field39 with Powell conjugate gradient descent method and the partial atomic charges were added using Gasteiger–Huckel method.40 Initially, the in vitro IC50 values were converted to the corresponding pIC50 values and are listed with their sequences in Table 1. Additionally, the data set was split into a training set to construct the quantitative models and a test set to test the performance of the derived 3D-QSAR models.| Compound | Structure | pIC50 |
|---|---|---|
| 1* | FEP | 1.08 |
| 2 | LKP | 0.60 |
| 3 | ALP | 2.38 |
| 4 | LRP | −0.57 |
| 5 | IEP | 0.20 |
| 6 | LAP | 0.54 |
| 7* | GRP | 1.30 |
| 8 | LSP | 0.23 |
| 9 | IAP | 0.43 |
| 10* | MNY | 1.82 |
| 11 | LEP | 0.28 |
| 12 | TNP | 2.32 |
| 13 | VSP | 1.00 |
| 14 | VLP | 1.91 |
| 15 | ILP | 1.51 |
| 16 | LNP | 1.76 |
| 17* | VGP | 1.42 |
| 18 | GKP | 2.55 |
| 19 | VYP | 2.46 |
| 20* | IKP | 0.84 |
| 21* | FAP | 0.58 |
| 22 | AVP | 2.53 |
| 23 | VRP | 0.34 |
| 24 | LYP | 0.82 |
| 25 | DLP | 0.68 |
| 26 | IRP | −0.13 |
| 27* | FQP | 1.08 |
| 28 | LQP | 0.28 |
| 29 | GEP | 2.51 |
| 30* | VMP | 1.46 |
2.2 Alignment of dataset
Molecular alignment is considered as the most critical step for constructing reliable 3D-QSAR models.41 In this work, three different alignment rules were employed: template ligand-based alignment, docking-based alignment, and common scaffold-based alignment.Template ligand-based alignment: all peptides in the training and test set were aligned to the most potent peptide 18 on the common substructure (Fig. 1A, depicted in blue), and the resulting alignment conformations are shown in Fig. 1B.
 | ||
| Fig. 1 (A) Structure of compound 18 used as a template for template ligand-based alignment; (B) the alignment for ACE from the template ligand-based alignment. | ||
Docking-based alignment: the conformation of each peptide was retrieved from molecular docking by considering orientation and scoring. The chosen conformation was added with Gasteiger–Huckel partial atomic charges, and the conformations were aligned together inside the receptor binding site (Fig. S1A†).
Common scaffold-based alignment: the process was the same as the template ligand-based alignment, the conformations were selected from molecular docking results, and the final alignment is shown in Fig. S1B.†
2.3 3D-QSAR studies
The 3D-QSAR models were developed using CoMFA and CoMSIA approaches. For CoMFA analysis, the standard steric and electrostatic fields were calculated in the cubic lattice by a sp3 hybridized carbon with a +1.0 charge and grid spacing of 2.0 Å. The cut off value and the column filtering was set to 30 kcal mol−1 and 2.0 kcal mol−1 respectively for both fields.42 In the case of CoMSIA analysis, five descriptors consisting of steric, electrostatic, hydrophobic, hydrogen bond donor, and hydrogen bond acceptor fields were calculated at each lattice by a sp3 carbon probe atom with a charge +1, hydrophobicity +1, and hydrogen bonding properties of +1, and the attenuation factor was set to 0.3.Partial least squares (PLS) is a mathematical tool that can be used to derive significant 3D-QSAR models. This approach is commonly employed to correlate biological activities to molecular structures through cross-validation and non-cross-validation. In the present work, leave-one-out (LOO) method was employed to perform a cross-validation analysis, in which one peptide is removed from the data set and its activity is predicted by the derived 3D-QSAR models, and the cross-validated correlation coefficient (Rcv2) and optimal number of components (Nc) were produced. In addition, non-cross-validation with a column filter value of 1.0 kcal mol−1 (using the optimal number of components) was then conducted to derive the final model, and the non-cross-validated correlation coefficient (Rncv2), standard error of estimation (SEE), and F-test value (F) were computed.
The test set of the peptides was employed to evaluate the robustness and statistical significance of the derived 3D-QSAR models.43 The predictive correlation coefficient (Rpred2) was calculated using the following formula:
| Rpred2 = (SD − PRESS)/SD |
2.4 Applicability domain analysis and MAE-based criteria validation
In order to validate the scientific reliability of the developed QSAR models, the applicability domain (AD) was calculated.44 The domain of applicability of compounds plays a significant role for estimating the uncertainty in the prediction of a specific compound based on how similar it is to the compounds employed to construct the model.45,46 Therefore, the prediction of the model using developed QSAR is valid only if the compound falls within the AD of the model. In addition, there are various approaches for determining AD of the QSAR models. An open access standalone application has been developed for the calculation of the AD, which can be accessed from the following link http://dtclab.webs.com/softwaretools or http://teqip.jdvu.ac.in/QSAR_Tools/. The AD can be easily employed for identification of outliers for the training compounds and detection of the test compounds locating outside the AD.Additionally, it has been shown that R2 based metrics for external validation may be misleading, purely error based measures like mean absolute error (MAE) can be employed to determine the quality of the predictions, which the standard deviation computed from the test set after removing 5% high residual data in order to obviate the influence of any rarely occurring high prediction errors. Therefore, in the present work, the online tool (XternalValidationPlus) (http://dtclab.webs.com/software-tools and http://teqip.jdvu.ac.in/QSAR_Tools/) was used to calculate the MAE based criteria for external validation.47
2.5 Molecular docking
In this work, AutoDock program48 was employed to comprehend the interactions between this series of peptides and the ACE receptor. The crystal structure of ACE (PDB code: 3BKK) was obtained from the RCSB Protein Data Bank (https://www.rcsb.org/). Before molecular docking, the receptor was prepared by removing all water molecules and ions, and polar hydrogen atoms and Kollman charges were added to the receptor. A grid box with spacing of 0.375 Å and 60 × 60 × 60 points were generated using the auxiliary program AutoGrid. The Lamarckian genetic algorithm and the pseudo-Solis and Wets methods were used for minimization applying default parameters. During molecular docking analysis, 100 conformations were defined for the peptides on the basis of dock score value, and the conformation with lowest binding energy was further chosen for model developing.Additionally, a redocking method was used to validate the accuracy of molecular docking. The bound ligand in the X-ray crystal structure was extracted and further docked into the binding site of the ACE receptor, and the root-mean-square deviation (RMSD) was 0.352, indicating that the procedure of molecular docking was dependable, and the parameters were applicable to this series of ACE peptides.
3. Results and discussion
3.1 3D-QSAR statistical results
The statistical results of the 3D-QSAR models are summarized in Table 2. The CoMFA model gives a cross-validated correlation coefficient (Rcv2) value of 0.761 with optimal number of principal components (Nc) value of 4, non-cross-validated correlation coefficient (Rncv2) of 0.953, standard error of estimate (SEE) of 0.243, and F value of 86.617. The corresponding steric and electrostatic contributions are 67.5% and 32.5%, respectively. In addition, the CoMSIA model shows a reliable Rcv2 of 0.757 and Nc of 6, high Rncv2 of 0.969 with relatively lower SEE of 0.210 and relatively higher F value of 78.174 in the final non-cross-validated model. The contribution of steric, electrostatic, hydrogen bond donor and hydrogen bond acceptor fields is 29.5%, 14.4%, 35.4% and 20.7%, respectively, indicating that the steric and hydrogen bond donor fields play significant roles in the optimal CoMSIA model. The above values suggest a good statistical correlation and a good internal predictive ability for the derived models.| Parameters | CoMFA | CoMSIA |
|---|---|---|
| a Rcv2 = cross-validated correlation coefficient using the leave-one-out methods; Rncv2 = non-cross-validated correlation coefficient; SEE = standard error of estimate; F = ratio of Rncv2 explained to unexplained = Rncv2/(1 − Rncv2); Rpred2 = predicted correlation coefficient for the test set of compounds; SEP = standard error of prediction; Nc = optimal number of principal components; S = steric, E = electrostatic, H = hydrophobic, D = H-bond donor, A = H-bond acceptor. | ||
| Rcv2 | 0.761 | 0.757 |
| Rncv2 | 0.953 | 0.969 |
| SEE | 0.243 | 0.210 |
| F | 86.617 | 78.174 |
| Rpred2 | 0.6257 | 0.6969 |
| SEP | 0.549 | 0.589 |
| Nc | 4 | 6 |
![[thin space (1/6-em)]](https://www.rsc.org/images/entities/char_2009.gif) |
||
| Field contribution | ||
| S | 0.675 | 0.295 |
| E | 0.325 | 0.144 |
| H | — | — |
| D | — | 0.354 |
| A | — | 0.207 |
To further validate the external predictive ability of the models, the activities of test set peptides were predicted. Both CoMFA and CoMISA models exhibited satisfactory results in term of the predictive correlation coefficient (Rpred2) of 0.6257 and 0.6969, respectively. In addition, the prediction errors of CoMFA and CoMSIA models in the form of a residual plot are clear at a glance in Fig. 2, the residual values of the test set are randomly distributed around zero, further indicating the good external predictive capacity of the models.
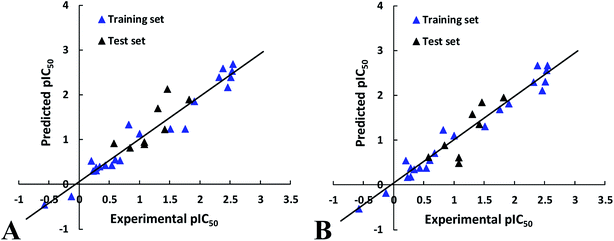 | ||
| Fig. 2 The correlation plots of the actual versus the predicted pIC50 values using the training set based on the CoMFA and CoMSIA models obtained from the activity for ACE. | ||
3.2 3D-QSAR contour map analysis
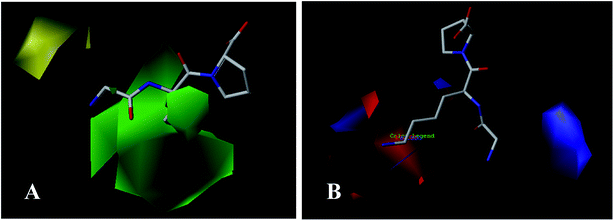
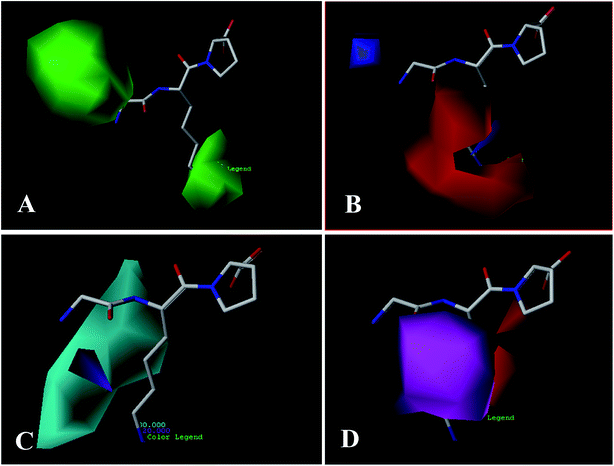
To facilitate understanding the effects of fields on binding activity in a structure-based manner, contour maps were generated by showing the regions in which the energy variations of the fields were consistent with changes in activities. Compound 18 as the most potent peptide was used as reference molecule to illustrate contour maps of the optimal models.For the electrostatic field, the blue and red regions represent the electropositive favorable and electronegative favorable properties, respectively. From Fig. 3B, the red (electronegative groups favored) and blue (electropositive groups favored) contour maps indicate the default 20% and 80% level contributions, respectively. There is a blue contour map covering the first amino acid (N-terminal), implies that connecting to the electropositive substituent is beneficial to the activity of the peptide. This can be proved by the comparison of compounds 15 (Ile) and 25 (Asp). As the electronegative group (Asp) connecting to the residue reduces the activity. A blue contour covering the second amino acid indicates the importance of electropositive groups in this region to the biological activity. Thus, peptide 20 with electropositive group Lys at this position exhibits higher activity than peptide 5 (electronegative residue Glu). Similarly, the order of the activity for peptides 18 (Lys) and 29 (Glu) (18 > 29) is indicative of the significance of an electropositive group at this location. In addition, some red contours located around the above blue contour show the importance of electronegative atoms in imparting better biological activity, for example, peptide 1 (Glu) shows a substantial increase in potency compared to peptide 21 (Ala). Also, the binding activity of peptide 11 (Glu) is more potent than peptide 4 (Arg).
For the hydrogen bond donor field (Fig. 4C), the cyan and purple regions represent the donor atoms favorable and unfavorable properties, respectively. A cyan region is observed around the –NH2 group of the first amino acid (N-terminal), suggesting that the hydrogen bond donor groups in this region are favorable for the activity. This is in consistent with all peptides, which possess –NH2 at the N-terminal. A purple contour is found close to –CO substitution of the peptide bond (–CO–NH), indicating hydrogen bond donor groups are unfavored. Furthermore, the substituents at the second amino acid (N-terminal) are surrounded by a large cyan contour, suggesting that hydrogen bond donor potential is preferred at this position. The higher activity of peptide 20 (Lys) than peptide 5 (Glu) is also in accordance with this conclusion.
Fig. 4D shows the hydrogen bond acceptor contour maps in CoMSIA analysis, respectively. These contour maps are shown in magenta (hydrogen bond acceptor groups are favorable) and red (hydrogen bond acceptor groups are unfavorable). One magenta contour map is located at the –CO group of the first peptide bond, indicating that the presence of hydrogen bond acceptor groups may be more suitable. Additionally, a red contour map near the second amino acid residue shows that the hydrogen bond acceptor moieties are unfavorable, which is in accord with the hydrogen bond donor contour maps.
3.3 AD analysis and MAE-based criteria validation
Analysis of the results from AD leads to conclude that on compounds in the training set and in the external test set were detected as the outliers, further indicating that the developed 3D-QSAR models (CoMFA and CoMSIA) are reliable, and the predicted inhibitory activity can be considered reliable only for those compounds that fall within the AD on which the model is constructed.The prediction errors for the test subset is defined as ‘good’ predictions as follows: MAE ≤ 0.1 × training set range and MAE + 3 × σ ≤ 0.2 × training set range. The MAE-based metrics (MAE < 0.1 × training set range and MAE + 3 × σ < 0.2 × training set range) for CoMFA and CoMSIA models are all estimated as “good”, further indicating that the developed models have high credibility.
3.4 Molecular docking analysis
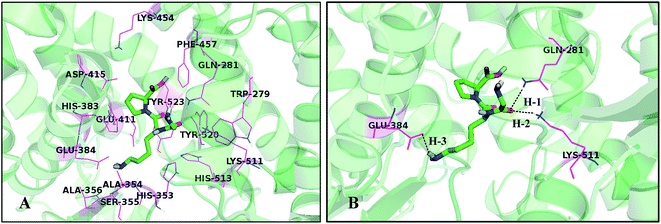
To investigate the probable binding mode between this series of peptides and the ACE receptor as well as to support the rational design of novel peptides, molecular docking study was performed and the results of the simulated peptides are shown in Fig. 5. Herein the most active peptide 18 is selected for more detailed analysis. Docking results demonstrate that peptide 18 is placed into a binding pocket lined by Trp279, Gln281, His353, Ala354, Ser355, Ala356, His383, Glu384, Glu411, Asp415, Lys454, Phe457, Lys511, His513, Tyr520, and Tyr523 residues (Fig. 5A). As depicted in Fig. 5B, the –CO group of the first peptide bond shows two hydrogen bonding interactions with residues Gln281 and Lys511 (–O⋯HN, 2.02 Å, 161.0°) (H-1), (–O⋯HN, 2.11 Å, 156.5°) (H-2), which is in consistence with CoMSIA hydrogen bond donor and acceptor contour maps. At the same time, one more hydrogen bond (–O⋯HN, 2.13 Å, 149.1°) (H-3) formed between the –NH2 positioned at the second amino acid and Glu384 may be favorable for further activity improvement. Furthermore, the cyan and red contour maps from CoMSIA model are fallen in a region close to the residue Glu384, which is considered as a hydrogen bond donor.It can be seen from Fig. 5B that the substituent at the first amino acid forms hydrogen bond with Gln281 and Lys511, indicating that the distance is closer to the surrounding residues, therefore, the substituents at this location cannot be too large, otherwise steric hindrance with the surrounding amino acids would be formed. This is in coincide with the yellow contour map (Fig. 3A). In addition, the substituents at the second amino acid are anchored in a huge pocket made by His353, His383, His387, Glu411 and Tyr523, illustrating that bulky groups are sterically favorable in this direction. This result is in concordance with the steric interactions shown in Fig. 3A and 4A. It is shown that the groups at the third amino acid, especially the pyrrolidine ring of proline, point almost outside the binding pocket, thus bulky substituents are favorable for the ligand–receptor interactions, which can be explained by the fact that the groups at this position are surrounded by the green region (Fig. 3A and 4A). Furthermore, Fig. 3B and 4B show a blue contour at the second amino acid, which is hydrogen bonded with electronegative amino acid Glu384, suggesting that electropositive groups are favorable.
Therefore, the obtained results from molecular docking and QSAR models are harmonious, further illustrating that the procedure of molecular docking is feasible and the developed QSAR models are reliable.
3.5 Analysis of different binding pose
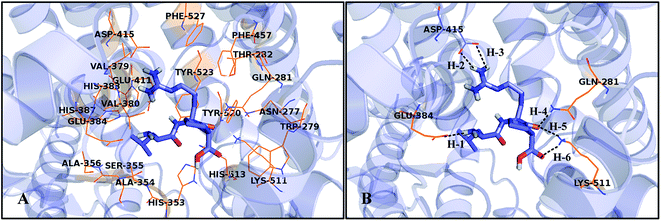
In order to illustrate the binding pose of this series of peptides to ACE and to predict specific binding interactions, the least active peptide 4 was also selected for analysis. The docked conformation of peptide 4 is shown in Fig. 6. Firstly, peptide 4 is bounded by a binding pocket consisting of residues Asn277, Trp279, Gln281, Thr282, His353, Ala354, Ser355, Ala356, Val379, Val380, His383, Glu384, His387, Glu411, Asp415, Phe457, Lys511, His513, Tyr520, Tyr523, and Phe527. Furthermore, peptide 4 binds to the receptor through some key hydrogen bond interactions: (1) between the –NH2 of the first amino acid and Glu384 (–O⋯HN, 1.81 Å, 161.5°) (H-1); (2) between the substituents at the second amino acid and residue Asp415 (–O⋯HN, 1.99 Å, 143.5°) (H-2), (–O⋯HN, 2.47 Å, 107.3°) (H-3); (3) between the third peptide bond and Gln281, Lys511 (–O⋯HN, 1.92 Å, 174.5°) (H-4), (–O⋯HN, 1.68 Å, 145.4°) (H-5); (4) between the –COOH group at the C-terminal and Lys511 (–O⋯HN, 2.05 Å, 138.1°) (H-6).Fig. 7 shows the docking mode of the most potent peptide 18 that aligned with peptide 4. First of all, the two peptides bind to the same site of the receptor. The substituents of peptide 4 at the N-terminal are aligned well to the groups of peptide 18. However, due to the differences in amino acid composition of the two peptides, their orientations at the receptor binding site are different, further resulting in differences in the binding activities of the two peptides. In particular, the substituents at the second amino acid and the third amino acid extend to different directions, thereby leading to unequal interactions with different amino acid residues, which is also the main reason for the different activities.
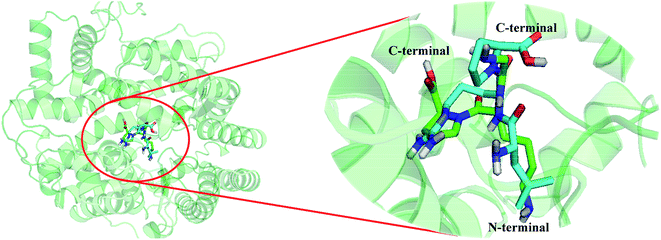 | ||
| Fig. 7 Structural superposition of 3BKK-18 and 3BKK-4. The projection highlights the structure of the active site with compound 18 (green) and 4 (cyan), which are displayed in sticks. | ||
3.6 Design novel peptides with ACE inhibitory activity
Based on the proposed CoMFA, CoMSIA, 3D-QSAR models and docking studies, five novel peptides have been designed to enhance the inhibitory activity (Table 3). These peptides were minimized and aligned to the database using peptide 18 as a template. These peptides shows higher inhibitory activities than the original potent compound.| No. | Structure | Predicted pIC50 (CoMFA model) | Predicted pIC50 (CoMSIA model) |
|---|---|---|---|
| 1 | RHW | 2.58 | 2.60 |
| 2 | RHY | 2.57 | 2.61 |
| 3 | KRW | 2.60 | 2.68 |
| 4 | KRH | 2.75 | 2.66 |
| 5 | HRW | 2.73 | 2.71 |
4. Conclusions
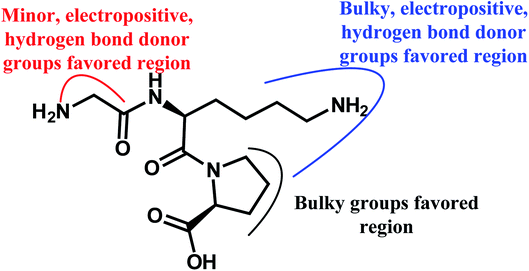
In the present work, 3D-QSAR models have been developed successfully with high Rcv2, Rncv2 and Rpred2 values suggesting the satisfying reliability and predictive ability. This is followed by molecular docking which would provide useful information to better understand the binding mode and produce the binding poses of this series of peptides into ACE receptor, in addition to confirming those suggested information from 3D-QSAR models. Overall findings are summarized as follows (Fig. 8):(1) Some key residues such as Gln281, Glu384, and Lys511 as well as hydrogen bonds between the selected peptide and the residues are found.
(2) Minor, electropositive, and hydrogen bond donor groups at the first amino acid benefit the activity of the dataset; bulky, electropositive and hydrogen bond donor groups at the second amino acid can increase the binding activity; bulky groups at the third amino acid are helpful to the activity, which can be validated by the results of molecular docking.
Overall, the above results would help us to better interpret the structure–activity relationship of the ACE tri-peptides and provide crucial information for lead optimization.
Conflicts of interest
The authors declare that there are no conflicts of interest.Acknowledgements
The study was supported by the National Natural Science Foundation of China (No. 32001699).References
- S. Arai, T. Osawa, H. Ohigashi, M. Yoshikawa, S. Kaminogawa, M. Watanabe, T. Ogawa, K. Okubo, S. Watanabe and H. Nishino, Biosci., Biotechnol., Biochem., 2001, 65, 1–13 CrossRef CAS.
- M. R. Zanutto-Elgui, J. C. S. Vieira, D. Z. D. Prado, M. A. R. Buzalaf, P. M. Padilha, D. Elgui de Oliveira and L. F. Fleuri, Food Chem., 2019, 278, 823–831 CrossRef CAS.
- R. López-Fandio, J. Otte and J. V. Camp, Int. Dairy J., 2006, 16, 1293 Search PubMed.
- R. J. Fitzgerald and B. A. Murray, Int. J. Dairy Technol., 2006, 59, 118–125 CrossRef CAS.
- A. R. Bourgonje, A. E. Abdulle and W. Timens, J. Pathol., 2020, 251, 228–248 CrossRef CAS.
- M. Bader and D. Ganten, J. Mol. Med., 2008, 86, 615–621 CrossRef CAS.
- P. S. Kessler, J. Biol. Chem., 2000, 275, 26259–26264 CrossRef.
- J. L. Lavoie and C. D. Sigmund, Endocrinology, 2003, 144, 2179–2183 CrossRef CAS.
- M. Semis, G. B. Gugiu, E. A. Bernstein, K. E. Bernstein and M. Kalkum, Anal. Chem., 2019, 91, 6440–6453 CAS.
- F. Soubrier, J. Clin. Invest., 2013, 123, 111–112 CrossRef CAS.
- C. C. Adarkwah and A. Gandjour, Int. J. Technol. Assess. Health Care, 2010, 26, 62 CrossRef.
- D. W. Cushman, H. S. Cheung, E. F. Sabo and M. A. Ondetti, Biochemistry, 1977, 16, 5484–5491 CrossRef CAS.
- Q. Li, A. Claiborne, T. Li, L. Hasvold, V. S. Stoll, S. Muchmore, C. G. Jakob, W. Gu, J. Cohen and C. Hutchins, Bioorg. Med. Chem. Lett., 2004, 14, 5367–5370 CrossRef CAS.
- J. S. Juggi, E. Koenig-Berard and W. H. V. Gilst, Can. J. Cardiol., 1993, 9, 336–352 CAS.
- T. E. Maclaughlan and A. T. Perez, US Pat., US 2004/0167108, 2003.
- C. Ionescu, G. Ismail, M. Rosu, O. Iliescu and A. M. Tutea, Hemodial. Int., 2003, 7, 73–104 CrossRef.
- G. Reboldi, G. Gentile, F. Angeli and P. Verdecchia, Expert Opin. Drug Metab. Toxicol., 2011, 7, 115–128 CrossRef CAS.
- P. A. V. Zwieten, Neth. Heart J., 2006, 14, 381 Search PubMed.
- L. Davin, P. Marechal, P. Lancellotti, C. Martinez, L. Pierard and R. Radermecker, Acta Cardiol., 2019, 74, 277–281 CrossRef.
- S. M. Jankovic, M. Dajic, S. Jacovic, S. Markovic, T. Papic, T. Petrusic, M. Radojkovic, A. Rankovic, M. Tanaskovic, M. Vasic, D. Vukicevic, R. Z. Zaric and M. Kostic, J. Patient Saf., 2019, 15, e28–e31 CrossRef.
- Y. Zheng, Y. Li and G. Li, RSC Adv., 2019, 9, 5925–5936 RSC.
- H. Wang, S. Zhang, S. Yan and Y. Dai, Int. J. Food Eng., 2013, 9, 1–8 CAS.
- L. C. Liu, H. U. Zhihe and J. Jia, Food Sci., 2007, 28, 585–589 CAS.
- A. Lupia, S. Mimmi, E. Iaccino, D. Maisano, F. Moraca, C. Talarico, E. Vecchio, G. Fiume, F. Ortuso, G. Scala, I. Quinto and S. Alcaro, Eur. J. Med. Chem., 2020, 185, 111838 CrossRef CAS.
- A. H. Pripp, T. Isaksson, L. Stepaniak, T. S. Rhaug and Y. Ard, Trends Food Sci. Technol., 2005, 16, 494 CrossRef.
- P. B. Sciences, L. J. M. University, Liverpool and UK, Int. J. Quant. Struct.-Prop. Relat., 2017, 2, 36–46 Search PubMed.
- A. C. Kontogiorgis, A. E. Pontiki and D. Hadjipavlou-Litina, Mini-Rev. Med. Chem., 2005, 5, 563–574 CrossRef CAS.
- Z. H. Lin, H. X. Long, Z. Bo, Y. Q. Wang and Y. Z. Wu, Peptides, 2008, 29, 1805 Search PubMed.
- H. Ronghai, M. Haile, Z. Weirui, Q. Wenjuan, Z. Jiewen, L. Lin and Z. Wenxue, Int. J. Pept., 2012, 2012, 1–9 Search PubMed.
- J. Tong, S. Liu, P. Zhou, B. Wu and Z. Li, J. Theor. Biol., 2008, 253, 90–97 CrossRef CAS.
- J. Wu, R. E. Aluko and S. Nakai, QSAR Comb. Sci., 2006, 25, 873–880 CrossRef CAS.
- J. Wu, R. E. Aluko and S. Nakai, J. Agric. Food Chem., 2006, 54, 732–738 CrossRef CAS.
- H. Iroyukifujita, K. Eiichiyokoyama and M. Yoshikawa, J. Food Sci., 2000, 65, 564–569 CrossRef.
- J. A. Gómez-Ruiz, I. Recio and J. Belloque, J. Agric. Food Chem., 2004, 52, 6315–6319 CrossRef.
- F. Hong, L. Ming, S. Yi, Z. Li, Y. Wu and L. Chi, Peptides, 2008, 29, 1071 CrossRef.
- J. Á. Gómez-Ruiz, G. Taborda, L. Amigo, I. Recio and M. Ramos, Eur. Food Res. Technol., 2006, 223, 595–601 CrossRef.
- G. Li, G. Le, Y. Shi and S. Shrestha, Nutr. Res., 2004, 24, 469–486 CrossRef CAS.
- K. G. M. Gouda, L. R. Gowda, A. G. A. Rao and V. Prakash, J. Agric. Food Chem., 2006, 54, 4568–4573 CrossRef CAS.
- M. Clark, R. D. Cramer and N. Van Opdenbosch, J. Comput. Chem., 1989, 10, 982–1012 CrossRef CAS.
- J. Gasteiger and M. Marsili, Tetrahedron, 1980, 36, 3219–3228 CrossRef CAS.
- S. J. Cho and A. Tropsha, J. Med. Chem., 1995, 38, 1060–1066 CrossRef CAS.
- R. D. Cramer, D. E. Patterson and J. D. Bunce, J. Am. Chem. Soc., 1988, 110, 5959–5967 CrossRef CAS.
- F. Wang and B. Zhou, Mol. Diversity, 2019 DOI:10.1007/s11030-019-10005-0.
- T. I. Netzeva, A. Worth, T. Aldenberg, R. Benigni, M. T. Cronin, P. Gramatica, J. S. Jaworska, S. Kahn, G. Klopman and C. A. Marchant, ATLA, Altern. Lab. Anim., 2005, 33, 155–173 CrossRef CAS.
- D. Gadaleta, G. F. Mangiatordi, M. Catto, A. Carotti and O. Nicolotti, Int. J. Quant. Struct.-Prop. Relat., 2016, 1, 45–63 Search PubMed.
- K. Roy, S. Kar and P. Ambure, Chemom. Intell. Lab. Syst., 2015, 145, 22–29 CrossRef CAS.
- K. Roy, R. N. Das, P. Ambure and R. B. Aher, Chemom. Intell. Lab. Syst., 2016, 18–33 CrossRef CAS.
- G. M. Morris, R. Huey, W. Lindstrom, M. F. Sanner and A. J. Olson, J. Comput. Chem., 2009, 30, 2785–2791 CrossRef CAS.
Footnote |
| † Electronic supplementary information (ESI) available. See DOI: 10.1039/d0ra05119e |
| This journal is © The Royal Society of Chemistry 2020 |

