DOI:
10.1039/D0RA05094F
(Paper)
RSC Adv., 2020,
10, 35153-35163
Hydrothermal synthesis and adsorption behavior of H4Ti5O12 nanorods along [100] as lithium ion-sieves†
Received
9th June 2020
, Accepted 12th September 2020
First published on 29th September 2020
Abstract
The adsorption method is a promising route to recover Li+ from waste lithium batteries and lithium-containing brines. To achieve this goal, it is vital to synthesize a stable and high adsorption capacity adsorbent. In this work, Li4Ti5O12 nanorods are prepared by two hydrothermal processes followed by a calcination process. Then the prepared Li4Ti5O12 nanorods are treated with different HCl concentrations to obtain a H4Ti5O12 adsorbent with 5 μm length along the [100] direction. The maximum amount of extracted lithium can reach 90% and the extracted titanium only 2.5%. The batch adsorption experiments indicate that the H4Ti5O12 nanorod maximum adsorption capacity can reach 23.20 mg g−1 in 24 mM LiCl solution. The adsorption isotherms and kinetics fit a Langmuir model and pseudo-second-order model, respectively. Meanwhile, the real adsorption selectivity experiments show that the maximum Li+ adsorption capacity reaches 1.99 mmol g−1, which is far higher than Mg2+ (0.03 mmol g−1) and Ca2+ (0.02 mmol g−1), implying these nanorods have higher adsorption selectivity for Li+ from Lagoco Salt Lake brine. The adsorption capacity for Li+ remains 91% after five cycles. With the help of XPS analyses, the adsorption mechanism of Li+ on the H4Ti5O12 nanorods is an ion exchange reaction. Therefore, this nanorod adsorbent has a potential application for Li+ recovery from aqueous lithium resources.
1. Introduction
Lithium, an indispensable metal, is widely used in medicines, spacecraft, ceramics, thermonuclear reaction, metallurgical engineering and so on.1–3 In recent years, the lithium supply has not satisfied the demands of the lithium battery market especially in battery consumption.4,5 Lithium resources mainly exist in ores and brines. According to a United States Geological Survey report, lithium resources in salt lakes account for 69% of the world's lithium reserves. So, recovery of lithium from brine has attracted great interest from researchers in recent years. However, it is a challenge to seek an environment-friendly, costless method to extract lithium from salt lakes.
Some methods including precipitation, solvent extraction,6 membrane separation,7 and adsorption,8–10 have been reported to recover lithium. Among these methods, adsorption has been recognized as one of the most promising methods for Li+ recovery owing to its high ion selectivity and environment-friendly properties.11,12 Usually, spinel lithium manganese oxides (LiMn2O4,13 Li1.33Mn1.67O4![[thin space (1/6-em)]](https://www.rsc.org/images/entities/char_2009.gif) 14 and Li1.6Mn1.6O4,15 lithium titanium oxides (Li2TiO3 and Li4Ti5O12) and LiCl·2Al(OH)3·xH2O have been used to recover lithium. Spinel lithium manganese oxides have been synthesized as the precursor for preparation lithium ion-sieves to recover Li+ in sea water and brines. However, serious Mn loss of lithium manganese oxides during the acid process impede their industrial application. Compared with lithium manganese oxides, lithium titanium oxides have good adsorption capacities and slight Ti loss in acid process. Li4Ti5O12 has the same spinel structure like Li1.33Mn1.67O4, which also has good adsorption capacity.16 The reason for low dissolution is that the titanium valence remains stably +4 during leaching and adsorption process. Furthermore, Li4Ti5O12 has well anti-acidic property and is suitable to extract lithium due to the Ti–O bond. Kaneko et al. investigated the effect of LiCl·2Al(OH)3·xH2O morphology on the Li+ adsorption behavior and presented the surface area was an important factor for adsorption process.17 Li et al. prepared yolk–shell structured Li4Ti5O12 to increase the surface area and the adsorption uptake can reached to 28.46 mg g−1 in 50 mM LiCl solution.18 Wei et al. recovered about 59.1 mg g−1 of lithium in 144 mM LiCl solution by using H4Ti5O12 as adsorbent.19 Li et al. also synthesized three-dimensionally H4Ti5O12 exhibited the high adsorption performance.16 So, the morphology and surface area have important factors to affect the adsorption behavior. According to the above H4Ti5O12 adsorbents, H4Ti5O12 has good adsorption performance and recycle stability. Considering that the nanowires and nanorods have similar one-dimensional structures, we believe that nanorods adsorbents have the similar surface area. However, research about the adsorption behavior of H4Ti5O12 nanorods has still not been reported.
14 and Li1.6Mn1.6O4,15 lithium titanium oxides (Li2TiO3 and Li4Ti5O12) and LiCl·2Al(OH)3·xH2O have been used to recover lithium. Spinel lithium manganese oxides have been synthesized as the precursor for preparation lithium ion-sieves to recover Li+ in sea water and brines. However, serious Mn loss of lithium manganese oxides during the acid process impede their industrial application. Compared with lithium manganese oxides, lithium titanium oxides have good adsorption capacities and slight Ti loss in acid process. Li4Ti5O12 has the same spinel structure like Li1.33Mn1.67O4, which also has good adsorption capacity.16 The reason for low dissolution is that the titanium valence remains stably +4 during leaching and adsorption process. Furthermore, Li4Ti5O12 has well anti-acidic property and is suitable to extract lithium due to the Ti–O bond. Kaneko et al. investigated the effect of LiCl·2Al(OH)3·xH2O morphology on the Li+ adsorption behavior and presented the surface area was an important factor for adsorption process.17 Li et al. prepared yolk–shell structured Li4Ti5O12 to increase the surface area and the adsorption uptake can reached to 28.46 mg g−1 in 50 mM LiCl solution.18 Wei et al. recovered about 59.1 mg g−1 of lithium in 144 mM LiCl solution by using H4Ti5O12 as adsorbent.19 Li et al. also synthesized three-dimensionally H4Ti5O12 exhibited the high adsorption performance.16 So, the morphology and surface area have important factors to affect the adsorption behavior. According to the above H4Ti5O12 adsorbents, H4Ti5O12 has good adsorption performance and recycle stability. Considering that the nanowires and nanorods have similar one-dimensional structures, we believe that nanorods adsorbents have the similar surface area. However, research about the adsorption behavior of H4Ti5O12 nanorods has still not been reported.
In this study, the Li4Ti5O12 nanorods was prepared by hydrothermal reaction followed by heat treatment in the air, and the H4Ti5O12 along [100] direction growth was obtained by acid treatment. The white samples were characterized by XRD, SEM, TEM, XPS, FTIR and TG. The batch adsorption experiments (such as pH value, adsorption temperatures, lithium concentrations, adsorption selectivity and recycle stability) of H4Ti5O12 nanorods were investigated. In addition, the H4Ti5O12 nanosheets was used to compare the influence of morphology on the Li+ adsorption performance. Meanwhile, the adsorption behaviors and ions selective properties from Lagoco Salt Lake brine were obtained. Meanwhile, the adsorption behaviors and ions selective properties from Lagoco Salt Lake brine were obtained. The possible adsorption mechanism of H4Ti5O12 nanorods was elaborated.
2. Experimental
2.1 Preparation of H4Ti5O12 nanorods
The Li4Ti5O12 nanorods was fabricated using two hydrothermal process followed by the calcined treatment. The synthesis process is modified from Li report.20 First, the 3.0 g anatase TiO2 was added to the 150 mL 10 M NaOH solution by stirring 1 h and sonicated for another 0.5 h. Then the above solution was transformed to Teflon-lined autoclave in 200 mL volume, and maintained for 48 h at 150 °C. When the autoclave was cooled to the room temperature, the white powder was collected by centrifugation, and washed with deionized water and 0.1 M HCl solution until the pH reached to neutral. After acid treatment, the 0.5 g titanium oxides were dispersed in a 40 mL 0.8 M LiOH aqueous solution. Then, the above solution was transformed to the autoclave and kept at 95 °C for 24 h. The obtained sample was washed with deionized water and ethanol for several times, the white sample was dried at 60 °C and calcined at 550 °C for 6 h to obtain Li4Ti5O12 nanorods. The H4Ti5O12 nanorods was prepared by the ion-exchanged methods. Briefly, the 0.1 g Li4Ti5O12 nanorods were added to the 10 mL 0.2 M HCl solution for 48 h to obtain the H4Ti5O12 nanorods. Then, the white sample washed by deionized water and ethanol for several times, and dried at 60 °C for 8 h. This acid process can be expresses by reaction (1) and the amount of extracted Li+ (aLi+) and the amount of extracted Ti4+ (aTi4+) are used to determine the extraction efficiency for lithium and the stability of lithium ionic sieve, which are calculated by eqn (2). The synthesized process of H4Ti5O12 nanorods is depicted in Scheme 1.| | |
Li4Ti5O12 + 4H+ = H4Ti5O12 + 4Li+
| (1) |
| |
 | (2) |
where Ct (mg L−1) is the concentration of Li+ (or Ti4+) in solution at random time, V (L) is the volume of the solution, and S (mg) is the mass of lithium or titanium in Li4Ti5O12 nanorods.
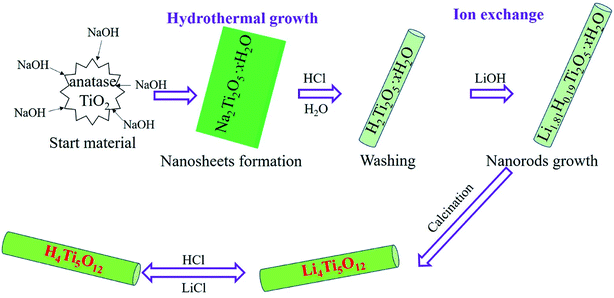 |
| | Scheme 1 Illustration of the synthesis procedure of H4Ti5O12 nanorods lithium ion sieves. | |
2.2 Li+ adsorption on the H4Ti5O12 nanorods
2.2.1 Li+ adsorption of H4Ti5O12 nanorods. The batch adsorption experiments were carried by adding 0.1 g adsorbent into 50 mL of different concentrations of Li+ solutions with a shaking speed of 150 rpm. The pH was adjusted by HCl (0.6 M) and KOH (5.0 M). The adsorption isotherms were investigated in 24 mM LiCl solutions at 25 °C, 35 °C and 45 °C for 4 h at pH 13. The adsorption kinetics were obtained in 12, 24 and 36 mM LiCl solutions at 25 °C for different times at pH 13. The adsorption capacity was calculated by eqn (3).| |
 | (3) |
2.2.2 Selectivity of H4Ti5O12 nanorods. The selectivity of H4Ti5O12 nanorods was carried by dispersing 0.1 g H4Ti5O12 into 50 mL 24 mM simulation solutions and real brine (Lagoco Salt Lake, Tibet) containing Li+, Na+, K+, Rb+, Cs+, Ca2+ and Mg2+. The concentrations of all metal ions were tested by ICP after the adsorption equilibrium. The Li+ selectivity is characterized by distribution coefficient (Kd) and separation factor (αLiM) as shown in eqn (4) and (5).| |
 | (4) |
| |
 | (5) |
The initial and equilibrium Li+ concentration is defined as C0 (mg L−1) and Ce (mg L−1), the volume of solution names V (L), m (g) is mass of adsorbent, αLiM is separation factors that means the Li to M ion (Na, K, Rb, Cs), respectively.
2.2.3 Recyclability of adsorbents. The reuse of H4Ti5O12 nanorods was performed on desorption and regeneration processes. Firstly, 0.8 g H4Ti5O12 were added into 400 mL LiCl solution with initial concentration of 24 mM at pH 13, and equilibrated for 4 h. Afterwards, the H4Ti5O12 after Li+ adsorption was immerged into 0.2 M HCl aqueous solution and stirred for 24 h to carry out the regeneration process. Then, white precipitates were washed by ethanol and deionized water for three times, respectively. The precipitates were dried in an oven at 60 °C for 12 h. In the next reutilization experiments, the volume of LiCl solution was obtained according to adsorbent dosage (in this study, H4Ti5O12 dosage was 2 g L−1). The reuse of H4Ti5O12 was lasted for five cycles following the above steps.
2.3 Characterization of adsorbents
X-ray diffraction (XRD) (XPert PRO, PANalytical, Netherlands) was used to characterize the crystalline phase of samples. The morphology and size of samples were observed by SEM (SU8010, HITACHI, JAPAN) and TEM (Titan G2 60-300, FEI, USA). The concentrations of ions were measured with Inductively Coupled Plasma (Optima 7000DV, PerkinElmer, USA) and Ion Chromatography System (ICS-1100). The BET surface area and pore size distributions of H4Ti5O12 nanorods was measured through N2 adsorption–desorption isotherms on a TriStar II 3020 nitrogen adsorption apparatus (Micromeritics, USA). X-ray photoelectron spectroscopy (XPS) analysis was recorded on a PHI 5300x multi-technique system with a Mg-Kα X-ray source. FT-IR (Tensor 27, Bruker, Germany) patterns were collected from 400 cm−1 to 4000 cm−1 with a resolution of 2 cm−1. DSC-TG curves of material was performed on a Netzsch Leading thermal analyzer (STA449F3, NETZSCH, Germany) at a heating rate of 10 °C min−1 in nitrogen atmosphere.
3. Results and discussion
3.1 Material characterization
Fig. 1 presents the XRD patterns of titanium oxides obtained from different process. In the XRD spectrum of first hydrothermal process, the diffraction peaks at 8.96°, 18.01°, 28.0°, 38.7° and 59.1° were assigned to the reflections of (200), (400), (110), (501) and (020) planes, respectively, which were correlated with H2Ti2O5·xH2O (PDF no. 47-0124).21 Through second hydrothermal treatment, the synthesized sample can be perfectly indexed to the layer-structured orthorhombic Li1.81H0.19Ti2O5·xH2O unit cell with a = 16.66 nm, b = 3.979 nm, and c = 3.007 nm (PDF no. 47-0123) (Fig. 1a).22 After Li1.81H0.19Ti2O5·xH2O was calcined at 550 °C for 6 h, the peaks at 18.33°, 35.57° and 43.24° appear, which correspond to the spinel Li4Ti5O12 (PDF no. 49-0207), implying the layer-structured of Li1.81H0.19Ti2O5·xH2O was majorly transformed to spinel Li4Ti5O12 with only minor phase of anatase TiO2 (Fig. 1b).23 After acid treatment, the H4Ti5O12 maintains the spinel structure and the intensity become weakly (Fig. S1†). In addition, all peaks are slightly shifted, implying the unit cell dimension is changed by the ion exchange between H+ and Li+.
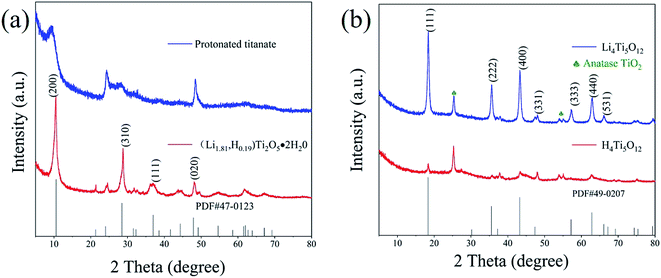 |
| | Fig. 1 The XRD patterns of titanium oxides. (a) H2Ti2O5·xH2O and Li1.81H0.19Ti2O5·xH2O, (b) Li4Ti5O12 and H4Ti5O12. | |
TG-DSC curves were applied to investigate the phase transformation of the Li1.81H0.19Ti2O5·xH2O upon heating and curves were shown in Fig. 2. A total weight loss of about 12.71% was observed between 40–800 °C. The first weight loss region is 40–200 °C and the corresponding weight loss is about 7.60%. Basing on the literatures, the first weight loss region corresponded to the phase transformation from Li1.81H0.19Ti2O5·xH2O to Li1.81H0.19Ti2O5 by an endothermal peak appeared about 193.4 °C.24 The second weight loss region is 200–400 °C and the weight loss is about 4.5%, which corresponds to the phase transformation from Li1.81H0.19Ti2O5 to Li4Ti5O12.25 Heating to 200–400 °C results in the collapse of the layered structure and the formation of Li4Ti5O12. The weakly broad peak appears at 600 °C to 800 °C and the weight loss is about 0.6%, which is ascribed to the Li evaporation.26
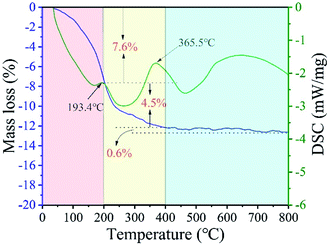 |
| | Fig. 2 The DSC-TG curves of Li1.81H0.19Ti2O5·xH2O. | |
The size and morphology of titanium oxides were observed by SEM and images were showed in Fig. 3. The image of H2Ti2O5·xH2O shows one-dimensional nanorods with the average length around 300 nm (Fig. 3a). After second hydrothermal process, the Li1.81H0.19Ti2O5·xH2O still retains the one-dimensional morphology with the length around 5 μm at 95 °C for 24 h (Fig. 3b). However, when treated temperature increasing to 120 °C for 24 h in Fig. S2b,† the nanorods morphology disappears and is completely converted to particles with the size from 50 nm to 100 nm (Fig. S1†), indicating that the relatively low temperature is beneficial for keeping the nanorods morphology. After calcined process at 550 °C for 6 h (Fig. 3c), the Li4Ti5O12 possess a rod-like morphology with largely rough surface. After acid treatment, the Li4Ti5O12 nanorods is converted to H4Ti5O12 nanorods without the morphology change (Fig. 3d).
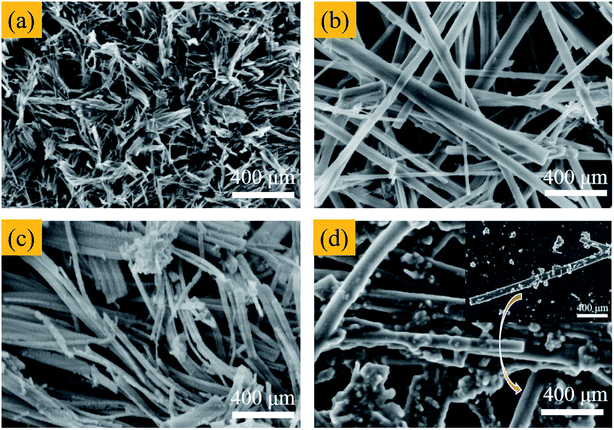 |
| | Fig. 3 The SEM images of (a) H2Ti2O5·xH2O, (b) Li1.81H0.19Ti2O5·xH2O, (c) Li4Ti5O12 and (d) H4Ti5O12. | |
The TEM technology was used to further characterize the Li4Ti5O12 nanorods structure and the images were shown in Fig. 4. It is easily observed that the nanorods structure is very stable even after ultrasonic processing and electron beam attacking during TEM test in Fig. 4a and b. The spacing lattices were 0.48 nm and 0.21 nm, which match well with the (111) and (−400) planes or equivalent facets of spinel Li4Ti5O12. Therefore, it can conclude that the Li4Ti5O12 nanorods is growth along [100] direction with rough surface (Fig. 4c and d).27 From the above results, the Li4Ti5O12 nanorods has a high crystallinity and the rough surface would be benefit for Li+ and H+ ion exchange.
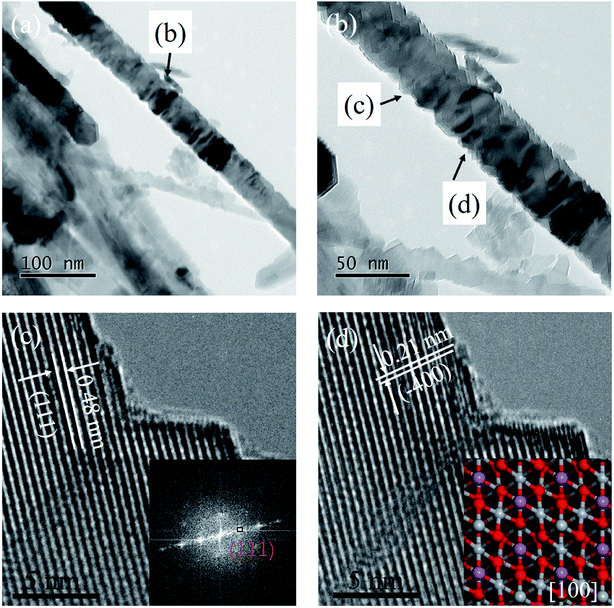 |
| | Fig. 4 (a) and (b) TEM images and (c) and (d) high resolution TEM images of Li4Ti5O12. The inset of (c) is corresponding FFT pattern, and inset of (d) is the Li4Ti5O12 (111) top view crystal structure from the [100] direction. | |
The precursor Li4Ti5O12 and the final adsorbent H4Ti5O12 were identified by typical FTIR spectra and presented in Fig. 5. In the spectrum of Li4Ti5O12 and H4Ti5O12, the peaks at 3442.17 cm−1 and 1632.82 cm−1 are ascribed to the O–H vibrations of adsorbed water in the sample surface,28 while the peaks at 1075.87 cm−1 and 459.89 cm−1 are resulted from Ti–O and Li–O vibrations.29 After acid treatment, the new peak appears at 504.36 cm−1 was imputed to the vibration of Ti–O vibrations, which indicates that the Li+/H+ ion exchange reaction present in acid treatment process.27
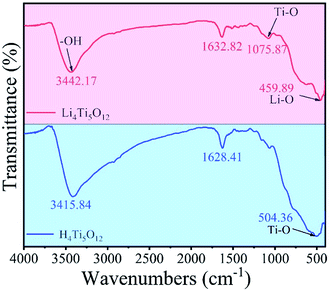 |
| | Fig. 5 The FTIR spectra of Li4Ti5O12 nanorods and H4Ti5O12 nanorods. | |
In order to further understand the impact of nanorods structure on the adsorption process, the surface area and pore distribution were investigated by BET and the results were shown in Fig. 6. The adsorption/desorption isotherm is type IV with slight hysteresis according to the IUPAC classification and the pore size is almost 25 nm, which will be benefit to the H+ and Li+ exchange. The BET surface area of H4Ti5O12 nanorods is calculated using BET equation to be 84.34 m2 g−1.
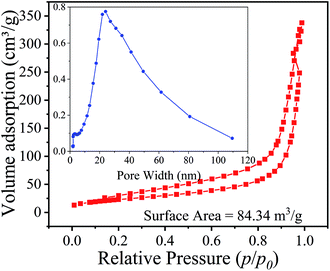 |
| | Fig. 6 N2 adsorption–desorption isotherms of H4Ti5O12 nanorods. | |
3.2 Adsorption studies
3.2.1 Acid treatment. In order to investigate the optimal HCl concentrations for the lithium and titanium extraction, the Li4Ti5O12 nanorods were treated in different HCl concentrations and the results were shown in Fig. 7. As shown in Fig. 7a, the lithium can easily leach from Li4Ti5O12 nanorods and reach the equilibrium almost 10 h. The amount of extracted lithium increases from 48% to 89% when the HCl concentration increases from 0.05 M to 0.20 M. When the HCl concentration increases from 0.50 M to 1.00 M, the amount of extracted lithium changes slightly. In contrast, the amount of extracted titanium increases slightly from 0.1% to 2.0% when HCl concentration changes from 0.05 M to 0.20 M. When the HCl concentration increases from 0.50 M to 1.00 M, the amount of extracted titanium changes dramatically from 11% to 19% (Fig. 7b). Generally speaking, lithium ion sieves have to possess the little dissolution of titanium and large extracted of lithium to increase the adsorption performance. Therefore, 0.20 M HCl solution is adopted in the subsequent study to maximize the extraction efficiency for lithium ions and minimize the dissolution of titanium ions from Li4Ti5O12 nanorods.
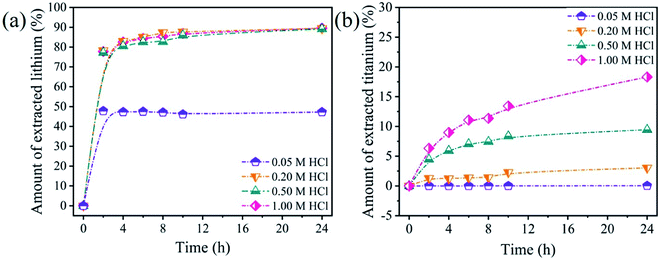 |
| | Fig. 7 The amount of extracted (a) lithium and (b) titanium from Li4Ti5O12 nanorods in different HCl concentrations. | |
3.2.2 Effect of pH value on the adsorption capacity. The pH value of the initial solution has an important impact on the Li+ adsorption and the Li+ adsorption capacity of H4Ti5O12 nanorods was shown in Fig. 8. In this study, the adsorption capacity of nanorods adsorbent increased when the pH value changed from 4 to 13. Especially, when the pH value is changed from 12 to 13, the adsorption capacity is increased from 16.49 mg g−1 to 22.06 mg g−1. So, the pH value of solution at 13 is optimized to investigate the adsorption behavior in our adsorption experiments. The influence of pH on lithium uptake capacity is acquired by empirical and mechanistic models. The mechanism can be explained by ion-exchange behavior, which H+ ions exchanged by Li+ ions. It is indicated that the high pH is benefit to the Li+ adsorption and this process can be explained by reaction (6).| | |
H4Ti5O12 + 4Li+ = Li4Ti5O12 + 4H+
| (6) |
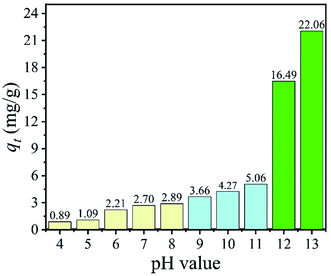 |
| | Fig. 8 The effect of pH value on Li+ adsorption (C0: 24 mM LiCl, adsorbent: 0.1 g, volume: 50 mL, T: 25 °C). | |
3.2.3 The influence of morphologies on the Li+ adsorption. To investigate the influence of different morphologies on the Li+ adsorption, the H4Ti5O12 nanosheets was derived from Li4Ti5O12 nanosheets and the adsorption behaviors and adsorption capacities were investigated between H4Ti5O12 nanorods and H4Ti5O12 nanosheet. The XRD patterns show that the peaks of white sample obtained from the hydrothermal process can be assigned to Li1.81H0.19Ti2O5·xH2O and the peaks can be indexed to spinel Li4Ti5O12 after heat treatment (Fig. S2†). The SEM image of Li1.81H0.19Ti2O5·xH2O nanosheets displays nanosheets structure with length close to 1 μm (Fig. S3a†). The morphologies and sizes of Li4Ti5O12 and H4Ti5O12 have little changed after heating and acid leaching treatments (Fig. S3b and c†).The adsorption capacities of H4Ti5O12 with different shapes entirely increase with the increasing of LiCl concentrations (Fig. S4†). Especially, the maximum adsorption capacities of H4Ti5O12 nanosheets and nanorods are 18.8 mg g−1 and 21.8 mg g−1 in 24 mM LiCl solutions, respectively (Fig. S4a and b†). Meanwhile, the impact of adsorption temperatures on the Li+ adsorption process was systematically investigated. It is easily found that the higher temperatures of LiCl solutions are benefit to increase the adsorption capacities of different shapes in Fig. S4c and d.† Meanwhile, the results of adsorption temperatures on adsorption capacities of H4Ti5O12 nanorods shows that the higher temperatures are benefit to increase the adsorption capacities and the adsorption capacities of H4Ti5O12 nanorods are higher than H4Ti5O12 nanosheets. From the above results, it is easily indicated that the H4Ti5O12 nanorods has good adsorption capacity and the H4Ti5O12 nanorods was used to perform the following adsorption experiments.
Besides, considering different adsorbents have different adsorption capacities, we added the comparison of the adsorption performance with other reported Li-adsorbents in Table 1. From this table, the manganese oxides (HMn2O4, H1.33Mn1.67O4 and H1.66Mn1.67O4) have larger adsorption capacities and the adsorption uptakes can reach to 10–40 mg g−1. However, the dissolution of manganese is an inevitable problem (the loss of Mn >3%). Although, some researchers have been devoted to decrease the loss of manganese in acid leaching process through coated or doped methods.30,31 The loss of manganese decreases obviously and the dissolution of manganese are still larger than the dissolution of titanium of titanium oxides (H2TiO3 and H4Ti5O12).32,33 LiCl·2Al(OH)3·xH2O adsorbents possess lower cost, simple preparation and adaptable advantages in real brines. But the adsorption capacities (5–8 mg g−1) need to improve in industrial application.34 Compared to manganese oxides and LiCl·2Al(OH)3·xH2O, titanium oxides have high adsorption capacities and lower dissolution of titanium. These results imply that this H4Ti5O12 nanorods adsorbent has a potential application in Li+ recovery.
Table 1 Comparison of the adsorption performance with other reported Li-adsorbents
| Materials |
qe (mg g−1) |
Te (h) |
Loss of Ti/Mn |
Adsorption environment |
Ref. |
| pH |
T (°C) |
CLiCl (g L−1) |
| HMn2O4 |
11.8 |
4 |
11% |
12 |
25 |
0.02 |
31 |
| H1.33Mn1.67O4 |
12.1 |
4 |
10% |
12 |
45 |
0.20 |
31 |
| H1.66Mn1.67O4-doped |
30.8 |
48 |
3.9–4.42% |
12 |
25 |
0.08 |
30 |
| H1.66Mn1.67O4 nanorods |
35.0 |
24 |
5.2% |
11 |
25 |
0.15 |
35 |
| H2TiO3 |
16.6 |
22 |
0.75% |
14 |
25 |
1.00 |
32 |
| H2TiO3 nanoparticles |
34.2 |
24 |
— |
12 |
25 |
0.5 |
33 |
| Yolk–shell H4Ti5O12 |
28.5 |
8 |
1% |
13 |
25 |
0.35 |
36 |
| H4Ti5O12 nanosheets |
20.2 |
4 |
1.8% |
13 |
45 |
0.17 |
This work |
| H4Ti5O12 nanorods |
31.4 |
4 |
2% |
13 |
45 |
0.25 |
This work |
3.2.4 Adsorption isotherms. In order to understand Li+ adsorption behavior on H4Ti5O12 nanorods, the Langmuir (eqn (7)) and Freundlich models (eqn (8)) were used to analysis adsorption process:37| |
 | (7) |
| |
 | (8) |
where qm (mg g−1) is the maximum uptake capacity in theory, b (L mg−1) is the Langmuir constant, kF (mg g−1) and n are the Freundlich constant.Fig. 9 and Table 2 show the fitting dates of the Langmuir and Freundlich isotherms models, which are usually used to understand the behavior of monolayer and multilayer adsorption on the adsorbent surface. The Li+ adsorption process is fitted better with the Langmuir isotherms models due to higher correlation R2 at different reaction temperatures, indicating that the ions exchanged process determine by Li+ adsorbed on the surface of H4Ti5O12 nanorods with a monolayer adsorption.
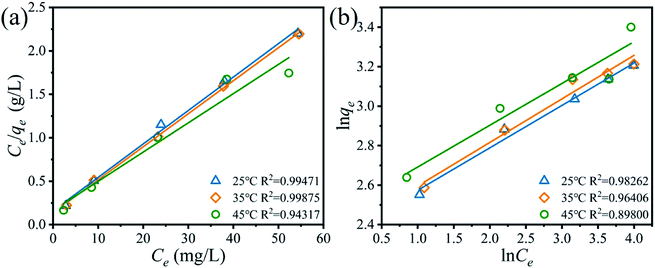 |
| | Fig. 9 (a) Langmuir and (b) Freundlich isotherms models for Li+ adsorbed on the H4Ti5O12 nanorods at different adsorption temperatures. (adsorbent: 0.1 g, volume: 50 mL, shaking speed: 150 rpm). | |
Table 2 The fitting results of the Langmuir and Freundlich isotherms models for Li+ adsorbed on the H4Ti5O12 nanorods at different reaction temperature
| T (°C) |
Langmuir model |
Freundlich model |
| qm (mg g−1) |
b (L mg−1) |
R2 |
kF (mg g−1)(L mg−1) |
1/n |
R2 |
| 25 |
25.99 |
0.24 |
0.99 |
10.59 |
4.67 |
0.98 |
| 35 |
26.33 |
0.28 |
0.99 |
10.75 |
4.53 |
0.96 |
| 45 |
29.74 |
0.21 |
0.94 |
11.95 |
4.73 |
0.90 |
The Li+ adsorption behaviors of H4Ti5O12 nanorods at different temperature (25 °C, 35 °C, 45 °C) are depicted in ESI (Fig. S5†). The Li+ adsorption uptake of H4Ti5O12 nanorods is enhanced with increase of temperature, indicating the adsorption is endothermic reaction.38
3.2.5 Adsorption kinetics. The Li+ adsorption behavior on H4Ti5O12 nanorods was fitted by the pseudo-first-order and pseudo-second-order kinetic models and their mathematical form is expressed by the eqn (9) and (10):39,40| |
ln(qe − qt) = ln![[thin space (1/6-em)]](https://www.rsc.org/images/entities/char_2009.gif) qe − K1t qe − K1t
| (9) |
| |
 | (10) |
where qe (mg g−1) and qt (mg g−1) are the adsorption capacity at equilibrium and a random time t (min); the pseudo first-order and pseudo-second-order adsorption constants denote K1 (min−1) and K2 (g (mg min)−1), respectively.The fitting results of relevant kinetic parameters of pseudo-first-order and pseudo-second-order models were displayed in Fig. 10. From the fitting dates, it is easily observed that the R2 values of pseudo-second-order are much higher than the R2 values of pseudo-first-order. Moreover, the experimental adsorption capacity (qe,exp) values (Fig. S6†) match well with the theoretical adsorption capacity (qe,cal) values calculated from the pseudo-second-order model rather than the pseudo-first-order model (Table 3). These results indicate that the Li+ adsorption process can be well described by the pseudo-second-order model, and this suggests that the Li+ adsorption on H4Ti5O12 nanorods is controlled by the chemical exchanged process.
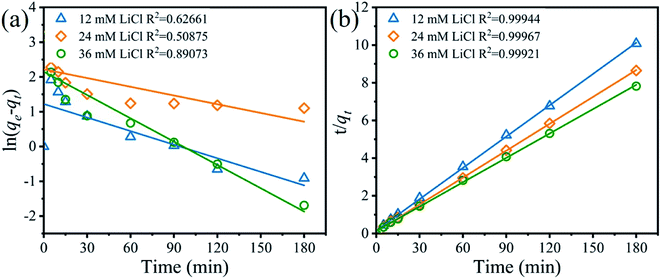 |
| | Fig. 10 (a) Pseudo-first-order and (b) pseudo-second-order kinetics plots for the Li+ adsorption on the H4Ti5O12 nanorods at different LiCl concentrations (adsorbent: 0.1 g, volume: 50 mL, shaking speed: 150 rpm, temperature: 25 °C). | |
Table 3 The pseudo-first-order and pseudo-second-order kinetics models match for the Li+ adsorption behavior on the H4Ti5O12 nanorods at different Li+ concentrations
| C0 (mg g−1) |
qe,exp (mg g−1) |
Pseudo-first-order |
Pseudo-second-order |
| qe,cal (mg g−1) |
K1 (min−1) |
R2 |
qe,cal (mg g−1) |
K2 (min−1) |
R2 |
| 12 |
17.86 |
3.40 |
0.01 |
0.63 |
18.07 |
5.03 × 10⁻⁴ |
0.99 |
| 24 |
20.81 |
9.20 |
0.01 |
0.51 |
21.03 |
2.53 × 10⁻⁴ |
0.99 |
| 36 |
23.05 |
8.59 |
0.02 |
0.89 |
23.20 |
2.47 × 10⁻⁴ |
0.99 |
3.2.6 Adsorption selectivity. Considering that the concentration of Li+ is very low while the coexist ions (Na+, K+, Rb+, Cs+) are higher in the brines, the adsorption selectivity experiments of nanorods adsorbent was furtherly investigated in other alkali metal ions and coexist ions.The results of Li+ adsorption selectivity in non-competitive and competitive solution were illustrated in Fig. 11. It is easily found that this adsorbent has good Li+ adsorption selectivity, both in non-competitive and competitive solutions. The maximum adsorption abilities can reach to 3.05 mmol g−1. The distribution coefficient (Kd) and separation factor (αLiM) of various cations were shown in Table 4. The order of Kd values of H4Ti5O12 nanorods for these cations is Li+ ≫ K+ > Rb+ ≈ Cs+ > Na+, which may be caused by the ion radius of Li+ (0.059 nm) can migrate to the pore channel of nanorods adsorbent while Na+, K+, Rb+, Cs+ with lager ion radius are only can uptake on the surface of adsorbent without enter into it.41 The real adsorption selectivity experiments show that the maximum Li+ adsorption capacity reach to 1.99 mmol g−1, which was far higher than Mg2+ (0.03 mmol g−1) and Ca2+ (0.02 mmol g−1), indicating that the prepared materials have excellent separation performance of Li+ and Mg2+ in Lagoco Salt Lake brine in Table 5. Consequently, the nanorods adsorbent has a high capacity for Li+ ions and well ion selective property for Li+ in aqueous solution.
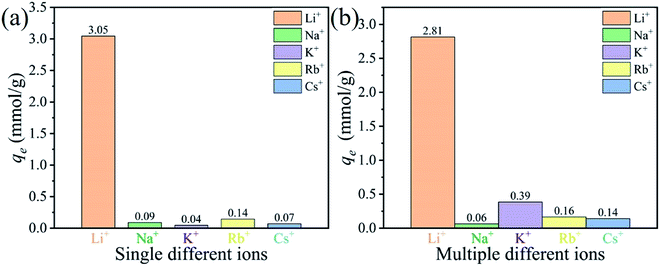 |
| | Fig. 11 Equilibrium adsorption capacities of H4Ti5O12 nanorods adsorbent in the (a) non-competitive solution with 24 mM cation and (b) a competitive solution with 24 mM for each cation. | |
Table 4 Selective adsorption of H4Ti5O12 nanorods in solutions containing Li+, Na+, K+, Rb+, Cs+
| Metal ions |
qe (mmol g−1) |
Kd (mL g−1) |
αLiM |
| Li+ |
2.81 |
800.28 |
1 |
| Na+ |
0.06 |
2.73 |
296.51 |
| K+ |
0.39 |
12.13 |
66.78 |
| Rb+ |
0.16 |
8.54 |
94.77 |
| Cs+ |
0.14 |
7.57 |
106.83 |
Table 5 Adsorption selectivity of H4Ti5O12 nanorods in Lagoco Salt Lake
| Metal ions |
qe (mg g−1) |
qe (mmol g−1) |
Kd (mL g−1) |
αLiM |
| Li+ |
13.80 |
1.99 |
690.00 |
1.00 |
| Na+ |
12.50 |
0.54 |
50.00 |
13.80 |
| K+ |
1.00 |
0.03 |
20.00 |
34.50 |
| Mg2+ |
0.90 |
0.03 |
45.00 |
15.33 |
| Ca2+ |
0.91 |
0.02 |
45.65 |
15.12 |
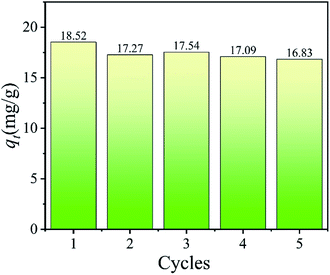
3.2.7 Adsorbent recycling. The regeneration capabilities of H4Ti5O12 nanorods were evaluated by five sequential cycles of adsorption/desorption process and the results including adsorption capacities and XRD patterns were shown in Fig. 12 and S6.† It can be easily found that the adsorption capacity for Li+ decreases slightly after five adsorption experiments. In addition, the adsorption capacity of Li+ still maintains 91% of the first adsorption capacity in the fifth cycle (Fig. 12). The XRD pattern in Fig. S7(a)† shows that the peaks of H4Ti5O12 in each cycle are similar to the original pattern of H4Ti5O12, which indicates the well stability of H4Ti5O12. After the Li+ adsorption, the diffraction peaks of samples can be indexed to the spinel Li4Ti5O12 unit cell with a = 8.3588, b = 8.3588 and c = 8.3588 nm (PDF no. 49-0207) in Fig. S7(b),† which is indicated that the H+ ions are exchanged by the Li+ ions and the structure is transforming from the H4Ti5O12 to Li4Ti5O12 without structure collapsing. These results indicate that the H4Ti5O12 nanorods has high adsorption capacity in inorganic Li+ ion exchange materials and well chemical stability.
 |
| | Fig. 12 The Li+ adsorption capacities of H4Ti5O12 nanorods in each recycling process. (adsorbent: 0.1 g, C0: 24 mM LiCl, T: 25 °C, time: 4 h). | |
3.2.8 Adsorption mechanism. The element compositions of H4Ti5O12 and Li4Ti5O12 nanorods were investigated by XPS in Fig. 13 and the mechanism of Li+ adsorbed on H4Ti5O12 surface was elaborated. Strong peaks of O 1s and Ti 2p can be clearly observed in Fig. 13a. The intensity of Li 1s on Li4Ti5O12 increases obviously than H4Ti5O12 (Fig. 13b), probably due to the H–O transformation to Li–O bonds. Before the Li+ adsorption, the high-resolution XPS spectrum of Ti 2p shows the two peaks at 458.81 eV and 464.46 eV in Fig. 13c, which correspond well with characteristic Ti 2p3/2 and Ti 2p1/2 peaks of Ti4+.42 After Li+ adsorption, there is 0.34 eV deviation of Ti 2p3/2, which can be ascribed to H–O–Ti transformation to Li–O–Ti. From the image of Fig. 13d, there is 0.35 eV deviation of O–Ti and the intensity of –OH increases after the Li+ adsorption, which may ascribe to the H–O–Ti transformed to Li–O–Ti. Based on the literatures, adsorption mechanism is consisted of redox reactions43,44 and ion exchange.45 There is no valence change of Ti after Li+ adsorption (Fig. 13c), indicating that the Li+ adsorption on H4Ti5O12 is an ion exchange reaction which matches well with the Dubinin–Radushkevich isotherm model.
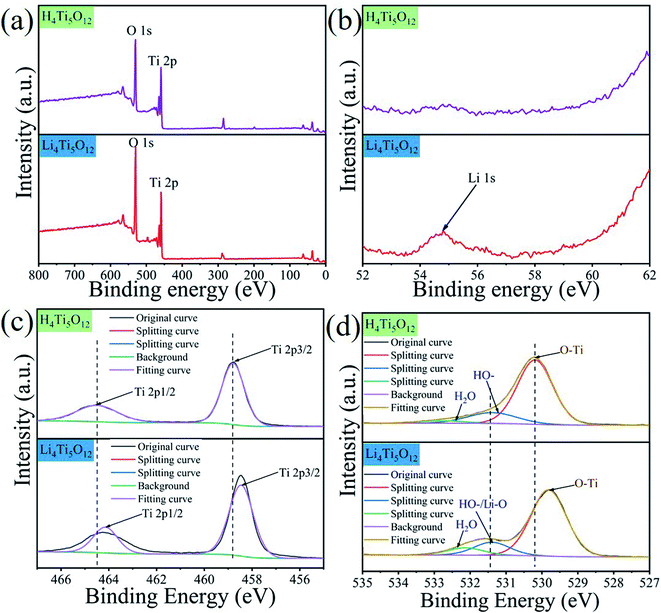 |
| | Fig. 13 The XPS analyses of H4Ti5O12 and Li4Ti5O12 nanorods. (a) Survey spectra of H4Ti5O12 and Li4Ti5O12 and (b) Li 1s; (c) the high-resolution spectra of Ti 2p and (d) the high-resolution spectra of O 1s. | |
4. Conclusions
In this study, the Li4Ti5O12 nanorod were prepared by hydrothermal methods through two steps followed by a calcination process. Then, the H4Ti5O12 nanorods along the [100] direction were obtained by HCl acid treatment. Batch adsorption experiments were conducted to investigate the adsorption behavior of the nanorod adsorbent. Acid treatment experiments show the maximum amount of extracted lithium can reach 90% and the amount of extracted titanium only reaches 2.5%. The adsorption behavior of H4Ti5O12 is monolayer adsorption and the adsorption process is a chemical exchange process. Adsorption selectivity experiments show that nanorod adsorbent has high selectivity for Li+ ions in simulated brine and real brines. In addition, the Li+ adsorption capacity still remains 16.83 mg g−1 even after five recycling experiments. The Li+ adsorption on H4Ti5O12 nanorods is an ion exchange reaction by adsorption mechanism analysis. Furthermore, this nanorod adsorbent is a promising candidate as an environment friendly Li+ adsorbent for successful application to exploit liquid lithium resources.
Conflicts of interest
The authors declare no conflict of interest.
Acknowledgements
This study was supported by the NSFC (No. U1607105, No. 51302280). Natural Science Foundation in Qinghai Province (No. 2018-GX-101, No. 2019-HZ-808, No. 2018-ZJ-722). The Thousand Talents Plan in Qinghai Province and Youth Innovation Promotion Association of Chinese Academy of Sciences (No. 2016377).
Notes and references
- J. W. An, D. J. Kang, K. T. Tran, M. J. Kim, T. Lim and T. Tran, Hydrometallurgy, 2012, 117–118, 64–70 CrossRef CAS.
- L. Y. Zhang, D. L. Zhou, G. He, F. H. Wang and J. B. Zhou, Mater. Lett., 2014, 135, 206–209 CrossRef CAS.
- S. Ziemanna, M. Weil and L. Schebeka, Resour., Conserv. Recycl., 2012, 63, 26–34 CrossRef.
- B. Swain, Sep. Purif. Technol., 2017, 172, 388–403 CrossRef CAS.
- S. Hu, Y. Li, F. Lai, X. Zhang, Q. Li, Y. Huang, X. Yuan, J. Chen and H. Wang, RSC Adv., 2015, 5, 17592–17600 RSC.
- J. Nan, D. Han and X. Zuo, J. Power Sources, 2005, 152, 278–284 CrossRef CAS.
- H. B. Li and L. D. Zou, Desalination, 2011, 275, 62–66 CrossRef CAS.
- I. H. Chowdhury, A. H. Chowdhury, P. Bose, S. Mandal and M. K. Naskar, RSC Adv., 2016, 6, 6038–6047 RSC.
- I. H. Chowdhury and M. K. Naskar, RSC Adv., 2016, 6, 67136–67142 RSC.
- H. N. M. E. Mahmud, A. K. O. Huq and R. b. Yahya, RSC Adv., 2016, 6, 14778–14791 RSC.
- S. Kaneko and W. Takahashi, Colloids Surf., 1990, 47, 69–79 CrossRef CAS.
- W. J. Chung, R. E. C. Torrejos, M. J. Park, E. L. Vivas, L. A. Limjuco, C. P. Lawagon, K. J. Parohinog, S.-P. Lee, H. K. Shon, H. Kim and G. M. Nisola, Chem. Eng. J., 2017, 309, 49–62 CrossRef CAS.
- C. Özgür, Solid State Ionics, 2010, 181, 1425–1428 CrossRef.
- J. L. Xiao, X. Y. Nie, S. Y. Sun, X. F. Song, P. Li and J. G. Yu, Adv. Powder Technol., 2015, 26, 589–594 CrossRef CAS.
- F. R. Qian, M. Guo, Z. Q. Qian, Q. Li, Z. J. Wu and Z. Liu, ChemistrySelect, 2019, 4, 10157–10163 CrossRef CAS.
- N. Li, K. F. Gan, D. Lu, J. L. Zhang and L. Z. Wang, Res. Chem. Intermed., 2017, 44, 1105–1117 CrossRef.
- S. Kaneko and W. Takahashi, Colloids Surf., 1990, 47, 69–79 CrossRef CAS.
- N. Li, D. Lu, J. Zhang and L. Wang, J. Colloid Interface Sci., 2018, 520, 33–40 CrossRef CAS.
- S. D. Wei, Y. F. Wei, T. Chen, C. B. Liu and Y. H. Tang, Chem. Eng. J., 2020, 379, 122407 CrossRef CAS.
- Y. Li, G. L. Pan, J. W. Liu and X. P. Gao, J. Electrochem. Soc., 2009, 156, A495 CrossRef CAS.
- H. Zhang, G. R. Li, L. P. An, T. Y. Yan, X. P. Gao and H. Y. Zhu, J. Phys. Chem. C, 2017, 111, 6143–6148 CrossRef.
- K. Zhu, H. Gao and G. Hu, J. Power Sources, 2018, 375, 59–67 CrossRef CAS.
- Y. Sha, B. Zhao, R. Ran, R. Cai and Z. Shao, J. Mater. Chem. A, 2013, 1, 13233 RSC.
- T. Gao, H. Fjellvåg and P. Norby, J. Phys. Chem. B, 2008, 112, 9400–9405 CrossRef CAS.
- N. Li, T. Mei, Y. Zhu, L. Wang, J. Liang, X. Zhang, Y. Qian and K. Tang, CrystEngComm, 2012, 14, 6435 RSC.
- S. Wang, W. Quan, Z. Zhu, Y. Yang, Q. Liu, Y. Ren, X. Zhang, R. Xu, Y. Hong, Z. Zhang, K. Amine, Z. Tang, J. Lu and J. Li, Nat. Commun., 2017, 8, 627 CrossRef.
- J. Shu, Electrochem. Solid-State Lett., 2008, 11, A238 CrossRef CAS.
- M. R. Mohammadi and D. J. Fray, J. Sol-Gel Sci. Technol., 2010, 55, 19–35 CrossRef CAS.
- J. H. Kim, S. y. Bae, J. H. Min, S. W. Song and D. W. Kim, Electrochim. Acta, 2012, 78, 11–16 CrossRef CAS.
- F. R. Qian, B. Zhao, M. Guo, Z. Q. Qian, N. C. Xu, Z. J. Wu and Z. Liu, Hydrometallurgy, 2020, 193, 105291–105300 CrossRef CAS.
- H. S. Wang, J. J. Cui, M. L. Li, Y. F. Guo, T. L. Deng and X. P. Yu, Chem. Eng. J., 2020, 389, 124410–124419 CrossRef CAS.
- L. Y. Zhang, D. L. Zhou, Q. Q. Yao and J. B. Zhou, Appl. Surf. Sci., 2016, 368, 82–87 CrossRef CAS.
- R. Chitrakar, Y. Makita, K. Ooi and A. Sonoda, Dalton Trans., 2014, 43, 8933–8939 RSC.
- J. Zhong, S. Lin and J. G. Yu, J. Colloid Interface Sci., 2020, 572, 107–113 CrossRef CAS.
- F. R. Qian, M. Guo, Z. Q. Qian, Q. Li, Z. Wu and Z. Liu, ChemistrySelect, 2019, 4, 10157–10163 CrossRef CAS.
- N. Li, D. L. Lu, J. L. Zhang and L. Z. Wang, J. Colloid Interface Sci., 2018, 520, 33–40 CrossRef CAS.
- Z. Liu, Y. Q. Zhou, M. Guo, B. L. Lv, Z. J. Wu and W. Z. Zhou, J. Hazard. Mater., 2019, 371, 712–720 CrossRef CAS.
- X. C. Shi, D. F. Zhou, Z. B. Zhang, L. L. Yu, H. Xu, B. Z. Chen and X. Y. Yang, Hydrometallurgy, 2011, 110, 99–106 CrossRef CAS.
- D. Ding, K. X. Li, D. Z. Fang, X. S. Ye, Y. Q. Hu, X. L. Tan, H. N. Liu and Z. J. Wu, ChemistrySelect, 2019, 4, 13630–13637 CrossRef CAS.
- Z. Liu, R. Yu, Y. P. Dong, W. Li and B. L. Lv, Chem. Eng. J., 2017, 309, 815–823 CrossRef CAS.
- Q. Feng, H. Kanoh, Y. Miyai and K. Ooi, Chem. Mater., 1995, 7, 1226–1232 CrossRef CAS.
- H. Li, L. Shen, X. Zhang, J. Wang, P. Nie, Q. Che and B. Ding, J. Power Sources, 2013, 221, 122–127 CrossRef CAS.
- X. Xu, Y. Chen, P. Wan, K. Gasem, K. Wang, T. He, H. Adidharma and M. Fan, Prog. Mater. Sci., 2016, 84, 276–313 CrossRef CAS.
- J. C. Hunter, J. Solid State Chem., 1981, 3, 142–147 CrossRef.
- X. Luo, K. Zhang, J. Luo, S. Luo and J. Crittenden, Environ. Sci. Technol., 2016, 50, 13002–13012 CrossRef CAS.
Footnote |
| † Electronic supplementary information (ESI) available. See DOI: 10.1039/d0ra05094f |
|
| This journal is © The Royal Society of Chemistry 2020 |
Click here to see how this site uses Cookies. View our privacy policy here.  Open Access Article
 *ab
*ab
![[thin space (1/6-em)]](https://www.rsc.org/images/entities/char_2009.gif) 14 and Li1.6Mn1.6O4,15 lithium titanium oxides (Li2TiO3 and Li4Ti5O12) and LiCl·2Al(OH)3·xH2O have been used to recover lithium. Spinel lithium manganese oxides have been synthesized as the precursor for preparation lithium ion-sieves to recover Li+ in sea water and brines. However, serious Mn loss of lithium manganese oxides during the acid process impede their industrial application. Compared with lithium manganese oxides, lithium titanium oxides have good adsorption capacities and slight Ti loss in acid process. Li4Ti5O12 has the same spinel structure like Li1.33Mn1.67O4, which also has good adsorption capacity.16 The reason for low dissolution is that the titanium valence remains stably +4 during leaching and adsorption process. Furthermore, Li4Ti5O12 has well anti-acidic property and is suitable to extract lithium due to the Ti–O bond. Kaneko et al. investigated the effect of LiCl·2Al(OH)3·xH2O morphology on the Li+ adsorption behavior and presented the surface area was an important factor for adsorption process.17 Li et al. prepared yolk–shell structured Li4Ti5O12 to increase the surface area and the adsorption uptake can reached to 28.46 mg g−1 in 50 mM LiCl solution.18 Wei et al. recovered about 59.1 mg g−1 of lithium in 144 mM LiCl solution by using H4Ti5O12 as adsorbent.19 Li et al. also synthesized three-dimensionally H4Ti5O12 exhibited the high adsorption performance.16 So, the morphology and surface area have important factors to affect the adsorption behavior. According to the above H4Ti5O12 adsorbents, H4Ti5O12 has good adsorption performance and recycle stability. Considering that the nanowires and nanorods have similar one-dimensional structures, we believe that nanorods adsorbents have the similar surface area. However, research about the adsorption behavior of H4Ti5O12 nanorods has still not been reported.
14 and Li1.6Mn1.6O4,15 lithium titanium oxides (Li2TiO3 and Li4Ti5O12) and LiCl·2Al(OH)3·xH2O have been used to recover lithium. Spinel lithium manganese oxides have been synthesized as the precursor for preparation lithium ion-sieves to recover Li+ in sea water and brines. However, serious Mn loss of lithium manganese oxides during the acid process impede their industrial application. Compared with lithium manganese oxides, lithium titanium oxides have good adsorption capacities and slight Ti loss in acid process. Li4Ti5O12 has the same spinel structure like Li1.33Mn1.67O4, which also has good adsorption capacity.16 The reason for low dissolution is that the titanium valence remains stably +4 during leaching and adsorption process. Furthermore, Li4Ti5O12 has well anti-acidic property and is suitable to extract lithium due to the Ti–O bond. Kaneko et al. investigated the effect of LiCl·2Al(OH)3·xH2O morphology on the Li+ adsorption behavior and presented the surface area was an important factor for adsorption process.17 Li et al. prepared yolk–shell structured Li4Ti5O12 to increase the surface area and the adsorption uptake can reached to 28.46 mg g−1 in 50 mM LiCl solution.18 Wei et al. recovered about 59.1 mg g−1 of lithium in 144 mM LiCl solution by using H4Ti5O12 as adsorbent.19 Li et al. also synthesized three-dimensionally H4Ti5O12 exhibited the high adsorption performance.16 So, the morphology and surface area have important factors to affect the adsorption behavior. According to the above H4Ti5O12 adsorbents, H4Ti5O12 has good adsorption performance and recycle stability. Considering that the nanowires and nanorods have similar one-dimensional structures, we believe that nanorods adsorbents have the similar surface area. However, research about the adsorption behavior of H4Ti5O12 nanorods has still not been reported.


![[thin space (1/6-em)]](https://www.rsc.org/images/entities/char_2009.gif) qe − K1t
qe − K1t


