 Open Access Article
The effects of hydroxide and epoxide functional groups on the mechanical properties of graphene oxide and its failure mechanism by molecular dynamics simulations
Yunjin Sun†
a,
Xing Tang†b,
Hongwei Baob,
Zhi Yang *c and
Fei Ma
 *b
*b
aBeijing Laboratory of Food Quality and Safety, Beijing Key Laboratory of Agricultural Product Detection and Control for Spoilage Organisms and Pesticides, Food Science and Engineering College, Beijing University of Agriculture, Beijing 102206, P. R. China
bState Key Laboratory for Mechanical Behavior of Materials, Xi'an Jiaotong University, Xi'an 710049, Shaanxi, P. R. China. E-mail: mafei@mail.xjtu.edu.cn
cSchool of Materials Science and Engineering, Xihua University, Chengdu 610039, Sichuan, P.R. China. E-mail: yzmsn85@126.com
First published on 11th August 2020
Abstract
Graphene oxide (GO) could be assembled via amphiphilic interface adhesion into nano-composites. The deformation behaviors and mechanical properties of the composites are sensitive to the functional species absorbed on GO, which are investigated by molecular dynamics simulations. It is found that the ultimate stress and elastic modulus decreases greatly as the density of function groups absorbed on GO increase from 10% to 50%, but independent on the group type of hydroxide or epoxide ones. Fracture of GO is always initiated and preferentially propagated along the path on which hydroxide or epoxide groups are distributed. Essentially, hydroxide or epoxide groups will weaken the adjacent C–C bonds and induce structure transformation from honeycomb to diamond-like structure as result of hybridization transition from sp2 to sp3. The findings provide us a guidance for the design of GO based composites.
Introduction
Graphene xide (GO) is a graphene derivative with different amounts of hydroxyl and epoxy groups attached to the surface, and carboxyl groups distributed on the edge. Owing to its excellent mechanical, physical properties and chemical modification ability, it has promising applications in a wide range of areas, such as, polymer reinforced composites,1 super capacity,2 flexible electronic devices,3 lithium ion batteries,4 and so on. In general, GO is synthesized by either the Brodie,5 Staudenmaier,6 or Hummers method,7 or some variation of these methods. All three methods involve oxidation of graphite to various levels. Brodie and Staudenmaier used a combination of potassium chlorate (KClO3) with nitric acid (HNO3) to oxidize graphite, and the Hummers method involves treatment of graphite with potassium permanganate (KMnO4) and sulfuric acid (H2SO4).8In fact, during the exfoliation of chemically oxidized graphite into GO,9 the sp2 hybridized structure of the graphene sheets might be broken, sp2 to sp3 transformation usually takes place owing to the adsorption of epoxy or hydroxyl functional groups, defects or lattice disorder will be induced.10 As a result, the structural stability and mechanical properties of GO sheets should be substantially deteriorated.11,12 For example, when an oxygen atom is attached to the surface of graphene, two covalent bonds will be formed with two neighboring carbon atoms, resulting in an epoxy structure,13 elongation of C–C bond length from the initial 1.42 Å to 1.58 Å and transformation of in-plane sp2 structure to three dimensional sp3 structure. Similar to significantly reduced mechanical strength of graphene due to hydrogen coverage,14 hydroxide, oxygen or carboxyl group will disturb the lattice order and lower the intrinsic strength. Zhao et al.15 found that the Yong's modulus and intrinsic strength of graphene oxide with epoxy group orderly and disorderly distributed decreases with increasing in-plane broken C–C bonds. When the ratio of oxygen atom and carbon atom is 1![[thin space (1/6-em)]](https://www.rsc.org/images/entities/char_2009.gif) :
:![[thin space (1/6-em)]](https://www.rsc.org/images/entities/char_2009.gif) 5, the oxygen atom will induce the transformation of 40% sp2 hybrid C–C bonds into sp3 hybridization.16 Barber et al.17 found that the fracture was induced by unevenly distributed stress near defects and nonuniform distribution of hydroxyl groups. As the number increases, the oxygen atoms in the graphene sheet migrate and arrange in a row, resulting in the fracture of some C–C bonds inside the graphene to form a defect line. However, the failure kinetics of GO has not been systematically investigated.
5, the oxygen atom will induce the transformation of 40% sp2 hybrid C–C bonds into sp3 hybridization.16 Barber et al.17 found that the fracture was induced by unevenly distributed stress near defects and nonuniform distribution of hydroxyl groups. As the number increases, the oxygen atoms in the graphene sheet migrate and arrange in a row, resulting in the fracture of some C–C bonds inside the graphene to form a defect line. However, the failure kinetics of GO has not been systematically investigated.
Although atomic force microscopy (AFM) and in situ tensile tests in transmission electron microscopy (TEM) have been employed to measure the mechanical properties of GO materials,18–20 it is still difficult to understand the structural evolution at atomic scale. Kang et al.21 investigated the elastic modulus of 50–60 nm thickness of GO is 695 ± 53–697 ± 15 GPa by atomic force indentation. Suk et al.6 obtained that the elastic modulus of 1–3 layer GO is 207.7 ± 23.4 GPa and the max stress is 76.8 ± 19.9 MPa by Contact patterns of atomic microscopes with finite element analysis. Robinson et al.22 concluded that the elastic modulus of macro-sized multilayer rGO is 185 GPa. It can be deduced that the present research works are mainly focused on experimental characterizations of the mechanical properties of GO, and the obtained mechanical parameters are quite different. In this work, the ReaxFF potential was adopted to describe the interatomic interactions between C, O and H atom in GO system, and the deformation behaviors and mechanical properties of GO adsorbed with functional hydroxyl and oxygen groups was systematically investigated by molecular dynamics simulations.
Models and computation methods
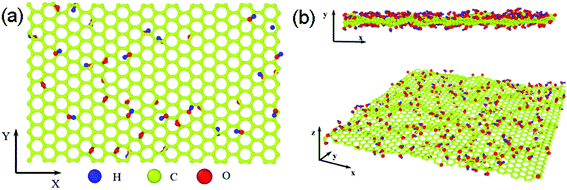
The open source package Large-scale Atomic/Molecular Massively Parallel Simulator (LAMMPS) was used to conduct the MD simulations, in which ReaxFF (reactive force field) was expanded to include the additional transition states and chemical reactivity of C, O and H systems. The ReaxFF provides a useful method to determine the initial oxidation of hydrocarbons under extreme conditions and is developed for carbon, hydrogen, and oxygen atoms in 2008.23The structure of GO sheets has been controversial for decades with uncertainty pertaining to both the type and distribution of oxygen-containing functional groups.24,25 Nuclear Magnetic Resonance study of 13 C-labelled graphene oxide26 support the model proposed by Lerf et al.27,28 in which the basal plane of the sheet is decorated with hydroxyl depoxy (1,2-ether) functional groups. Carbonyl groups also exist, most likely as carboxylic acids along the sheet edge and as organic carbonyl defects within the sheet. In the Lerf–Klinowski model, the rule of lattice order is modified, and amorphous structure of non-stoichiometric ratio is involved. Accordingly, the simulation model of GO was built, as shown in Fig. 1, in which the epoxy and hydroxyl functional groups were randomly distributed on both sides of monolayer GO. Since each carbon atom in the system has a dangling bond, neighboring carbon atom has chance to form epoxy structure by absorbing one oxygen atom. The simulation size is 8 nm × 8 nm, and the thickness is 0.8 nm.29 The periodic boundary conditions (PBCs) is used along all three directions and a vacuum region 30 Å in thickness is added along the three directions to avoid the interactions between the atoms at the opposite edges. The density of epoxide groups, R, is:
 | (1) |
![[thin space (1/6-em)]](https://www.rsc.org/images/entities/char_2009.gif) :
:![[thin space (1/6-em)]](https://www.rsc.org/images/entities/char_2009.gif) 1, which means that the R is larger than 50% when containing epoxy and hydroxyl groups both.30,31
1, which means that the R is larger than 50% when containing epoxy and hydroxyl groups both.30,31
| R | Hydroxyl | Epoxy | C (atoms) |
|---|---|---|---|
| 10% | 420 | 210 | 8400 |
| 20% | 840 | 420 | 8400 |
| 30% | 1260 | 630 | 8400 |
| 40% | 1680 | 840 | 8400 |
| 50% | 2100 | 1050 | 8400 |
All GO sheets are firstly relaxed to equilibrate state in a NVT ensemble with the Nose–Hoover thermostat at 300 K for 2.5 ns. The side and 3D view of relaxed atomic structure of GO with small wrinkles are displayed in Fig. 1b. After that, uniaxial tensile loading is performed on both ends with 2.0 nm from boundaries along the armchair or zigzag orientation of GO sheet in a NPT ensemble with a strain rate of 10−4 ps−1 at 300 K. The layer separation of graphite, 3.4 Å, is taken as the effective thickness of the monolayer graphene32 and a Poisson's ratio of 0.165 is used.33 The axial tensile strain and stress are calculated according to ref. 34. After the stress of each carbon atom is obtained, the stress of the graphene sheet is computed by averaging over all the carbon atoms in the sheet. Then stress–strain curve during tensile deformation is obtained. From the simulated stress–strain curves, elastic modulus E and fracture strain can be obtained:19,20 elastic modulus is calculated as the initial slope of the stress–strain curve; the fracture strain are defined at the point where the peak stress is reached.
Results and discussions
The influence of functional group density
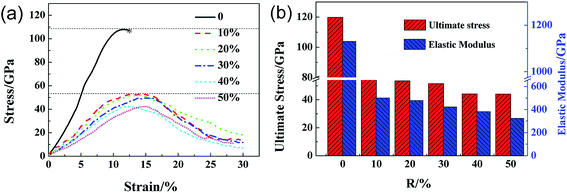
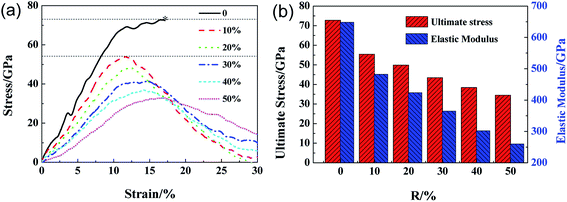
Fig. 2a shows the stress–strain curves of GO sheets with different R loaded along the armchair direction, and Fig. 2b displays the ultimate stress and elastic modulus. For GO with R = 0%, that is, the graphene sheet, the stress increases with strain until fracture at a strain of 12.5%, the ultimate stress and elastic modulus are 110 GPa and 1.2 TPa, respectively, which are consistent with the simulated results by AIREBO potential.21–23 As R increases from 10% to 50%, the ultimate stress significantly reduces down to 55 GPa, close to the theoretical value of 31.3 GPa,9,35 the elastic modulus decreases from 0.5 TPa to 0.3 TPa linearly with the functional group density, which is consistent with the experimental results.16 The atomic structure evolutions are shown in Fig. 3. At the equilibrium state, the system is free of extra stress or distortion (Fig. 3a), but the functional groups usually have higher atomic potential energy. As the strain is increased up to 15.2%, the potential energy of in-plane carbon atoms connecting with functional groups will preferentially absorb the elastic energy and converge into dislocation (Fig. 3b and c), since the numbers of green atoms were increased and gathered along certain crystal orientation to form grain boundaries. Finally, the dislocations in the grain boundaries will further grow into defects or vacancies, resulting in cracks preferentially motivated by red atoms.Fig. 4a shows the stress–strain curves of GO with different R loaded along zigzag direction. The stress–strain curve for GO with R = 0 exhibits double elastic behavior, as reported previously.21 The stress–strain curves of GO become vaulted and show ductile fracture as the R increase from 10% to 50%. As shown in Fig. 4b, both the ultimate stress and elastic modulus of GO decrease with R linearly, until 35 GPa and 0.25 TPa, respectively, which are lower than those tensile loaded along armchair direction. The ultimate strain of GO increases from 11.0% to 15.0% with R, in comparison with the constant counterparts of GO along tensile armchair direction. As shown in Fig. 5, the lattice stress in a higher energy level, and so the defects will expand upon thermal and mechanical vibrations during the deformation process, and converge into dislocation lines, resulting in local cracks (Fig. 5c and d). It can be deduced that the structural stability and mechanical properties of GO will be significantly deteriorated with increasing functional group. The cracks usually initiated and preferentially propagated along the path on which hydroxide and epoxide groups are distributed.
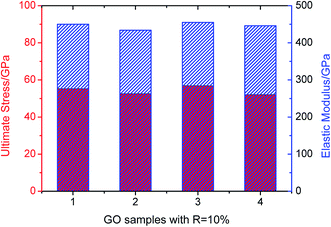
In order to show the impact of different random arrangements of these functional groups to the mechanical properties in the context, we take four samples with the same R = 10% as an example. The samples are loaded along zigzag orientation and the ultimate stress and elastic modulus are shown in Fig. 6. The results indicate that the ultimate stress and elastic modulus changes little as the changing of random arrangements with the average value about 56.5 GPa and 448 GPa respectively.
The influence of different group ratios
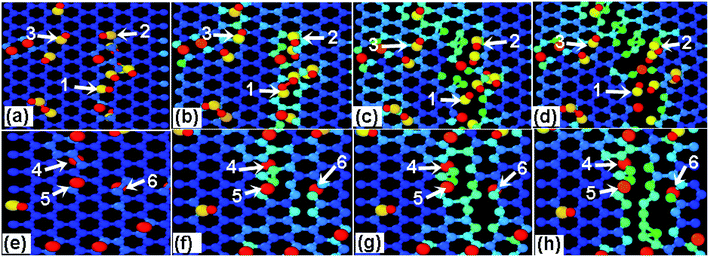
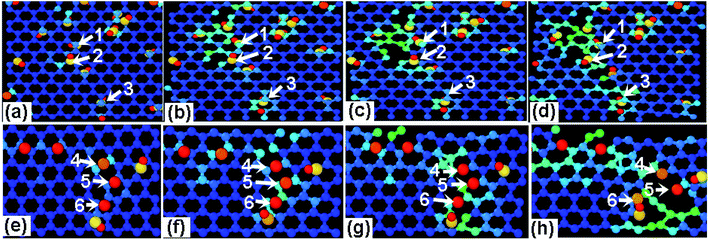
In order to differentiate the effects of functional group species on the failure mechanism of GO, the ratio N of hydroxyl to epoxy functional groups are changed for a given density of 10%, as listed in Table 2. Fig. 7a and b show the stress–strain curves of GO sheets loaded along armchair and zigzag directions, respectively. It is found that the stress–strain curves are independent on the N value, and thus the ultimate stress and elastic modulus change little, indicating that the fracture mechanism of GO sheets is likely insensitive to the adsorbed group type. Fig. 8a–d show the atomic structure of GO sheets with hydroxide group at the strains of 0%, 13.2%, 17.2% and 18.2, and Fig. 7e–h show the results of GO sheets with epoxide groups. Apparently, the hydroxide and epoxide groups lead to a distortion of C–C bonds (Fig. 8a and e), which will be firstly extended along armchair directions into dislocation lines (Fig. 8b and f). The picked lattice sites, 1–3 indicate the pre-broken bonds sp3 hybridized with hydroxide groups, and result in dislocation line along the direction of hydroxide group adsorptions (Fig. 8c and d). For the adsorption of epoxide groups, bond cleavages of epoxide rings, 4–6, leads to more space for adjacent C–C bond rotation, and triangle structures are formed (Fig. 8f and g). The defect accumulations along zigzag direction lead to cracks in GO sheets. The lattice sites are twisted along the direction of aggregated hydroxide groups, while the lattice structures are doped and transformed into large defects through breakage of epoxide carbon–carbon bonds and stress relaxation (Fig. 8f and g). This bond cleavage along a lattice twisted direction is consistent with reported results.33 Cao et al. studied the influence of function groups on the strength of monolayer GO by density functional theory and found that fractures always occur along the direction with hydroxide activated lattice distortion. Once the dislocation lines are formed, fracture and rupture in GO is easily activated, regardless of hydroxide or epoxide groups. Fig. 9 shows the local structural evolution of GO sheets loaded along zigzag direction. For hydroxide groups, fracture is commonly propagating along the adsorption sites, 1–3 (Fig. 9a–d). However, for epoxide groups, epoxide bonds participate in the deformation process through distorted triangle carbon rings, which soften the honeycomb lattices at yield point, leading to rupture along zigzag direction (Fig. 9e–h). In comparison with Fig. 8, epoxide carbon bonds are cleaved, resulting in defects and cracks during the tensile process, while hydroxide carbon bonds will induce the neighboring C atoms to crack along group adsorbed sites.| N | Hydroxyl | Epoxy | R | Atom number |
|---|---|---|---|---|
| 1 | 280 | 280 | 10% | 8400 |
| 2 | 420 | 210 | 10% | 8400 |
| 3 | 504 | 168 | 10% | 8400 |
| 4 | 560 | 140 | 10% | 8400 |
| 5 | 600 | 120 | 10% | 8400 |
| 6 | 630 | 105 | 10% | 8400 |
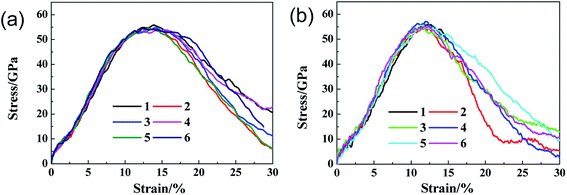 | ||
| Fig. 7 The stress–strain curves of GO with different hydroxide to epoxide group ratios along (a) armchair and (b) zigzag loading directions. | ||
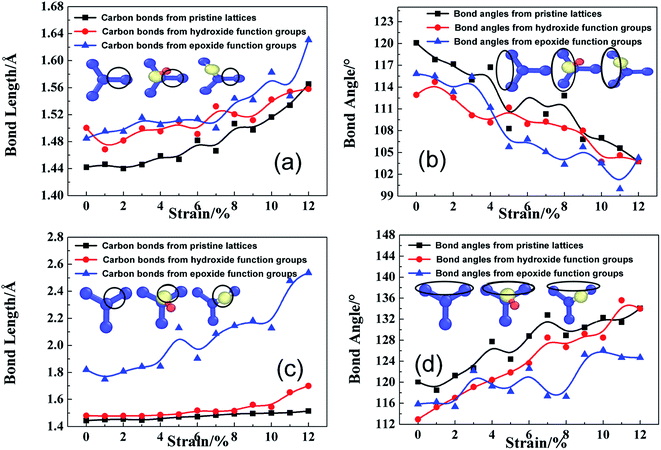
To confirm the failure indeed caused by adsorption-induced bond breakage instead of dislocation-mediated plasticity, the atomic-level structure evolution are monitored and analyzed. Such localized crack indicates that the micro-structure of rGO is very efficient for stress re-distribution. Initially, instead of lattice shearing upon tensile loading along armchair direction and phase transformation along zigzag direction,18 GO sheets experience the similar distortion transformation, regardless of loading modes, as shown in Fig. 10. Bond length and bond angle of adsorption-induced lattice circled by black ring can be divided into three types, first in black line from pristine lattice, second in red line from hydroxide carbons atom, and third in blue line from epoxide carbons, as displayed in the insets of each graph. As shown Fig. 9a, the second and third bond length is statistically 1.48 Å, which is longer than 1.44 Å, indicating a considerable stress concentration (Fig. 4a and 5a). As the tensile deformation increases, the second one increases upon tensile loading, while the third one keep a larger value for pre-breaking action. Correspondingly, the bond angles of the first and second types have the similar trend, but the third type exhibits smaller values (Fig. 10b). The bonds of the second type were vertically bonded with basal plane through single sp3 hybridized C–C bond instead of sp2 hybridization while the third types were triangularly bonded with two carbon atoms through broken sp2 C–C bonds. For the second type, the absorbed hydroxide group will weaken near sp2 carbon bonds by forming newly sp3 C–O bond, increasing the vibration amplitude of central induced carbon spatially along one side of GO sheet in Z-direction to increase structural instability. Strain energy release always occurs along the unstable carbons to form dislocation line as shown in Fig. 8a–d. This leads to the different fracture mechanism of GO sheets under different tensile loading deformations.
Fig. 10c and d indicate similar structural instability induced by epoxide function group, since the third bond length firstly has a large bond length of higher strain energy but slight bond angle variation. At the same time, the second bond length always keeps a slightly larger than pristine ones. Therefore, the third extended bond length induced by epoxide function group will naturally break to form triangle stable structure for defect formation as verified in Fig. 9e–h. Although absorbed function groups of hydroxide and epoxide behaves in a different mode for fracture mechanism of rGO, both have a similar detrimental damage to the structural stability as shown in Fig. 2a and 4a, which can be elucidated by geometric construction transformation and potential energy barrier induced by absorbed function groups.
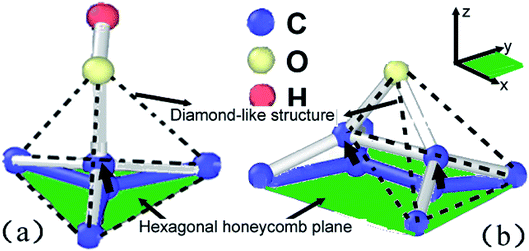
As shown in Fig. 11a, central carbon atom in the lattice cell can be easily activated and move out of the base plane along z axial direction once the hydroxide function group was absorbed and posed a vibrating disturbance on the base plane arrangement. Therefore, some sp2 carbon bonds will be applied strain and then distorted into sp3 carbon bonds, resulting in transformation from honeycomb structures to diamond-like ones, as indicated by dotted lines. As shown in Fig. 10a, the bond length can be furtherly extended to release the extra strain energy. At the same time, the statistical energy increment of central carbon atom can reach 10 eV, higher than adjacent naked carbon atoms, which perturbed the lattice order of planar crystal arrangement. As the straining energy increases, the central carom will be furtherly disassembled to soften and break away from base plane lattice. Furthermore, the absorbed carbon atom in the reverse plane will corporately speed up the softening and separating rates. For epoxide function group as shown in Fig. 10b, the binding carbon atoms adsorbed by oxygen atom also jump out of pristine base plane to form diamond-like structures along z axial direction. However, the extended C–C bond of nearing 1.8 Å is verified in Fig. 10c. Two central diamond-like structures indicated by dotted lines detached each other and subsequently involved in the Stone–Wale defects36,37 as shown in Fig. 8 and 9, since the statistical potential energy of central carbon atom is nearly 20 eV higher than pristine atoms that exceeds the C–C bond rotation energy of 2.1 eV.38 This strain-induced structure transformation of covalent bond is consistent with the results by Pei et al.14 In conclusion, bonding mode change of sp2 to sp3 hybridization and induced structure transformation from honeycomb to diamond-like ones can contribute to the absorbed function groups of different types, has a positive effect on the plasticity while a negative effect on the structure stability, as observed in experiments.36
Conclusions
The mechanical properties of GO with different density of functional groups were investigated by molecular dynamics simulations. The results indicated that both the fracture stress and Young's modulus of GO decreased with function group density from 10% to 50%, the failure was introduced through transformation of sp2 and sp3 hybridization. Investigation of the individual function groups was carried out and the results indicated that: bonding mode change of sp2 to sp3 hybridization and induced structure transformation from honeycomb to diamond-like structure could be contributed to the absorbed function groups of different types. It had a positive effect on the plasticity while a negative effect on the structure stability, as supported by experiments on the mechanical properties of graphene oxide. The kinetic mechanism of GO under different loading modes along armchair or zigzag directions would be positive to guide the wider application of GO based devices.Conflicts of interest
The authors declare that they have no conflict of interests.Acknowledgements
We acknowledge the financial supports of the National Natural Science Foundation of China (Grant No. 51501012, 51771144, 51471130).References
- X. Zhang, X. Fan and H. Li, et al., Facile preparation route for graphene oxide reinforced polyamide 6 composites via in situ anionic ring-opening polymerization, J. Mater. Chem., 2012, 22, 24081–24091 RSC
.
- M. Kim, C. Lee and J. Jyongsik, Fabrication of highly flexible, scalable, and high-performance supercapacitors using polyaniline/reduced graphene oxide film with enhanced electrical conductivity and crystallinity, Adv. Funct. Mater., 2014, 24, 2489–2499 CrossRef CAS
.
- C. Yan, J. H. Cho and J. H. Ahn, Graphene-based flexible and stretchable thin film transistors, Nanoscale, 2012, 4, 4870–4882 RSC
.
- Y. M. Chen, S. T. Hsu and Y. H. Tseng, et al., Minimization of ion-solvent clusters in gel electrolytes containing graphene oxide quantum dots for lithium-ion batteries, Small, 2018, 14, 1703571–1703581 CrossRef
.
- B. C. Brodie, Sur le poids atomique du graphite, Annales de chimie et de physique, 1860, 59, 466 Search PubMed
.
- L. Staudenmaier and Verfahren zur Darstellung der Graphitsure, Ber. Dtsch. Chem. Ges., 1898, 31, 1481–1487 CrossRef CAS
.
- S. William, Hummers Jr and R. E. Offeman, Preparation of Graphite Oxide, J. Am. Chem. Soc., 1958, 80, 1339 CrossRef
.
- Y. W. Zhu, S. Murali and W. W. Cai, et al., Graphene and graphene oxide: synthesis, properties, and applications, Adv. Mater., 2010, 22, 3906–3924 CrossRef CAS
.
- A. B. Bourlinos, D. Gournis and D. Petridis, et al., Graphite oxide: chemical reduction to graphite and surface modification with primary aliphatic amines and amino acids, Langmuir, 2003, 19, 6050–6055 CrossRef CAS
.
- M. J. McAllister, J. L. Li and D. H. Adamson, et al., Single sheet functionalized graphene by oxidation and thermal expansion of graphite, Chem. Mater., 2007, 19, 4396–4404 CrossRef CAS
.
- X. Y. Qi, K. Y. Pu and H. Li, et al., Amphiphilic graphene composites, Angew. Chem., Int. Ed., 2010, 49, 9426–9429 CrossRef CAS PubMed
.
- Q. Y. He, H. G. Sudibya and Z. Y. Yin, et al., Centimeter-long and large-scale micropatterns of reduced graphene oxide films: fabrication and sensing applications, ACS Nano, 2010, 4, 3201–3208 CrossRef CAS PubMed
.
- J. L. Li, K. N. Kudin and M. J. McAllister, Oxygen-driven unzipping of graphitic materials, Phys. Rev. Lett., 2006, 96, 176101–176106 CrossRef PubMed
.
- Q. X. Pei, Y. W. Zhang and V. B. Shenoy, A molecular dynamics study of the mechanical properties of hydrogen functionalized graphene, Carbon, 2010, 48, 898–904 CrossRef CAS
.
- L. Liu, J. Zhang and J. Zhao, Mechanical properties of graphene oxides, Nanoscale, 2012, 4, 5910–5916 RSC
.
- K. A. Mkhoyan, A. W. Contryman and J. Silcox, Atomic and electronic structure of graphene-oxide, Nano Lett., 2009, 9(3), 1058–1063 CrossRef CAS PubMed
.
- C. Wang, M. D. Frogley and G. Cinque, et al., Deformation and failure mechanisms in graphene oxide paper using in situ nanomechanical tensile testing, Carbon, 2013, 63, 471–477 CrossRef CAS
.
- C. H. Cao, D. Matthew and V. S. Chandra, et al., High strength measurement of monolayer graphene oxide, Carbon, 2015, 81, 497–504 CrossRef CAS
.
- T. P. Jeffrey, B. Ted and C. S. George, Computational studies of the structure, behavior upon heating, and mechanical properties of graphite oxide, J. Phys. Chem. C, 2007, 111, 18099–18111 CrossRef
.
- J. W. Zhang and D. Z. Jiang, Molecular dynamics simulation of mechanical performance of graphene/graphene oxide paper based polymer composites, Carbon, 2014, 67, 784–791 CrossRef CAS
.
- H. K. Shao, T. H. Fang and Z. H. Hong, et al., Mechanical properties of free-standing graphene oxide, Diamond Relat. Mater., 2013, 38, 73–78 CrossRef
.
- J. T. Robinson, M. Zalalutdinov and J. W. Baldwin, Wafer-scale reduced graphene oxide films for nanomechanical devices, Nano Lett., 2008, 8, 3441–3445 CrossRef CAS PubMed
.
- T. P. Senftle, S. Hong and M. M. Islam, et al., The ReaxFF reactive force-field: development, applications and future directions, npj Comput. Mater., 2016, 2(1), 15011–15015 CrossRef CAS
.
- C. C. Owen and T. N. SonBinh, Graphene oxide, highly reduced graphene oxide, and graphene: versatile building blocks for carbon-based materials, Small, 2010, 6, 711–723 CrossRef PubMed
.
- A. Clauss, R. Plass and H. P. Boehm, Untersuchungen zur struktur des graphitoxyds, Z. Anorg. Allg. Chem., 2010, 291, 5–6 Search PubMed
.
- T. Nakajima, A. Mabuchi and R. Hagiwara, A new structure model of graphite oxide, Carbon, 1988, 26, 357–361 CrossRef CAS
.
- A. Lerf, H. He and M. Forster, et al., Structure of graphite oxide revisited, J. Phys. Chem. B, 1998, 102, 4477–4482 CrossRef CAS
.
- H. He, J. Klinowski and M. Forster, et al., A new structural model for graphite oxide, Chem. Phys. Lett., 1998, 287, 53–56 CrossRef CAS
.
- C. Chen, Q. H. Yang and Y. Yang, Self-assembled free-standing graphite oxide membrane, Adv. Mater., 2009, 21, 3007–3018 CrossRef CAS
.
- P. Nuengmatcha, R. Mahachai and S. Chanthai, Optimization study of graphene oxide synthesis with improvement of C/O ratio, Asian J. Chem., 2014, 26, 1321–1323 CrossRef CAS
.
- T. Anna, Z. Alberto and A. M. Benito, et al., Revisiting graphene oxide chemistry via spatially-resolved electron energy loss spectroscopy, Chem. Mater., 2016, 28, 3741–3748 CrossRef
.
- G. Cocco, E. Cadelano and L. Colombo, Gap opening in graphene by shear strain, Phys. Rev. B: Condens. Matter Mater. Phys., 2010, 81, 241412–241417 CrossRef
.
- J. Zhou and R. Huang, Internal lattice relaxation of single-layer graphene under in-plane deformation, J. Mech. Phys. Solids, 2008, 56, 1609–1624 CrossRef CAS
.
- X. Liu and Q. S. Yang, Molecular dynamic simulation of mechanical behaviour of RGO produced by thermal reduction method, Micro Nano Lett., 2017, 12(9), 638–642 CrossRef CAS
.
- O. V. Yazyev and S. G. Louie, Topological defects in graphene: Dislocations and grain boundaries, Phys. Rev. B: Condens. Matter Mater. Phys., 2010, 81, 195420–195425 CrossRef
.
- E. Cockayne, G. M. Rutter and N. P. Guisinger, et al., Grain boundary loops in graphene, Phys. Rev. B: Condens. Matter Mater. Phys., 2010, 83, 195425–195429 CrossRef
.
- Y. J. Sun, F. Ma and D. Y. Ma, et al., Stress-induced annihilation of Stone–Wales defects in graphene nanoribbons, J. Phys. D: Appl. Phys., 2012, 45, 305303–305306 CrossRef
.
- O. A. Shenderova, D. W. Brenner and A. Omeltchenko, et al., Atomistic modeling of the fracture of polycrystalline diamond, Phys. Rev. B: Condens. Matter Mater. Phys., 2010, 61, 3877–3883 CrossRef
.
Footnote |
| † These authors contributed equally to this work. |
| This journal is © The Royal Society of Chemistry 2020 |

