
 Open Access Article
 This Open Access Article is licensed under a Creative Commons Attribution-Non Commercial 3.0 Unported Licence
Phosphorus/nitrogen co-doped and bimetallic MOF-derived cathode for all-solid-state rechargeable zinc–air batteries †
Xing Yang‡
 a,
Xianghua Wu‡a,
Zeping Guoa,
Qingyu Libe,
Hongqiang Wang*be,
Chujun Kea,
Wei Zenga,
Xiafei Qiua,
Yun He*ae,
Xiaoguang Liang*abd and
Yoonseob Kimc
a,
Xianghua Wu‡a,
Zeping Guoa,
Qingyu Libe,
Hongqiang Wang*be,
Chujun Kea,
Wei Zenga,
Xiafei Qiua,
Yun He*ae,
Xiaoguang Liang*abd and
Yoonseob Kimc
aDepartment of Physics, Guangxi Normal University, Guilin, China
bGuangxi Key Laboratory of Low Carbon Energy Materials, Guangxi Normal University, Guilin, China
cDepartment of Chemical and Biological Engineering, Hong Kong University of Science and Technology, Clear Water Bay, Kowloon, Hong Kong SAR, China
dGuangxi Key Laboratory of Nuclear Physics and Technology, Guangxi Normal University, Guilin, China
eState Key Laboratory for Chemistry and Molecular Engineering of Medicinal Resources, Guangxi Normal University, Guilin, China
First published on 10th September 2020
Abstract
With the merits of high safety and energy density, all-solid-state zinc–air batteries possess potential applications in flexible and wearable electronic devices. Especially, the air cathodes with bifunctional catalytic activity, i.e. oxygen reduction reaction (ORR) and oxygen evolution reaction (OER) have been received enormous attention. In this work, we provide a novel phosphorus/nitrogen co-doped and bimetallic metal–organic framework (MOF)-derived cathode configurated with phosphorus-doped bimetallic FeNi alloys and a nitrogen-doped porous carbon layer loaded on graphene (P–FeNi/NC@G). The P–FeNi/NC@G electrode exhibits a superior OER activity with an overpotential of 310 mV at 10 mA cm−2 and an ORR performance with a half-wave potential of 0.81 V. With P–FeNi/NC@G as the air cathode, the integrated all-solid-state rechargeable zinc–air battery presents a high open-circuit voltage of 1.53 V, a high peak power density of 159 mW cm−2, a small charge–discharge voltage gap of 0.73 V at 5 mA cm−2, as well as excellent long-term stability up to 144 cycles. This work not only expands the air cathode materials database but also develops a new co-doped synthesis method that can be utilized to fabricate a cathode with promoted catalytic efficiency, resulting in improved performance for an all-solid-state zinc–air battery.
Introduction
Being cost-effective and environmental-friendly, and having a high theoretical specific energy density of 1086 W h kg−1, the zinc–air battery (ZAB) is one of the most promising alternatives to the Li battery.1–3 Generally, the ZAB is a half-open system consisting of an air cathode which can consume oxygen from the atmosphere, electrolyte, and zinc anode.4,5 By employing an all solid electrolyte endowed with excellent mechanical properties and ion conductivity, the assembled all-solid-state rechargeable ZAB has been extensively investigated as an appealing power source for wearable and flexible electronic devices.6–9 However, the inadequate catalytic activity of air cathodes during the charging (OER) and discharging (ORR) process greatly hinders their practical application.10–13 Inspired by the notable electrocatalytic activity, noble metal-based catalysts are the first consideration for air cathodes, such as Pt/C for OER and Ir-/Ru-based oxides for the ORR. But, their high cost and insufficient catalytic bifunctionality cannot support a sustainable operation system of all-solid-state rechargeable ZABs.14 Thus, a large amount of effort has been devoted to seeking non-precious metal cathodes with bifunctional and effective catalytic activities to address this challenge.15Benefiting from the configuration of transition metals (e.g., Fe, Co, Ni) and organic ligands with enriched heteroatoms (e.g., N, S, B), MOFs provide a rich treasure for intentional designing of bifunctional and effective non-precious metal catalysts toward application in ZABs as air cathodes.16–20 As sacrificial precursors during a facile pyrolysis process, the MOF-derived nanostructured-metals/metal-based compounds coupled with heteroatoms-doped porous carbonaceous materials can be obtained, resulting in a synergistically enhanced OER and ORR performance.21 For example, the Co–N/C nanoparticles stringed with carbon fibers were synthesized by electrospun and the pyrolysis of ZIF-67, showing a superior ORR activity due to the large surface areas.22 Also, the MOF-derived hybrid cobalt/cobalt nitride nanoparticles integrated with nitrogen-doped carbon nanoarrays (Co/CoNx–NC) can be utilized as an active and durable air cathode for all-solid-state rechargeable zinc–air batteries, exhibiting excellent bifunctional catalytic properties toward ORR and OER.23 Moreover, the single-site dispersion of Fe–Nx species on porous nitrogen-doped carbon layer (Fe–Nx–NC) as MOF derivatives can implement superior catalytic activity with half-wave potential of 0.86 V for ORR and an overpotential of 390 mV at 10 mA cm−2 for OER, and consequently a high power density of 118 mW cm−2 for all-solid-state rechargeable zinc–air battery.24 Compared with the above-mentioned monometal-based catalysts, the bimetallic catalyst such as FeNi-based catalysts has been demonstrated to possess outstanding bifunctional electrocatalytic activity recently due to their sufficient active sites and high conductivity.25–28 It is therefore rationally deduction that the multimetallic MOFs can be further engineered to provide abundant and novel bifunctional catalysts with robust catalytic efficiency.29
Herein, we synthesize a co-doped and MOF-derived bifunctional catalyst of P–FeNi/NC@G by taking the FeNi-containing bimetallic MOF (FeNi-MOFs) as a precursor and the phosphonitrilic chloride trimer as dopant source during the optimized pyrolysis process. It exhibits a large OER activity with an overpotential of 310 mV at 10 mA cm−2 and the ORR performance with a half-wave potential of 0.81 V. The all-solid-state zinc–air battery with P–FeNi/NC@G air cathode, the solid electrolyte of poly(vinyl alcohol) (PVA), and the anode of zinc foil, presents an enhanced performance. These results show the promising applications of multimetallic MOF-derived bifunctional catalysts with efficient catalytic activities in all-solid-state rechargeable zinc–air batteries.
Experimental
Chemicals
Iron(III) nitrate nonahydrate (Fe(NO3)3·9H2O), N,N-dimethylformamide (DMF, Mw = 73.09), nickelous nitrate (Ni(NO3)2·6H2O), 2-methylimidazole (Mw = 82.10), and trimesic acid (Mw = 210.14) were purchased from XiLong Scientific. PVA (Mw = 195000) was bought from Macklin. Reduced Graphene Oxide (RGO) Dispersion was purchased from Chengdu Organic and Chemical Co., Ltd. Chinese Academy of Sciences. Phosphonitrilic chloride trimer (Mw = 347.7) and Nafion (5 wt%) were purchased from Aladdin. Commercial platinum/carbon (Pt/C) with platinum of 20 wt% was bought from Johnson Matthey. Ruthenium oxide powder with an average particle size of less than 10 nm was purchased from Jiangxi Ketai Advanced Materials Co., Ltd.Synthesis of FeNi-MOFs
The FeNi-containing bimetallic MOFs were synthesized by the hydrothermal method. Firstly, the 840 mg of trimesic acid and 220 mg of 2-methylimidazole were slowly added into a solution with 808 mg of Fe(NO3)3·9H2O and 582 mg of Ni(NO3)2·6H2O, and 60 mL of DMF. After half an hour of stirring, the transparent mixture was transferred to a teflon-lined stainless-steel autoclave and maintained at 170 °C for 48 h within an electric oven. After cooling down to room temperature naturally, the precipitates were collected and rinsed with ethanol six times to remove the residual organic matter, followed by drying at 60 °C for 8 h in a vacuum oven. The obtained brown powders denoted as FeNi-MOFs were pyrolyzed at 900 °C for 5 h with a temperature ramping of 5 °C min−1 under an argon atmosphere, and then the final products were labeled as FeNi-MOF-pyrolysis as the control group.Synthesis of P–FeNi/NC@G
Typically, 0.5 g of FeNi-MOFs was added to 20 mL of ethanol followed by stirring for 20 min at room temperature. Then, 10 mL of RGO dispersion and 0.5 g of phosphonitrilic chloride trimer were successively dripped into the mixture and stirred for 1 h. The mixture was then moved to the water bath and stirred at 80 °C until the precipitates were formed because of the full evaporation of the solvent. Further, the powders were placed in a tube furnace and annealed at 900 °C and 1000 °C separately for 5 h with a temperature ramping of 5 °C min−1 under the argon environment.Material characterization
Scanning Electron Microscopy (SEM) images were obtained on Quanta 200 FEG. Transmission Electron Microscopy (TEM) and energy-dispersive spectroscopy (EDS) mapping analyses were carried out on a FEI Tecnai G2 F30 field-emission electron microscope. X-ray diffraction (XRD, Rigaku Mini Flex 600, Cu Kα radiation, λ = 1.54056 Å) was used to evaluate the crystal structure of fabricated samples. X-ray photoelectron spectroscopy (XPS) was carried out on the EscaLab 250Xi X-ray photoelectron spectrometer with an Al Kα excitation source.Electrochemical measurements
Electrochemical measurements were performed with a CHI 760E electrochemical workstation coupled with a PINE rotating instrument in a standard three-electrode set up consisting of a working electrode of rotating disk electrode (RDE, 5 mm in diameter), reference electrode of Ag/AgCl (3.0 M KCl), as well as the counter electrode of Pt plate. In this work, all experiments were conducted at room temperature. Also, the tested potentials were converted to a reference scale of reversible hydrogen electrode (RHE) by Evs RHE = E (Ag/AgCl) + 0.059 × pH + 0.210. Unless otherwise stated, iR compensation profiles were used to correct all measurements. In the experiment, all electrochemical measurements were performed under the same load quality. The catalyst ink was prepared by dispersing 5 mg of active materials in a mixture solution of 800 μL of DI water, 200 μL of ethanol, and 20 μL of Nafion solution followed by ultrasonication for 30 min. Then, 10 μL of catalyst ink with 0.26 mg cm−2 of mass loading was dropped onto the polished glass carbon surface of the working electrode and drying at 27 °C in air. As a comparison, the Pt/C and RuO2 hold the same catalyst mass loading. Before testing, the oxygen- or nitrogen-saturated 0.1 M KOH solution was obtained by injecting oxygen or nitrogen stream for 30 min. Also, the 100 cycles of cyclic voltammetry (CV) were performed with a scanning rate of 50 mV s−1 to activate the electrode.As for ORR measurements, the polarization curves of linear sweep voltammetry (LSV) were recorded in oxygen- or nitrogen-saturated 0.1 M KOH solution at a scan rate of 5 mV s−1 under different rotating speeds (400 rpm, 800 rpm, 1200 rpm, 1600 rpm). For OER measurements, the LSV polarization curves were executed by using RDE (1600 rpm) as a scan rate of 5 mV s−1 in an oxygen-saturated 0.1 M KOH solution. Additionally, the stabilities of ORR and OER were determined by LSV measurements conducted before and after 1000 CV cycles under the scan rate of 100 mV s−1. Electrochemical Impedance Spectroscopy (EIS) measurements were performed with a frequency ranging from 0.1 Hz to 100 kHz. To evaluate the electron transfer number (n) per O2 molecule in the ORR process, the Koutecky–levich (K–L) equation as below was used.
| B = 0.2nFC0D02/3ν−1/6 |
![[thin space (1/6-em)]](https://www.rsc.org/images/entities/char_2009.gif) 485 C mol−1), C0 represents the saturated concentration of O2 in 0.1 M KOH (1.2 × 10⁻⁶ mol cm−3), D0 stands for diffusion coefficient of O2 in 0.1 M KOH (1.9 × 10⁻⁵ cm2 s−1), v is the kinetic viscosity of 0.1 M KOH (0.01 cm2 s−1).
485 C mol−1), C0 represents the saturated concentration of O2 in 0.1 M KOH (1.2 × 10⁻⁶ mol cm−3), D0 stands for diffusion coefficient of O2 in 0.1 M KOH (1.9 × 10⁻⁵ cm2 s−1), v is the kinetic viscosity of 0.1 M KOH (0.01 cm2 s−1).
Assembly of all-solid-state rechargeable zinc–air and performance testing
The air electrode was constructed from carbon cloth loaded with P–FeNi/NC@G catalyst. Firstly, 10 mg of P–FeNi/NC@G powders were added into a mixture of 800 μL of DI water, 200 μL of ethanol, and 20 μL of Nafion, followed by sonication for 30 min at room temperature to achieve a slurry state. Then, the obtained slurry was uniformly spread on a cleaned carbon cloth with a size of 1 × 3 cm2, followed by drying automatically for 24 h in air. The ratio of the air electrode for the zinc–air battery is the same as P–FeNi/NC@G. The fabrication of commercial Pt/C–RuO2 based air electrode has the same procedures. For the electrolyte with the capacity of hydroxide anion transferring, 1 g of PVA was dispersed into 10 mL of DI water, followed by heating at 95 °C for 45 minutes in a water bath. Then, 1 mL of 18 M KOH and 0.02 M zinc acetate were added into the gelatinous mixture and stirred for another 30 min at 95 °C. Before the assembly of the zinc–air battery, the mixture should be frozen at −20 °C for 2 h in a refrigerator. The polished zinc foil with a thickness of 0.3 mm and an area of 1 × 3 cm2 was employed as the anode. Finally, charge–discharge polarization and galvanostatic tests of the integrated all-solid-state zinc–air battery were measured by using the electrochemical workstation (CHI 760E, Chenhua) and LAND 2001A battery test system at room temperature, respectively.Results and discussion
Fig. 1 shows the synthesis procedures of the co-doped and MOFs-derived catalyst denoted as P–FeNi/NC@G. By using the hydrothermal method, the cuboidal FeNi-MOFs with uniform length of size of 35 μm are synthesized successfully, demonstrated by the XRD pattern with typical characteristic peaks of Fe- and Ni–MOFs,30 as illustrated in Fig. S1 and S2.† Taking the phosphonitrilic chloride trimer as a dopant source, the P–FeNi/NC@G catalyst is obtained by the pyrolysis of FeNi–MOF precursor in a tube furnace. Fig. S3† presents the XRD pattern of P–FeNi/NC@G catalyst in which the typical peaks of P–Fe and P–Ni can be confirmed.29,31 It is noted that the addition of graphene can facilitate a fast electron transfer in the catalyst.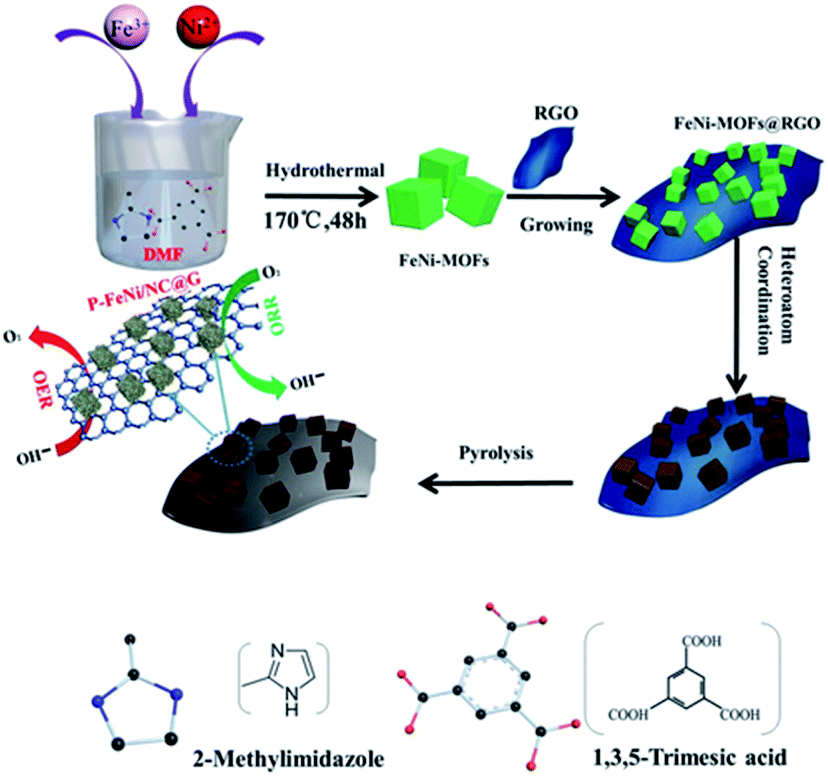 | ||
| Fig. 1 Schematic illustration of synthetic strategy of P–FeNi/NC@G. | ||
In order to evaluate the micromorphology and microstructure of the P–FeNi/NC@G catalyst, the SEM and TEM measurements are employed. Fig. 2a depicts the SEM image of the P–FeNi/NC@G catalyst, in which P–FeNi nanoparticles with an average size of 100 nm marked by dotted red circle uniformly wrapped by the porous graphitic carbon layers. The detailed micromorphology of the single P–FeNi nanoparticles, multilayered graphene, and graphitic carbon layer are displayed in Fig. 2b. Fig. 2c is a high-magnification TEM image of the area marked by the dotted red circle in Fig. 2b. It can be seen that the single P–FeNi nanoparticle is tightly coupled with the graphitic carbon layer, revealing a feasible synergistic effect as a bifunctional catalyst in the zinc–air battery. Thereafter, the microstructure of the dotted red circle marked area in Fig. 2c is investigated by high-resolution TEM (HRTEM), as shown in Fig. 2d. The graphitic carbon layer with a typical interplanar distance of 0.35 nm corresponding to the (002) plane is observed.20,32 Also, the EDS elemental mapping images of the graphitic carbon layer in Fig. S4† indicate that N has been doped into the carbon framework homogeneously. Because of the similar size of N in comparison to the C atom, the interplanar distances of graphitic carbon are not remarkably changed with N-doping.33 Conversely, a larger lattice spacing value of 0.223 nm can be clearly confirmed in comparison to Ni2P with a lattice spacing value of 0.21 nm in (111) plane, which can be attributed to the substitution of Ni by Fe in FeNi–P.34 The corresponding EDS mapping images also present a uniform distribution of Fe, Ni, and P elements, as shown in Fig. 2e–h.
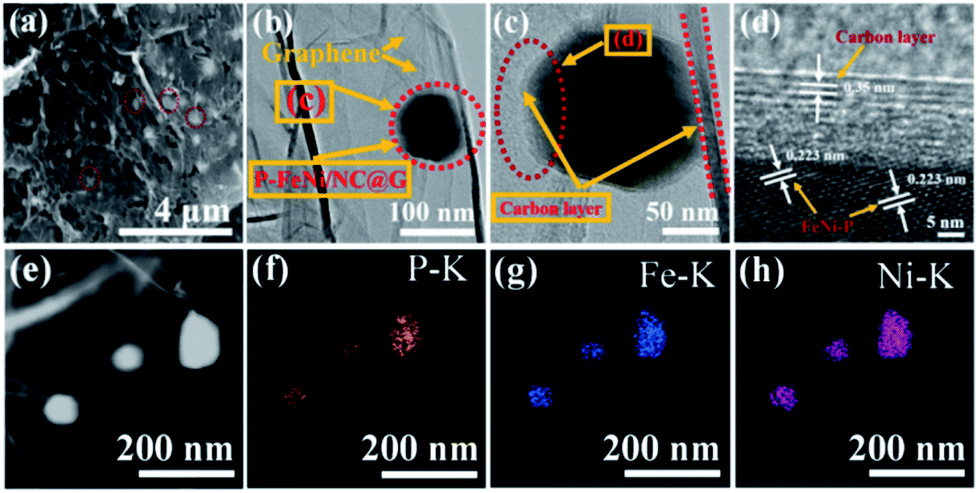 | ||
| Fig. 2 Electron microscopy images of P–FeNi/NC@G. (a) SEM image. The area marked with a dotted red circle are the P–FeNi particles. (b) Low-magnification TEM image. The area marked with a dotted red circle is FeNi–MOF-derived P-doped FeNi and N-doped carbon layer. The graphene regions are also lined out. (c) High-magnification TEM image of the marked area in (b) and the carbon layer is labeled. (d) HRTEM image of the red dash circle in (c) with the d-spacing values of the carbon layer and P–FeNi. (e–h) TEM image and the corresponding EDS mapping images of P–FeNi/NC@G with the elements of P, Fe, Ni. | ||
Further, XPS measurement is employed to examine the surface chemical states of the as-synthesized P–FeNi/NC@G sample. Fig. 3a shows the XPS spectrum of Fe 2p with six deconvoluted peaks, among which the main peaks at 710.2 eV and 724.54 eV correspond to Fe 2p1/2 and Fe 2p3/2 orbitals and the peaks at 707.2 eV and 719.8 eV can be attributed to Fe3+ species in the FeNi–P compound.35,36 In addition, the main peak of Fe 2p3/2 can be further incorporated by different oxidation states of iron, and thus resulting in the presence of peaks at 711.4 eV and 713.3 eV.26,27 As illustration of the Ni 2p spectrum in Fig. 3b, the peaks at 852.9 eV, 853.8 eV and 870.2 eV can be attributed to Niδ+ species in the Ni–P compound and the peak at 856.9 eV correspond to the Ni3+ 2P3/2,29,36 while the peak at 855.7 eV is assigned to metallic Ni in Ni 2p.30 For P 2p spectrum in Fig. 3c, the peaks at 129.46 eV and 131.83 eV can be assigned to the FeNi–P compound and P–C bonding,36 while the peaks at 132.38 eV and 133.6 eV belong to P–O bonding because of the oxidization of P in the air.29 As shown in Fig. 3d, the N 1s spectrum is deconvoluted into five peaks, corresponding to the pyridinic N (398.2 eV), pyrrolic N (399.7 eV and 400.2 eV), quaternary N (401.14 eV), as well as oxidized pyridinic N (402.2 eV), respectively.26,27 It has been considered widely that the existence of pyridinic N, pyrrolic N, and the quaternary N can promote the electrocatalytic activity of ORR and OER.
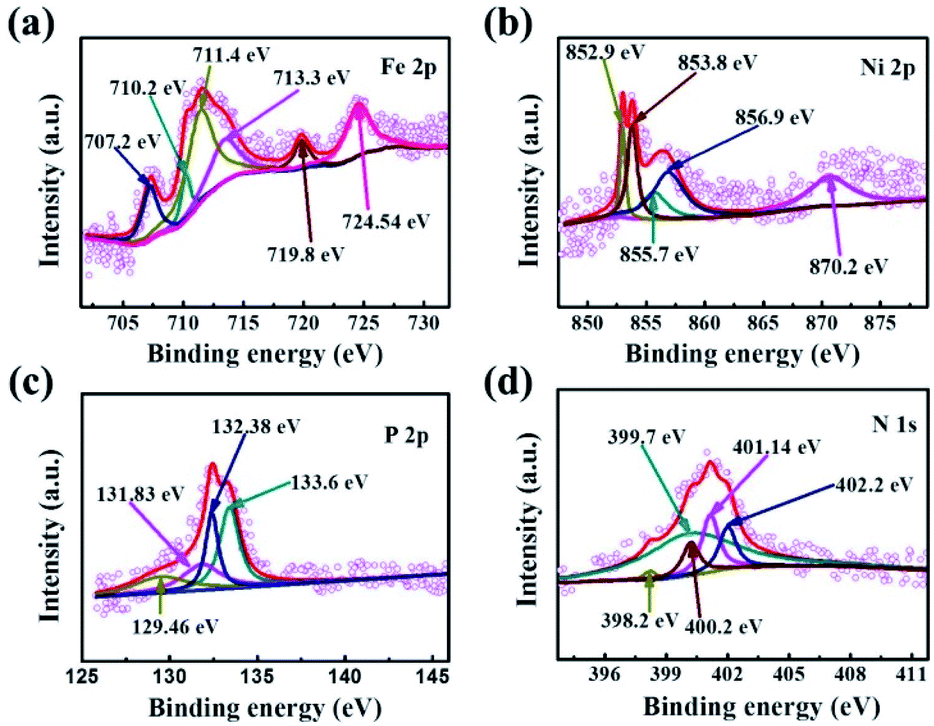 | ||
| Fig. 3 XPS spectra of the P–FeNi/NC@G. (a) Fe 2p, (b) Ni 2p, (c) P 2p, (d) N 1s. | ||
To assess the ORR and OER bifunctional capability of P–FeNi/NC@G catalyst, the electrochemical measurements and related calculations are conducted in 0.1 M KOH solution, and the FeNi-MOFs, FeNi-MOF pyrolysis, commercial Pt/C and RuO2 are also selected as control groups. Initially, as shown in Fig. 4a, the CV curve of P–FeNi/NC@G obtained in O2-saturated 0.1 M KOH exhibits a distinct oxygen reduction peak at 0.8 V vs. RHE as compared to the CV curve recorded in N2-saturated 0.1 M KOH, indicating an effective oxygen reduction activity of the as-fabricated catalyst. Furthermore, it can be confirmed that the P–FeNi/NC@G catalyst pyrolyzed at 900 °C exhibits a better oxygen redox performance than the catalyst synthesized at 1000 °C (Fig. S5†), which can be attributed to the deficient N-doping amount at high pyrolysis temperature.37 For the electrocatalytic property of P–FeNi/NC@G catalyst towards ORR, the LSV measurements are carried out by using the RDE at a rotating speed of 1600 rpm in an O2-saturated 0.1 M KOH, as shown in Fig. 4b. Because of the instability in aqueous solution, FeNi-MOFs present the lowest half-wave potential (E1/2) of 0.69 V vs. RHE among all catalysts. After the pyrolysis process of FeNi-MOFs, the half-wave potential of FeNi-MOF-pyrolysis slightly increases to 0.71 V vs. RHE due to the formation of the graphitic carbon layer, but the catalytic activity of FeNi particles is still inert. Comparatively, the P–FeNi/NC@G catalyst shows a half-wave potential of 0.81 V vs. RHE even close to commercial Pt/C (E1/2 = 0.84 V vs. RHE), which can be ascribed to the synergistic effects enabled by P–FeNi nanoparticles with high activity/stability, defect-rich N-doped carbon with abundant reactive sites, as well as the graphene with enhanced electron conductivity.38,39 To further investigate the ORR kinetics of P–FeNi/NC@G catalyst, LSV curves are recorded at different rotating speeds from 400 rpm to 1600 rpm in O2-saturated 0.1 M KOH, as shown in Fig. 4c. It can be seen that the current density increases with the increasing of rotating speed, revealing a first-order reaction toward oxygen reduction, which also can be demonstrated by the corresponding K–L plots, as presented of the inset in Fig. 4c. By calculation of the slopes of the K–L plots, the electron transfer number per oxygen molecule (n) values for P–FeNi/NC@G, FeNi-MOFs, FeNi-MOF-pyrolysis, and the Pt/C catalysts are approximately equal to 4, 2, 2, and 4, respectively, as shown in Fig. S6.† The four-electron transfer pathway for P–FeNi/NC@G catalyst similar to the commercial Pt/C illustrates a high catalytic efficiency and low by-products during the ORR process.
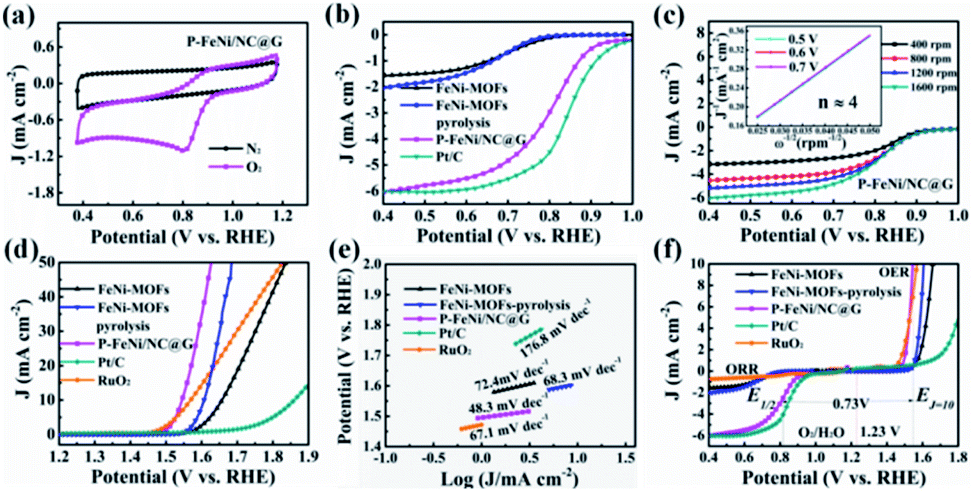 | ||
| Fig. 4 (a) CV curves of P–FeNi/NC@G catalyst tested in N2 and O2-saturated 0.1 M KOH with a scan rate of 20 mV s−1. (b) ORR polarization curves of different catalysts recorded at 1600 rpm in O2-saturated 0.1 M KOH with 5 mV s−1. (c) Polarization curves of P–FeNi/NC@G tested in O2-saturated 0.1 M KOH at different rotating speeds from 400 rpm to 1600 rpm with 5 mV s−1. The inset shows the corresponding K–L plots of P–FeNi/NC@G catalyst under different potential. (d) OER polarization curves of different catalysts tested in O2-saturated 0.1 M KOH at 1600 rpm with 5 mV s−1 and iR compensation. (e) The corresponding Tafel Plots derived from (d). (f) Overall polarization curves of different catalysts tested through the whole ORR and OER region in 0.1 M KOH. | ||
As another key performance indicator for catalysts, the OER polarization curves are studied in 0.1 O2-saturated 0.1 M KOH at 1600 rpm, as shown in Fig. 4d. In line with previous studies, the commercial Pt/C catalyst displays a poor OER property with an overpotential of 630 mV at a current density of 10 mA cm−2.26 Because of the OER catalytic activity of FeNi particles, the overpotential of FeNi-MOF-pyrolysis (370 mV) at the current density of 10 mA cm−2 outperforms that of FeNi-MOFs (420 mV), but lower than RuO2 (330 mV). For the P–FeNi/NC@G catalyst, it just requires an overpotential of 310 mV to drive the current density of 10 mA cm−2 due to the superior catalytic activity of P–FeNi species.29 The presentation of high-efficient catalytic performance and the rapid OER reaction kinetics for P–FeNi/NC@G catalyst can be further confirmed by the smallest Tafel slope value of 48.3 mV dec−1, as shown in Fig. 4e. Moreover, the bifunctional catalytic activities can be evaluated by the potential difference (ΔE) between OER potential at the current density of 10 mA cm−1 (Ej=10) and the E1/2 for ORR in the whole ORR and OER polarization region, as shown in Fig. 4f. The low ΔE value of 0.73 V for P–FeNi/NC@G (ΔE = Ej=10 – E1/2) as compared to other catalysts (Table S1†) obviously indicates an excellent bifunctional catalytic performance.
In order to lay out the origin of the outstanding bifunctional catalytic performance, the electrochemical double-layer capacitance (Cdl) and EIS are employed to identify the catalytic active sites and the charge conductivity characteristic. The Cdl proportionated to the electrochemically active surface area (ECSA) can be calculated by performing CV measurement at different scan rates (10–50 mV s−1) in the non-faradaic processes.40 As illustrated in Fig. S7,† the Cdl value of P–FeNi/NC@G reaches a maximum of 6.2 mF cm−2, outperforming the Cdl values of FeNi-MOFs (1.38 mF cm−2) and FeNi-MOF-pyrolysis (2.14 mF cm−2). These results evidently demonstrate that the P–FeNi/NC@G catalyst possesses large catalytic active sites contributed from the MOF-derived porous framework. Furthermore, as shown in Nyquist plots in Fig. S8,† the P–FeNi/NC@G catalyst exhibits the lowest charge transfer resistance as compared with FeNi-MOFs and FeNi-MOF-pyrolysis, which can be attributed to the efficient charge transfer pathways generated by graphene during the ORR and OER process.41 Finally, the ORR and OER polarization curves recorded before and after 1000 CV cycles are analyzed to assess the stability of P–FeNi/NC@G catalyst, as shown in Fig. S9.† It can be seen that the half-wave potential of ORR only decreases by about 10 mV after 1000 CV cycles, whereas, there is not any significant degradation of overpotential for ORR. Consequently, the P–FeNi/NC@G catalyst with outstanding bifunctional catalytic activity enables its promising application in all-solid-state rechargeable ZAB as air cathode.
As shown in Fig. 5a, the all-solid-state rechargeable ZAB is constructed by the air cathode of carbon cloth loaded with catalyst, the electrolyte of PVA, and the anode of zinc plate, forming a sandwich structure. It can be seen in Fig. 5b that a high open-circuit voltage of 1.53 V for ZAB with P–FeNi/NC@G catalyst as air electrode is achieved, much higher than that of ZAB with commercial Pt/C–RuO2 mixed catalyst (1.42 V). Similarly, as shown in Fig. 5c, the discharge polarization curve of the all-solid-state ZAB with P–FeNi/NC@G catalyst also exhibits a higher power density of 159 mW cm−2 as compared to ZAB Pt/C–RuO2 mixed catalyst with a higher power density of 106 mW cm−2. Meanwhile, as compared with Pt/C–RuO2 mixed catalyst, the ZAB with P–FeNi/NC@G catalyst presents a small charge–discharge voltage gap, as shown in Fig. 5d. Additionally, the long-term rechargeability of all-solid-state ZAB with P–FeNi/NC@G is evaluated by galvanostatic discharge–charge at a current density of 5 mA cm−2. As shown in Fig. 5e, the ZAB with P–FeNi/NC@G exhibits a narrow discharge–charge gap of 0.73 V as well as excellent durability, outperforming the Pt/C–RuO2-based ZAB. Indeed, these outstanding battery performances can be attributed to the co-doped and MOF derived P–FeNi/NC@G air cathode, and thus can be comparable to those of recently reported all-solid-state ZABs listed in Table S2.† Eventually, the light-emitting diodes (LEDs) are completely lighted up by the assembled all-solid-state rechargeable ZAB with P–FeNi/NC@G, as illustrated in Fig. 5f.
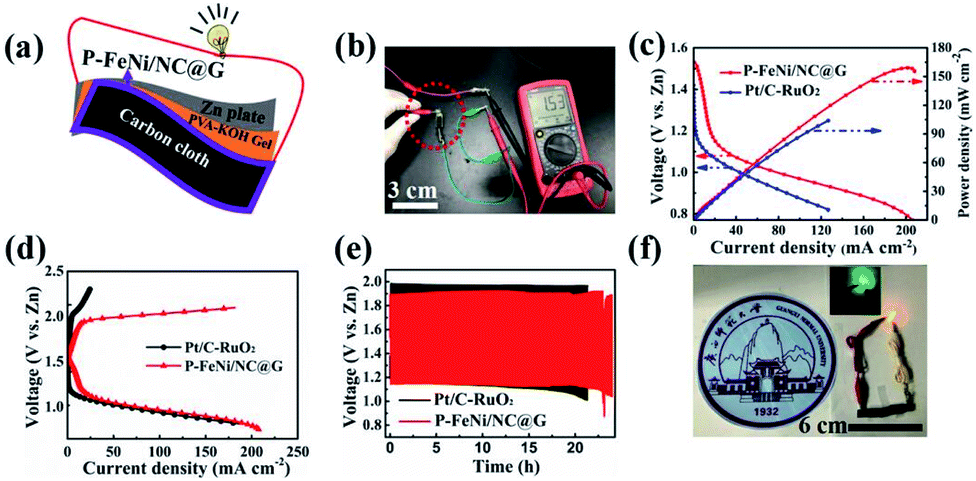 | ||
| Fig. 5 (a) Schematic illustration of all-solid-state rechargeable ZAB. (b) Open-circuit voltage of all-solid-state rechargeable ZAB with P–FeNi/NC@G catalyst as air cathode. (c) Discharge polarization and the corresponding power density curves of all-solid-state rechargeable ZAB equipped with P–FeNi/NC@G and Pt/C–RuO2 catalyst. (d) Charge and discharge polarization curves of P–FeNi/NC@G and Pt/C–RuO2 catalysts. (e) Galvanostatic discharge–charge cycling curves at 5 mA cm−2 of the all-solid-state rechargeable ZAB constructed with the P–FeNi/NC@G bifunctional catalyst and Pt/C–RuO2 mixed catalysts. (f) Photograph of LED powered by two ZABs in series. | ||
Conclusions
In summary, a novel phosphorus/nitrogen co-doped and FeNi-MOF-derived P–FeNi/NC@G bifunctional catalyst act as the air cathode in the all-solid-state rechargeable zinc–air battery is provided. The P–FeNi/NC@G electrode not only exhibits a superior OER activity with an overpotential of 310 mV at 10 mA cm−2 but also the ORR performance with a half-wave potential of 0.81 V. Further, the assembled all-solid-state zinc–air battery with P–FeNi/NC@G catalyst as air cathode presents a high open-circuit voltage of 1.53 V, a high peak power density of 159 mW cm−2, a small charge–discharge voltage of 0.73 V at 5 mA cm−2, as well as the excellent long-term stability up to 144 cycles. This work shows a great promising application of the co-doped and multimetallic MOF-derived bifunctional catalysts in all-solid-state rechargeable zinc–air batteries.Conflicts of interest
The authors declare no competing financial interests.Acknowledgements
This research was financially supported by the Special Funding for Overseas Talents in Guangxi (RZ2000001585), the Funding of Guangxi Key Laboratory of Low Carbon Energy Materials (RZ1900005893), Natural Science Foundation of Guangxi Province (2018GXNSFBA281003, RZ2000002140), and Innovation Project of Guangxi Graduate Education (XYCSZ2020049, XJGY2020017).Notes and references
- X. Zhong, W. Yi, Y. Qu, L. Zhang, H. Bai, Y. Zhu, J. Wan, S. Chen, M. Yang, L. Huang, M. Gu, H. Pan and B. Xu, Appl. Catal., B, 2020, 260, 118188 CrossRef CAS.
- Y. Li, J. Fu, C. Zhong, T. Wu, Z. Chen, W. Hu, K. Amine and J. Lu, Adv. Energy Mater., 2019, 9, 1802605 CrossRef.
- H. Li, L. Ma, C. Han, Z. Wang, Z. Liu, Z. Tang and C. Zhi, Nano Energy, 2019, 62, 550–587 CrossRef CAS.
- P. Xu, W. Chen, Q. Wang, T. Zhu, M. Wu, J. Qiao, Z. Chen and J. Zhang, RSC Adv., 2015, 5, 6195–6206 RSC.
- Q. Liu, Z. Chang, Z. Li and X. Zhang, Small Methods, 2018, 2, 1700231 CrossRef.
- H. Miao, B. Chen, S. Li, X. Wu, Q. Wang, C. Zhang, Z. Sun and H. Li, J. Power Sources, 2020, 450, 227653 CrossRef CAS.
- N. Zhao, F. Wu, Y. Xing, W. Qu, N. Chen, Y. Shang, M. Yan, Y. Li, L. Li and R. Chen, ACS Appl. Mater. Interfaces, 2019, 11, 15537–15542 CrossRef CAS.
- W. Wang, M. Tang, Z. Zheng and S. Chen, Adv. Energy Mater., 2019, 9, 1803628 CrossRef.
- X. Fan, J. Liu, Z. Song, X. Han, Y. Deng, C. Zhong and W. Hu, Nano Energy, 2019, 56, 454–462 CrossRef CAS.
- T. Zhou, W. Xu, N. Zhang, Z. Du, C. Zhong, W. Yan, H. Ju, W. Chu, H. Jiang, C. Wu and Y. Xie, Adv. Mater., 2019, 31, 11807468 Search PubMed.
- Q. Jin, B. Ren, J. Chen, H. Cui and C. Wang, Appl. Catal., B, 2019, 256, 117887 CrossRef CAS.
- Y. Li, Z. Huang, P. K. Kalambate, Y. Zhong, Z. Huang, M. Xie, Y. Shen and Y. Huang, Nano Energy, 2019, 60, 752–759 CrossRef CAS.
- L. Ma, S. Chen, Z. Pei, H. Li, Z. Wang, Z. Liu, Z. Tang, J. A. Zapien and C. Zhi, ACS Nano, 2018, 12, 8597–8605 CrossRef CAS.
- X. F. Lu, Y. Chen, S. Wang, S. Gao and X. W. D. Lou, Adv. Mater., 2019, 31, 1902339 CrossRef.
- L. Poolnapol, W. Kao-ian, A. Somwangthanaroj, F. Mahlendorf, M. T. Nguyen, T. Yonezawa and S. Kheawhom, Energies, 2020, 13, 462 CrossRef CAS.
- Z. Cai, I. Yamada and S. Yagi, ACS Appl. Mater. Interfaces, 2020, 12, 5847–5856 CrossRef CAS.
- Y. Zhong, Z. Pan, X. Wang, J. Yang, Y. Qiu, S. Xu, Y. Lu, Q. Huang and W. Li, Adv. Sci., 2019, 6, 1802243 CrossRef.
- P. P. Cottis, D. Evans, M. Fabretto, S. Pering, P. Murphy and P. Hojati-Talemi, RSC Adv., 2014, 4, 9819–9824 RSC.
- K. Jayaramulu, D. P. Dubal, A. Schneemann, V. Ranc, C. Perez-Reyes, J. Stráská, Š. Kment, M. Otyepka, R. A. Fischer and R. Zbořil, Adv. Funct. Mater., 2019, 29, 1902539 CrossRef.
- Y. Zhang, Y. Lin, H. Jiang, C. Wu, H. Liu, C. Wang, S. Chen, T. Duan and L. Song, Small, 2018, 14, 1702074 CrossRef.
- Y. Zhong, X. Xu, W. Wang and Z. Shao, Batteries Supercaps, 2018, 2, 272–289 CrossRef.
- B. Li, K. Igawa, J. Chai, Y. Chen, Y. Wang, D. W. Fam, N. N. Tham, T. An, T. Konno, A. Sng, Z. Liu, H. Zhang and Y. Zong, Energy Storage Mater., 2020, 25, 137–144 CrossRef.
- C. Guan, A. Sumboja, W. Zang, Y. Qian, H. Zhang, X. Liu, Z. Liu, D. Zhao, S. J. Pennycook and J. Wang, Energy Storage Mater., 2019, 16, 243–250 CrossRef.
- L. Ma, S. Chen, Z. Pei, Y. Huang, G. Liang, F. Mo, Q. Yang, J. Su, Y. Gao, J. A. Zapien and C. Zhi, ACS Nano, 2018, 12, 1949–1958 CrossRef CAS.
- H. Lei, Z. Wang, F. Yang, X. Huang, J. Liu, Y. Liang, J. Xie, M. S. Javed, X. Lu, S. Tan and W. Mai, Nano Energy, 2020, 68, 104293 CrossRef CAS.
- L. Yang, X. Zeng, D. Wang and D. Cao, Energy Storage Mater., 2018, 12, 277–283 CrossRef.
- Z. Liu, H. Yu, B. Dong, X. Yu and L. Feng, Nanoscale, 2018, 10, 16911–16918 RSC.
- X. Zhao, S. C. Abbas, Y. Huang, J. Lv, M. Wu and Y. Wang, Adv. Mater. Interfaces, 2018, 5, 1701448 CrossRef.
- A. Fan, C. Qin, X. Zhang, X. Dai, Z. Dong, C. Luan, L. Yu, J. Ge and F. Gao, ACS Sustainable Chem. Eng., 2018, 7, 2285–2295 CrossRef.
- Y. Ma, X. Dai, M. Liu, J. Yong, H. Qiao, A. Jin, Z. Li, X. Huang, H. Wang and X. Zhang, ACS Appl. Mater. Interfaces, 2016, 8, 34396–34404 CrossRef CAS.
- Q. Yan, T. Wei, J. Wu, X. Yang, M. Zhu, K. Cheng, K. Ye, K. Zhu, J. Yan, D. Cao, G. Wang and Y. Pan, ACS Sustainable Chem. Eng., 2018, 6, 9640–9648 CrossRef CAS.
- Z. Chen, Q. Wang, X. Zhang, Y. Lei, W. Hu, Y. Luo and Y. Wang, Sci. Bull., 2018, 63, 548–555 CrossRef CAS.
- M. D. Esrafili, R. Mohammad-Valipour, S. M. Mousavi-Khoshdel and P. Nematollahi, Chemphyschem, 2015, 16, 3719–3727 CrossRef CAS.
- A. V. Narendra Kumar, Y. Li, H. Yu, S. Yin, H. Xue, Y. Xu, X. Li, H. Wang and L. Wang, Electrochim. Acta, 2018, 292, 107–114 CrossRef CAS.
- Y. Liu, J. Li, F. Li, W. Li, H. Yang, X. Zhang, Y. Liu and J. Ma, J. Mater. Chem. A, 2016, 4, 4472–4478 RSC.
- Y. Du, Y. Han, X. Huai, Y. Liu, C. Wu, Y. Yang and L. Wang, Int. J. Hydrogen Energy, 2018, 43, 22226–22234 CrossRef CAS.
- J. Zhao, H. Hu and M. Wu, Nanoscale, 2020, 12, 3750–3762 RSC.
- Z. Wang, W. Xu, X. Chen, Y. Peng, Y. Song, C. Lv, H. Liu, J. Sun, D. Yuan, X. Li, X. Guo, D. Yang and L. Zhang, Adv. Funct. Mater., 2019, 29, 1902875 CrossRef.
- C. Hang, J. Zhang, J. Zhu, W. Li, Z. Kou and Y. Huang, Adv. Energy Mater., 2018, 8, 1703539 CrossRef.
- X. Liang, R. Dong, D. Li, X. Bu, F. Li, L. Shu, R. Wei and J. C. Ho, ChemCatChem, 2018, 10, 4555–4561 CrossRef CAS.
- Y. Zhao, J. Wang, C. Ma, L. Cao and Z. Shao, Chem. Eng. J., 2019, 370, 536–546 CrossRef CAS.
Footnotes |
| † Electronic supplementary information (ESI) available. See DOI: 10.1039/d0ra04827e |
| ‡ These authors contributed equally to this work. |
| This journal is © The Royal Society of Chemistry 2020 |