
 Open Access Article
 This Open Access Article is licensed under a Creative Commons Attribution-Non Commercial 3.0 Unported Licence
X-ray absorption spectroscopy of organic sulfoxides
Linda I. Vogt a,
Julien J. H. Cotelesagea,
Natalia V. Dolgovaa,
Charles J. Titusb,
Samin Sharific,
Simon J. Georged,
Ingrid J. Pickeringae and
Graham N. George*ae
a,
Julien J. H. Cotelesagea,
Natalia V. Dolgovaa,
Charles J. Titusb,
Samin Sharific,
Simon J. Georged,
Ingrid J. Pickeringae and
Graham N. George*ae
aMolecular and Environmental Sciences Group, Department of Geological Sciences, University of Saskatchewan, Saskatoon, Saskatchewan S7N 5E2, Canada. E-mail: g.george@usask.ca
bDepartment of Physics, Stanford University, Stanford, California 94305, USA
cChevron Energy Technology Company, Richmond, California 94802, USA
dSimon Scientific, 200 Allston Way, Unit 232, Berkeley, California 94701, USA
eDepartment of Chemistry, University of Saskatchewan, Saskatoon, Saskatchewan S7N 5C9, Canada
First published on 13th July 2020
Abstract
Organic sulfoxides, a group of compounds containing the sulfinyl S![[double bond, length as m-dash]](https://www.rsc.org/images/entities/char_e001.gif) O group, are widespread in nature, important in health and disease, and used in a variety of applications in the pharmaceutical industry. We have examined the sulfur K-edge X-ray absorption near-edge spectra of a range of different sulfoxides and find that their spectra are remarkably similar. Spectra show an intense absorption peak that is comprised of two transitions; a S 1s → (S–O)σ* and a S 1s → [(S–O)π* + (S–C)σ*] transition. In most cases these are sufficiently close in energy that they are not properly resolved; however for dimethylsulfoxide the separation between these transitions increases in aqueous solution due to hydrogen bonding to the sulfinyl oxygen. We also examined tetrahydrothiophene sulfoxide using both the sulfur and oxygen K-edge. This compound has a mild degree of ring strain at the sulfur atom, which changes the energies of the two transitions so that the S 1s → [(S–O)π* + (S–C)σ*] is below the S 1s → (S–O)σ*. A comparison of the oxygen K-edge X-ray absorption near-edge spectra of tetrahydrothiophene sulfoxide with that of an unhindered sulfoxide shows little change, indicating that the electronic environment of oxygen is very similar.
O group, are widespread in nature, important in health and disease, and used in a variety of applications in the pharmaceutical industry. We have examined the sulfur K-edge X-ray absorption near-edge spectra of a range of different sulfoxides and find that their spectra are remarkably similar. Spectra show an intense absorption peak that is comprised of two transitions; a S 1s → (S–O)σ* and a S 1s → [(S–O)π* + (S–C)σ*] transition. In most cases these are sufficiently close in energy that they are not properly resolved; however for dimethylsulfoxide the separation between these transitions increases in aqueous solution due to hydrogen bonding to the sulfinyl oxygen. We also examined tetrahydrothiophene sulfoxide using both the sulfur and oxygen K-edge. This compound has a mild degree of ring strain at the sulfur atom, which changes the energies of the two transitions so that the S 1s → [(S–O)π* + (S–C)σ*] is below the S 1s → (S–O)σ*. A comparison of the oxygen K-edge X-ray absorption near-edge spectra of tetrahydrothiophene sulfoxide with that of an unhindered sulfoxide shows little change, indicating that the electronic environment of oxygen is very similar.
Introduction
Organic compounds of sulfur are abundant in nature; they are profoundly involved in the environment,1,2 are a major component of fossil fuels,3 and play essential roles in all living organisms. Sulfoxides are a particularly widespread category of organo-sulfur compound, with a formal sulfur oxidation state of S(0); they contain the sulfinyl (SO) functional group (sometimes referred to as thionyl), a potentially chiral entity due to the presence of a lone pair of electrons on sulfur,4,5 with a bond order of two (SO) and significant oxygen lone pair backbonding giving rise to short and strong SO bonds.6 A large number of sulfoxides are known; the Cambridge Structure Database (CSD)7 includes 6721 structurally characterized organic sulfoxides, with an average SO bond-length of 1.50 Å. It is common practice to write the sulfinyl group as either a formal double bond or as a single bond with charge separation.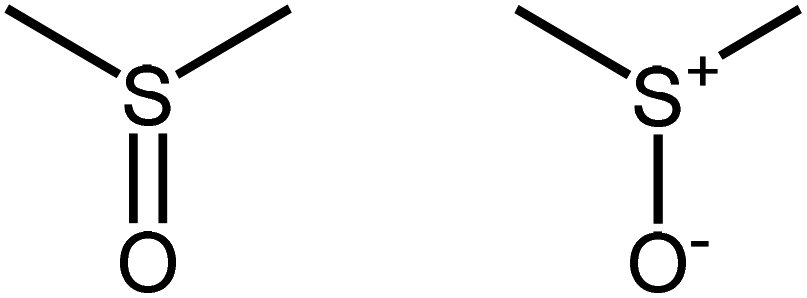
Examination of the Mulliken partial fitted charges of density functional theory calculations shows a partial charge on the sulfinyl oxygen of −0.45 for both aromatic and aliphatic sulfoxides, with a partial charge on sulfur of +0.2, and both σ and π bonding in the sulfinyl group, so while either nomenclature is acceptable, the double bond is probably more correct.
Sulfoxides are the first products of oxidation of organic sulfides; addition of the relatively mild oxidizing agent H2O2 to organic sulfides at room temperature readily produces sulfoxides and water. Certain microbes produce specific enzymes that catalyze this oxidation, for example some purple bacteria can grow photo-autotrophically on dimethyl sulfide with the production of dimethylsulfoxide, while many purple non-sulfur bacteria can use dimethylsulfoxide as an electron acceptor with production of dimethylsulfide.8 Both of these reactions are catalyzed by specific molybdenum-containing enzymes.9 In aerobic organisms the reactive oxygen species that inevitably result from an oxygen-based metabolism can react with protein methionine to produce methionine sulfoxide, which, due to the chirality of the sulfoxide group, can exist in two different diastereomers. Three different methionine sulfoxide reductase enzymes are used to regenerate methionine from the R and S diastereomers.10 Multicellular organisms, including mammals and plants, lack one of these enzymes, and consequently are unable to regenerate methionine from methionine-R-sulfoxide when it is present as the free amino acid.10–12 Down-regulation of methionine sulfoxide reductase has been shown to be related to virulence of breast cancers,13 and the enzymes have also been linked to neurodegenerative disease.14 Methionine sulfoxides also have been suggested to regulate phosphorylation as part of cellular defense mechanisms against oxidative stress.15 Photochemical formation of methionine sulfoxide by oxidation of methionine residues may also be important in the formation of cataracts.16
The simplest sulfoxide is dimethylsulfoxide (DMSO), a common aprotic solvent that finds widespread use in the chemical laboratory. Sulfoxides can be weak acids, for example DMSO forms the stable carbanion [CH3CH2SO]+ with a pKa of ∼35 forming the familiar sodium salt known as dimsyl sodium (sodium methylsulfinylmethylide).17 Sulfoxides can also accept protons via the sulfinyl oxygen,18 with DMSO forming the formal cation [(CH3)2S–OH]+, which in aqueous solution is more correctly formulated as [(CH3)2SO⋯H3O]+.19 DMSO is FDA approved for treatment of the symptoms of interstitial cystitis (painful bladder syndrome) and has found widespread use in fringe medicine. It is rapidly absorbed through the skin; a drop on the hand (or any other location) will often give a distinctive and sometimes persistent garlic taste on the tongue.20 DMSO also has the interesting property of carrying substances that are dissolved in it through the skin upon topical application21 and it thus finds use in some transdermal drug delivery systems.20 A number of important drugs are sulfoxides, such as armodafinil,22 which is used to treat sleep disorders, attention deficit hyperactivity disorder, and chronic fatigue syndrome. In food chemistry, the garlic flavorant precursor known as alliin is a sulfoxide, as are some of the flavor products, such as the ajothiolanes.23
X-ray absorption spectroscopy (XAS) is a powerful tool that finds applications in a number of fields, ranging from fuel science and geochemistry to advanced materials to biochemistry. One of the strengths of XAS is that it can be applied to the study of elements in almost any sample, including those containing complex mixtures of species.24 Sulfur K-edge XAS has been used extensively in life science research, with applications to understanding the sulfur biochemistry of prokaryotes,25,26 plants27–29 and fungi,30 hemichordates,31 live cell cultures32 and mammalian tissues.24,33 Because of the importance of sulfur in fossil fuels, these were amongst the first materials to be studied by sulfur K-edge XAS;34,35 applications in this area now include studies of crude oils,36,37 asphaltenes,35 bitumens and kerogens,38,39 source rocks,37 coals,34,40 and combustion products.41 Other applications of sulfur K-edge XAS include studies of geological,42 environmental,43–45 and archeological samples.46
In previous work we have reported upon the sulfur K-edge XAS of thiophenes,47–49 organic sulfides50,51 and organic disulfides.52 Here we report upon the sulfur K-edge XAS of selected aliphatic and aromatic sulfoxides, and use a combination of density functional theory calculations and single crystal polarized XAS to develop an understanding of their spectra.
Experimental
Chemicals and reagents
Reagents and solvents were purchased from Sigma-Aldrich Chemical Company (St. Louis MI, USA), and reagents were of the highest quality available.Sample preparation
Single crystals of diphenylsulfoxide were obtained by recrystallization of the commercial material from acetone, forming crystals with a plate-like morphology. Un-twinned single crystals with approximate dimensions 1 mm × 1 mm × 0.3 mm were selected using a polarizing microscope, were glued with epoxy adhesive to aluminum pins and were mounted on a standard crystallography goniometer head. A laboratory-based Enraf-Nonius CAD4 diffractometer was used to determine the crystal orientation matrix before crystals were transported on the goniometer head to the Stanford Synchrotron Radiation Lightsource (SSRL) where the oriented samples were carefully transferred to an in-hutch goniometer prior to data collection.Solution samples for XAS were dissolved in toluene (or other solvent, as indicated below) at total sulfur concentrations of 100 mM or less in order to minimize X-ray fluorescence self-absorption effects,25,26 as determined by sequential dilutions; data reported in this paper are essentially free of any self-absorption distortion. In the case of dimethylsulfoxide substantially more dilute solutions were examined, down to 1 mM, and no changes in the spectra were observed other than increased noise with the most dilute samples. This indicates that solute–solute effects were not significant at the concentrations used. Solutions were placed in modified SPEX CertiPrep (Metuchen NJ, USA) X-cell sample cups employing a 3 μm thick Etnom® window (Chemplex Industries, Inc, Palm City FL, USA) to transmit the X-ray fluorescence.
Liquid samples for oxygen K-edge XAS measurements were contained in custom designed sample holders closed with a 100 nm thick Si3N4 window (Norcada Inc., Edmonton AB, Canada). Solids for oxygen K-edge measurements were evenly spread on conductive carbon tape (Agar Scientific, Stanstead, Essex, UK) on an aluminum sample holder.
X-ray absorption spectroscopy
Sulfur K-edge XAS was measured at the Stanford Synchrotron Radiation Lightsource (SSRL) on beamlines 4–3 and 6–2. In order to minimize atmospheric attenuation of the X-rays the experiment was maintained in an atmosphere of helium gas. Polarized single crystal spectra were measured using total electron yield with a helium gas-amplification detector,47,52 exploiting the plane-polarized synchrotron radiation that is available from planar insertion devices and bend magnets, for which the X-ray electric vector e lies primarily in the plane of the storage ring.53 For both 4–3 and 6–2 Si(111) double crystal monochromators were used with harmonic rejection accomplished by setting the energy cutoff of the upstream (Ni-coated for 6–2 or bare Si for 4–3) vertically collimating bent flat mirror to approximately 6 keV. Incident X-ray intensities were monitored using a helium-filled gas ionization detector upstream of the sample, with the sweeping voltage adjusted until the output had plateaued. Spectra of solutions were measured by monitoring the total X-ray fluorescence using a large-area PIN diode (Canberra Industries, Meriden CT, USA) or using a Stern–Heald–Lytle detector (The EXAFS Company, Pioche NV, USA).54 In the case of the PIN diode, visible light was excluded by employing an aluminized mylar window on the face of the detector, and by darkening the experimental hutch. The incident X-ray energy was calibrated with reference to the spectrum of a solid anhydrous sodium thiosulfate (Na2S2O3) standard using the literature value of 2469.2 eV as the energy of the lowest energy K-edge absorption peak.55Oxygen K-edge XAS was collected on SSRL beamline 10–1 with the spherical grating monochromator operated with the high-resolution 1000 lines per mm grating. For spectra of solids the partial electron yield was monitored using a Channeltron detector (Photonis USA, Lancaster PA, USA). For solutions the oxygen Kα fluorescence yield was monitored using a 240 pixel transition edge sensor array detector,56 with the intensity of the incident beam measured as the drain current from an electrically isolated evaporated gold mesh upstream of the sample. Incident energy calibration assumed an energy of 531.0 eV for the maximum of the lowest energy peak of a Ti2O3 standard.
Analysis of XAS data used the EXAFSPAK program suite, with calculation of higher derivatives achieved using the piecewise cubic spline method embedded within EXAFSPAK.57 Data were normalized to the edge-jump to give a per-unit-sulfur or per-unit oxygen absorption spectrum, as appropriate, using the spline method, which employs a rigid spline above the absorption edge to estimate the edge jump.
Density functional theory (DFT) calculations
DFT geometry optimizations were carried out using DMol3 and Biovia Materials Studio Version 2018.58,59 The Perdew–Burke–Ernzerhof functional60 was used both for the potential during the self-consistent field procedure and for the energies. Dmol3 double numerical basis sets included polarization functions for all atoms with all-electron core treatments. Solvation effects were modeled using the Conductor-like Screening Model (COSMO)61 in Dmol3 employing the dielectric constants ε of toluene (2.38), acetone (20.7) or water (78.54). DFT simulations of near-edge spectra were calculated using the StoBe-deMon code62 employing the half-core-hole approximation, incorporating relaxation of selected excited states at the absorption edge, and employing the coordinates from Dmol3 geometry optimizations. StoBe-deMon calculations employed the non-local exchange function of Perdew and Wang63 and the Perdew correlation functional approximation.64,65 The IGLO III basis set66 was used for sulfur when calculating sulfur K-edge spectra, and for oxygen when calculating the oxygen K-edge spectra using StoBe-deMon. The (7111/411/1), (6311/311/1) and (311/1) basis sets were used for oxygen, carbon and hydrogen, respectively. When calculating oxygen K-edge spectra an effective core potential combined with the (311/211/1) basis set was employed for sulfur. Interpolation of the exchange-correlation potential employed the auxiliary basis sets (5,4;5,4) for sulfur, (5,2;5,2) for carbon and oxygen, and (3,1;3,1) for hydrogen. To provide alignment with experimental data, calculated transition energies were shifted by +5.2 eV and −1.1 eV, for sulfur and oxygen K-edge spectra, respectively.Results and discussion
Sulfur K-edge X-ray absorption spectroscopy of sulfoxides
X-ray absorption spectra are dominated by dipole-allowed Δl = ±1 transitions to unoccupied molecular orbitals, the energy and intensity of which provide a sensitive probe of the electronic structure. In the case of sulfur K-edge XAS spectra, transitions are from the sulfur 1s level to molecular orbitals having substantial 3p character. Fig. 1 compares the sulfur K-edge X-ray absorption near-edge spectra of a series of organic sulfoxides. As expected from the higher formal sulfur oxidation state and the altered sulfur environment, the peak position for dimethylsulfoxide is shifted to higher energy, by +2.8 eV, compared with that of its reduced counterpart dimethylsulfide (Fig. 1A(a)). All sulfoxide spectra that are shown in Fig. 1 show distinctive similarities and all are dominated by an intense absorption between 2473.0 to 2473.6 eV. Examination of the second derivative spectra (Fig. 1B) indicates that this peak is in fact comprised of two closely separated transitions, in most cases centered at 2473.5 eV. For the aromatic diphenylsulfoxide the peaks are shifted to lower energy by ∼0.3 eV, with the spectra of the unsaturated di-isoallyl sulfoxide and the aryl-alkyl methylphenylsulfoxide appearing intermediate between the aromatic and aliphatic sulfoxides.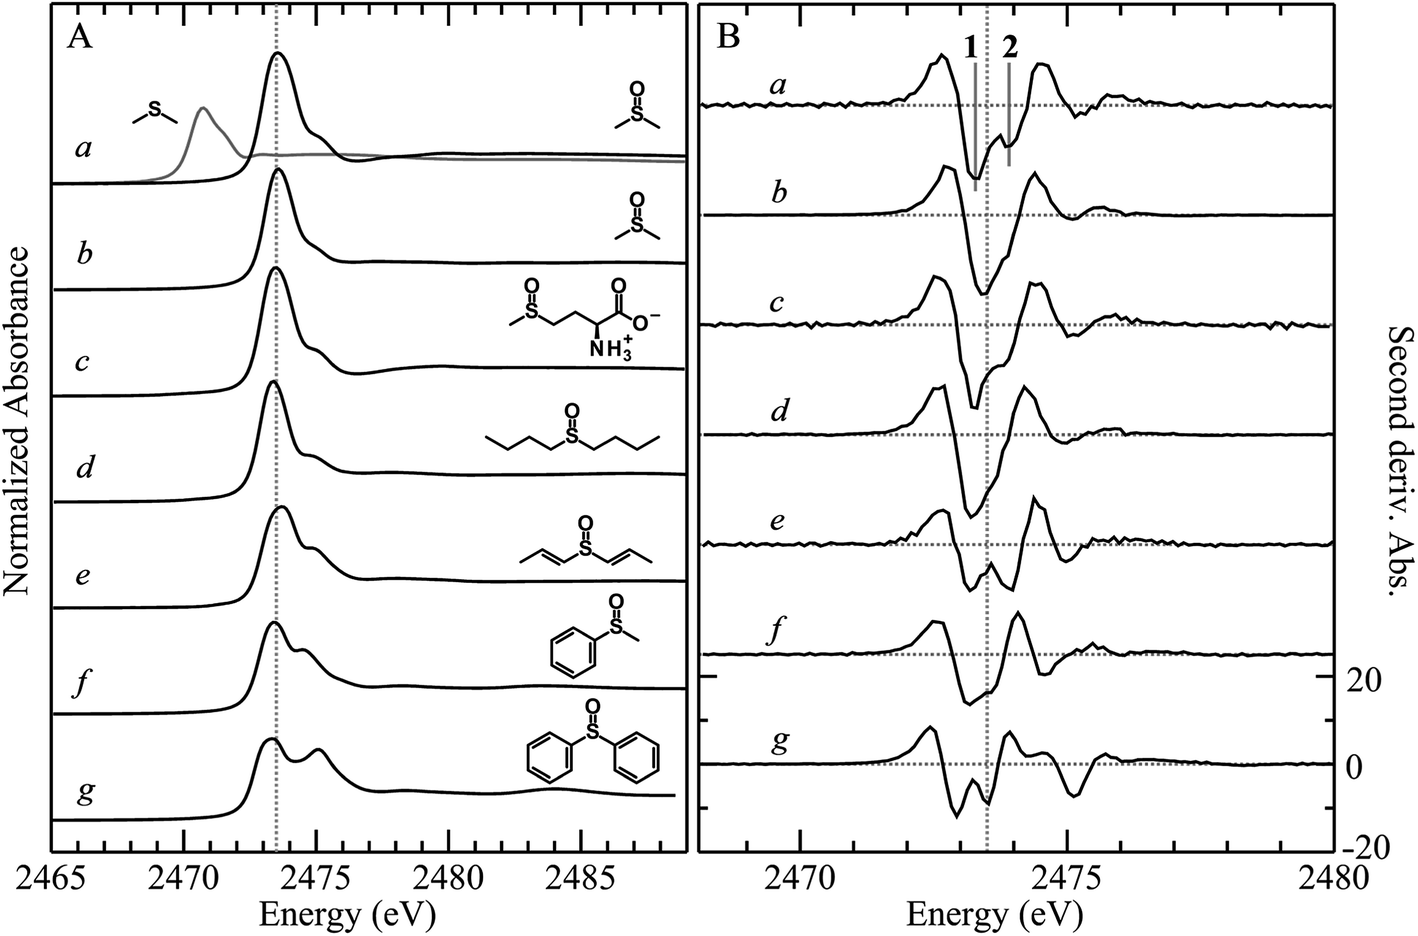 | ||
| Fig. 1 Comparison of the sulfur K-edge X-ray absorption spectra of a series of organic sulfoxides. (A) Shows the absorption spectra, while (B) shows the corresponding second derivative spectra. (a) Dimethylsulfoxide (50 mM aqueous solution 100 mM bis-tris-propane buffer pH 7.4), (b) dimethylsulfoxide (100 mM acetone solution), (c) L-methionine sulfoxide (50 mM aqueous solution 100 mM bis-tris-propane buffer pH 7.4), (d) n-butylsulfoxide (100 mM toluene solution), (e) di-isoallyl-sulfoxide (100 mM toluene solution), (f) methylphenylsulfoxide (100 mM toluene solution), and (g) phenyl sulfoxide (100 mM toluene solution). For (a) the spectrum of a solution of dimethylsulfide is superimposed (gray curve) to illustrate the chemical shift between the sulfide and sulfinyl functional groups. The vertical broken line at 2473.5 eV is included to guide the eye to small shifts between the spectra. The two low-energy transitions 1 and 2 that are discussed in the text are indicated on trace (a) in panel (B). | ||
A limited number of sulfoxides have been investigated previously using sulfur K-edge XAS by other workers. The spectra of both dimethylsulfoxide and its protonated cationic form have been reported by Risberg et al.19 who showed that in acidified aqueous solutions it is more correctly formulated as [(CH3)2SO⋯H3O]+. The spectrum of methionine sulfoxide also has been reported,16,67 and is essentially identical to that reported here. In agreement with our experimental finding that the intense sulfoxide peak is comprised of two features, Risberg et al.67 used DFT simulations to show that the peak is comprised of two transitions that are close in energy, although our data (Fig. 1B) are the first experimental confirmation of this.
Single crystal polarized X-ray absorption near-edge spectra of diphenylsulfoxide
As previously pointed out by Pickering et al.,52 single crystal systems for polarized study must be carefully selected to give suitable alignment of groups within the crystallographic unit cell. Hence, we selected diphenylsulfoxide for a polarized single crystal study because its crystal structure, which was first reported in 1957,68 shows good alignment of SO bonds within the unit cell (Fig. 2). Diphenylsulfoxide crystallizes in the space group P21/n, with the unit cell containing four molecules all of which have SO bonds that lie in the crystallographic a–c plane, oriented essentially along the a–c bisector (very close to the [101] vector, Fig. 2A and B). The structures of the individual diphenylsulfoxide molecules are very slightly distorted from Cs point-group symmetry, with the phenyl rings rotated from the symmetric position by just 0.3°. The intensity of dipole-allowed transitions is proportional to 3![[thin space (1/6-em)]](https://www.rsc.org/images/entities/char_2009.gif) cos2ϑ, relative to the intensity of the same transition in the spectrum of a non-ordered powder, where ϑ is the angle between the X-ray e-vector and the transition dipole operator.69,70 Thus, for a 1s → σ* transition, ϑ will be the angle between the X-ray e-vector and the σ bond.
cos2ϑ, relative to the intensity of the same transition in the spectrum of a non-ordered powder, where ϑ is the angle between the X-ray e-vector and the transition dipole operator.69,70 Thus, for a 1s → σ* transition, ϑ will be the angle between the X-ray e-vector and the σ bond.
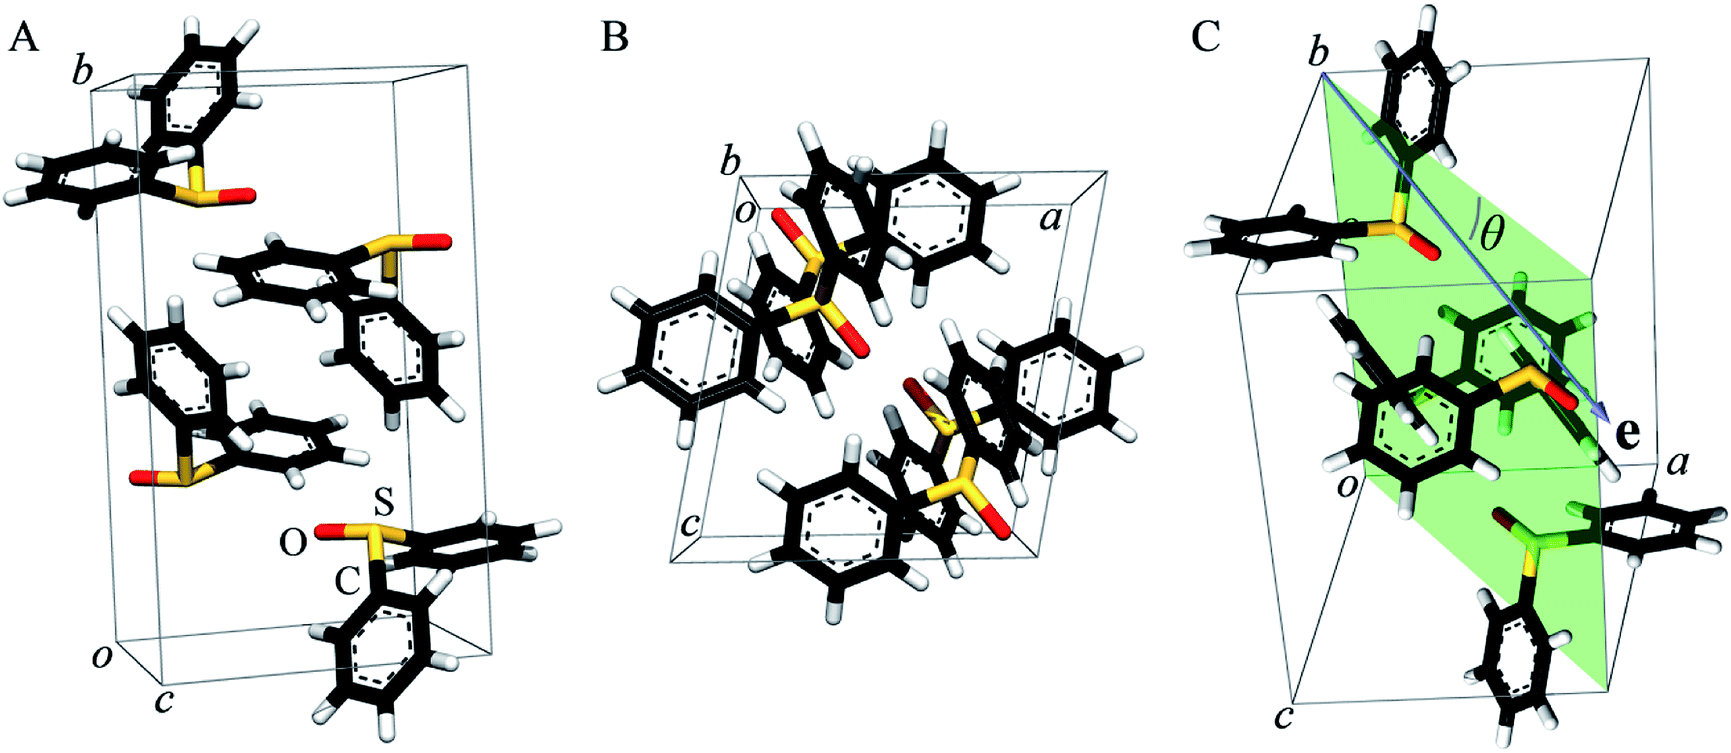 | ||
| Fig. 2 The crystal structure of diphenylsulfoxide. Panel (A) shows a view of the unit cell showing the four molecules contained within, and (B) shows a view looking along the crystallographic b axis, highlighting the alignment of the SO bonds. Panel (C) shows the plane (in transparent green) defined by the a–c bisector and the crystallographic b axis used in the polarized single crystal measurements, together with the experimentally varied angle θ between the X-ray e-vector (the blue arrow in (C)) and the a–c bisector. | ||
Fig. 3 compares the sulfur K near-edge spectra of solid and a toluene solution of diphenylsulfoxide, along with the corresponding second derivative spectra. The spectra are dominated by several intense features. The previously discussed pair of peaks 1 and 2 that make up the lowest energy intense transition fall at 2472.9 (1) and 2473.5 eV (2). A third intense feature (3) falls at 2475.2 eV and is slightly less intense and subtly shifted to lower energy in the solution spectrum (2475.1 eV) relative to the solid (2475.2 eV). A fourth broad feature (4) at approximately 2484.1 eV is also less intense in the solution spectra. Aside from these intensity differences the solution and solid spectra are very similar. Single crystal polarized spectra of diphenylsulfoxide are shown in Fig. 4. The crystal was aligned so that the X-ray e vector bisected the crystallographic a and c axes, and the crystal rotated so that the e vector rotated from being aligned with the SO bond in the a–c plane (defined as θ = 0 in Fig. 4) to along the crystallographic b-axis (defined as θ = 90° in Fig. 4), as illustrated in Fig. 2C. The spectra show a low energy feature marked (*) at about 2470 eV, which increased in intensity upon exposure to the X-ray beam. We interpret this as small amounts of a photo-reduced species, most probably phenylsulfide,51 that accumulated with exposure. In agreement with this the feature is most intense in the last spectrum collected (θ = 75°) and shows no intensity in the first spectra of the series that were collected (θ = 90° and 60°). The feature 1 is most intense when the X-ray e-vector is aligned with the SO bond (θ = 0°), suggesting that the feature corresponds to a 1s → (S–O)σ* transition, whereas 2 grows in intensity as the X-ray e-vector is rotated away from the sulfur–oxygen bond, although there is some intensity at all values of θ, suggesting that the transition is to an antibonding molecular orbital having predominantly π* with some σ* character. The feature 3 shows opposite polarization dependence to 1 being most intense when θ = 90°, whereas the broad feature 4 shows greatest intensity at θ = 0°, and probably derives from transition or transitions to molecular orbitals with some (S–O)σ* character.
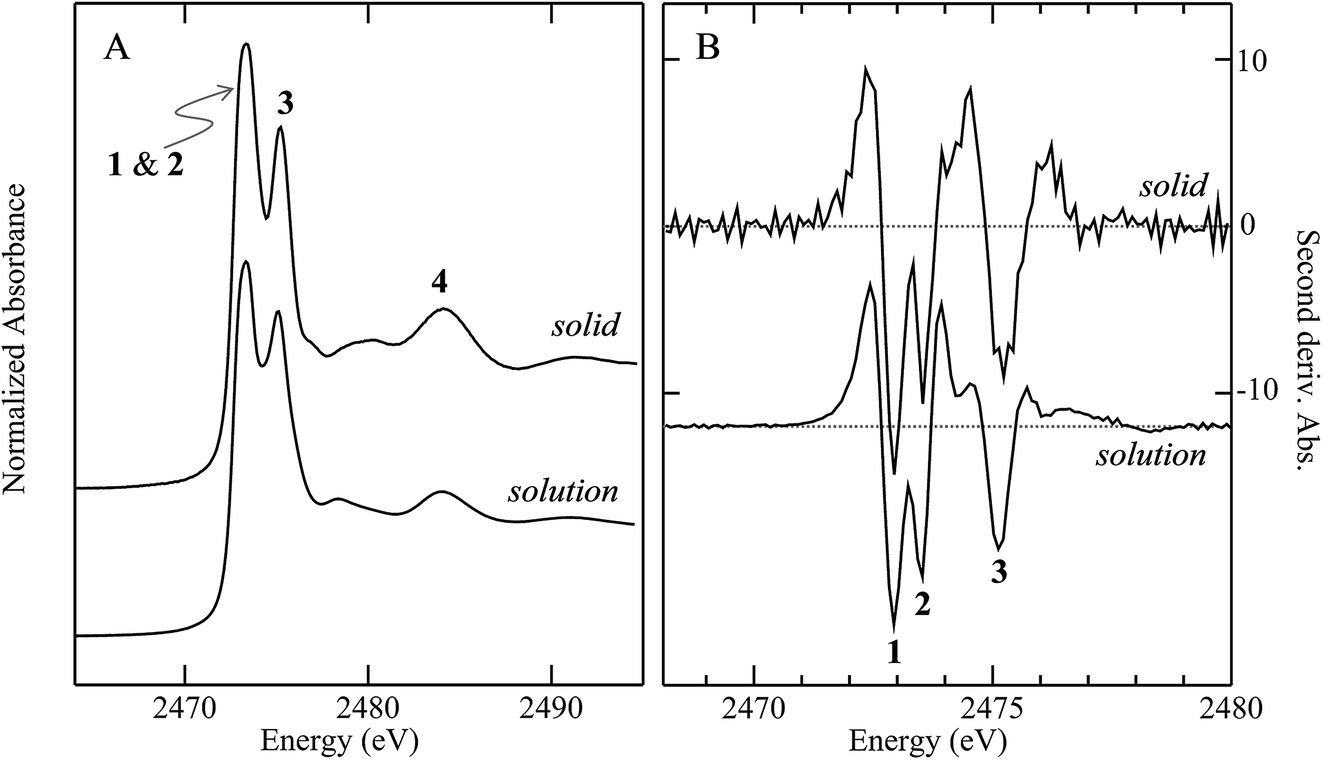 | ||
| Fig. 3 Comparison of sulfur K-edge X-ray absorption near edge spectra for diphenylsulfoxide as a solid and in toluene solution. Panel (A) shows the absorption spectra, while (B) shows the corresponding second derivative spectra. The transitions labelled 1–4 are discussed in the text. | ||
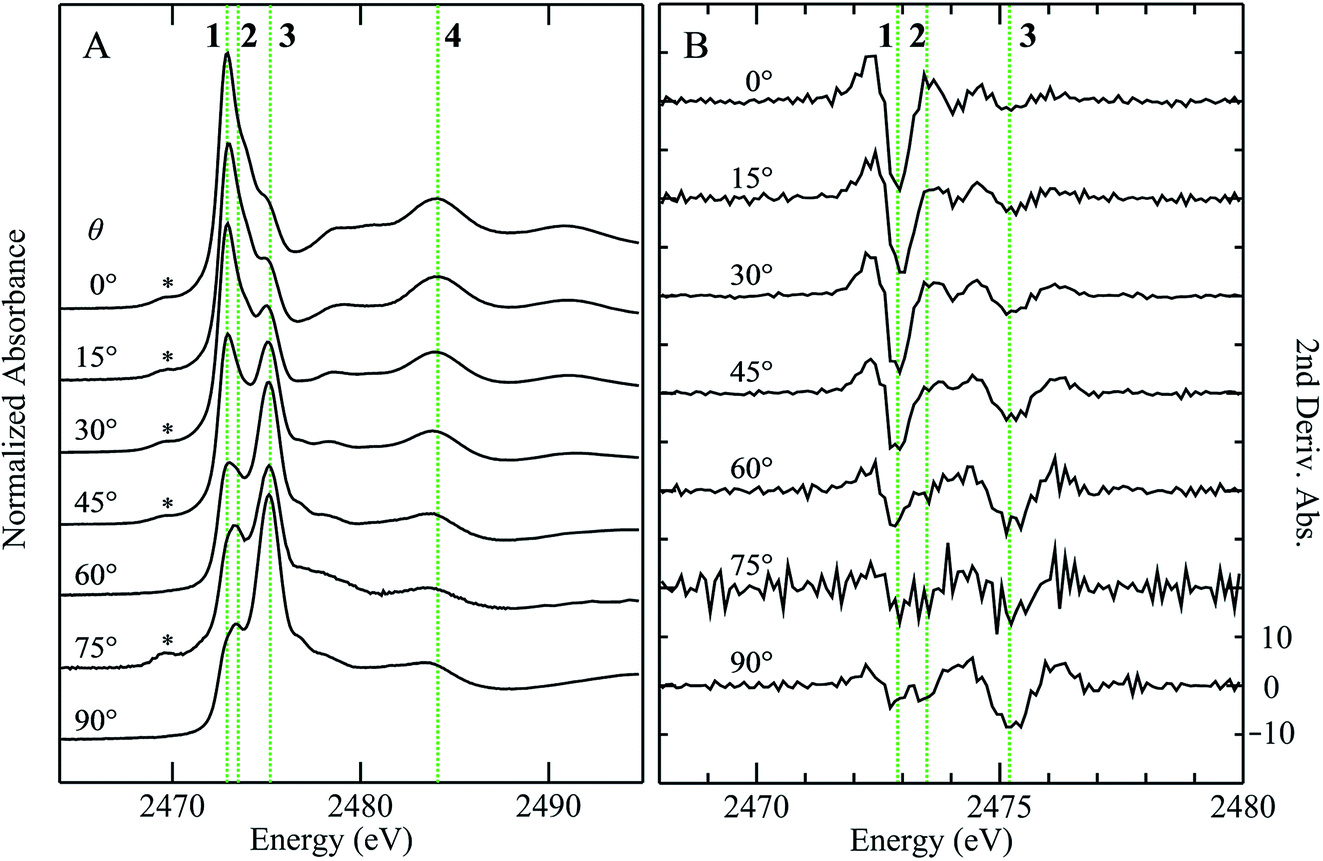 | ||
| Fig. 4 Polarized sulfur K-edge X-ray absorption spectra of a single crystal of diphenylsulfoxide (A), with second derivative spectra (B), where θ is the angle from the SO bond rotating the crystal from the a–c bisector to the crystallographic b axis. The features marked as 1–4 show marked polarization anisotropy and are discussed in the text. The feature marked (*) grows with beam exposure and is thus most probably associated with photoreduced forms. | ||
In previous studies of the XAS of compounds in which sulfur is bound to an aromatic ring it has been shown that the spectra can be substantially influenced by the aromatic ring.51 For example, the spectrum of diphenylsulfide shows a pronounced peak at ∼1.5 eV above the lower-energy main peak,51 which is only observed in arylsulfides and not in alkyl or aryl-alkyl sulfides.50,51 Likewise, the aliphatic sulfoxides lack the intense transition 3, suggesting that this involves the aromatic rings. The crystal structure of diphenylsulfoxide shows that the phenyl rings are oriented in two different aspects, with the plane of one phenyl ring oriented at 28° and the other at 68° to the crystallographic b axis. Thus, transitions involving aromatic ring π* orbitals should be more prominent when the X-ray e vector lies along the b axis. The polarized intensity of transition 1 is clearly maximal when the X-ray e vector is aligned with the SO bond, which argues that it arises from a 1s → (S–O)σ* transition. Transition 2, on the other hand, shows a polarization that is more consistent with either a 1s → (S–O)π* transition or a 1s → (S–C)σ* transition, or a transition to an antibonding molecular orbital with both (S–O)π* and (S–C)σ* character. These conclusions are consistent with the assignments of Risberg et al. for methionine sulfoxide,67 who did not observe two discrete transitions within the major peak, but predicted their presence using density functional theory calculations, and assigned the two as transitions to antibonding orbitals with substantial (S–O)σ* character and with (S–O)π* plus (S–C)σ* character.
Density functional theory calculations
In their simulations of the spectrum of methionine sulfoxide, Risberg et al.67 included a single water hydrogen bonded to the sulfinyl. Our experimental second derivative spectra for DMSO (Fig. 1) show different separations between peaks 1 and 2 for aqueous and acetone solutions, of approximately 0.65 and 0.45 eV, respectively. We therefore computationally explored the effects of different numbers of water molecules hydrogen bonded to the sulfinyl oxygen. Fig. 5a compares the predicted spectra for zero through four waters hydrogen bonded to the sulfoxide oxygen of DMSO. Insertion of additional waters (i.e. more than four) took considerably longer to converge and tended to rearrange during geometry optimization to form structures with four waters bound to the sulfinyl oxygen, with the additional waters relocating to locations external to those attached through hydrogen bonds to the interior waters. Bond-lengths derived from DFT geometry optimizations tend to show systematic differences with crystallographically determined bond lengths, and are typically slightly longer by ∼0.03 Å when using the computational approach employed herein. The DFT geometry optimized SO bond-length varied from 1.541 Å with no waters bound to 1.586 Å with four waters hydrogen bonded, with O⋯H– distances of 1.9–2.0 Å. A search of the CSD gives 269 examples of sulfoxides with hydrogen bonded hydroxyl groups, all showing O⋯H– distances in the range 1.9–2.0 Å,7 indicating that these computed distances are within the range expected. The computed separation between transitions 1 and 2 increased from 0.01 eV with no waters to 0.62 eV for four waters, which is close to the experimentally derived value for DMSO in aqueous solution of 0.65 eV. Indeed, with four waters included in the computations, other features of the spectrum show improved match with the experiment, such as the feature at 2474.7 eV, which is a transition to an antibonding orbital comprised of (S–C)σ* with some (S–O)σ* (not illustrated) with the computed transition shifting to the experimental position and growing in intensity as successive waters are included. Thus it is clear that solvent effects can significantly alter the observed spectra of sulfoxides, and that the most likely number of waters hydrogen bonded in aqueous solutions is four. The 0.07 electron per cubic a.u. isosurfaces of the excited state (receiving) molecular orbitals corresponding to transitions 1 and 2 are also shown in Fig. 5. The appearance of these molecular orbitals did not change substantially with hydrogen bonded water.
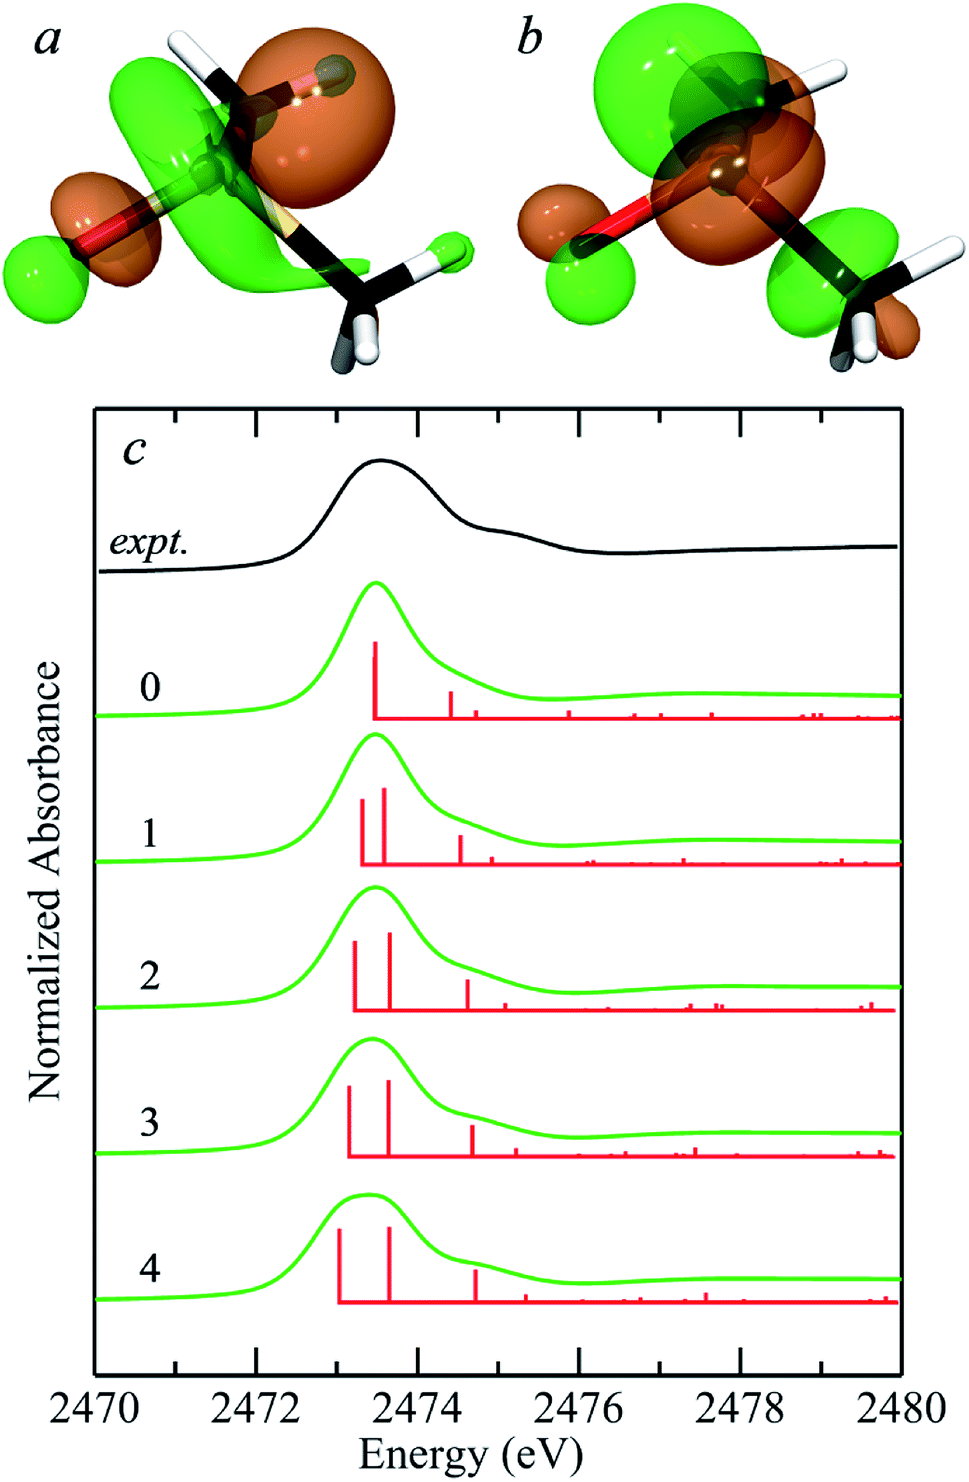 | ||
| Fig. 5 Density functional theory simulations of the sulfur K-near-edge spectrum of dimethylsulfoxide. (a and b) Show the 0.07 electrons per a.u.3 isosurfaces of the excited state molecular orbitals corresponding to transitions 1 (S 1s → (S–O)σ*) (a) and 2 (S 1s → [(S–O)π* + (S–C)σ*]) (b). (c) Shows the experimental spectrum of aqueous dimethylsulfoxide from Fig. 1(a) (black line) along with simulated spectra (green lines) plus corresponding stick spectra showing the energies of computed transitions (red lines) for the number of hydrogen-bonded waters (0–4) indicated for each simulated spectrum. | ||
The improvements in the DFT simulation when solvent water is incorporated with DMSO caused us to examine crystalline diphenylsulfoxide for possible interactions. The crystal structures show the presence of hydrogen bonding from three different protons with O⋯H– distances that are under 3 Å, arising from adjacent diphenlysulfoxide molecules in the unit cell. These interactions are at much longer distances than those suggested for aqueous solutions, and in agreement with this, inclusion of these hydrogen bonds changed the overall appearance of the computed spectra only subtly (not illustrated). We conclude that, in contrast to aqueous solutions, aprotic non-polar environments show only subtle spectroscopic effects arising from the much weaker hydrogen bonding in these systems. Fig. 6 compares experimental and computed spectra for diphenylsulfoxide. The calculation reproduces many of the features of the experimental spectrum, and, in agreement with the polarized spectra of Fig. 4, confirms that the two lowest energy transitions are similar to those of aliphatic sulfoxides. Overall, however, the agreement between computed and experimental spectra is less satisfactory than for aliphatic sulfoxides as there are a number of additional transitions (Fig. 6), many of which involve the aromatic rings. Moreover, the polarized spectra, are more consistent with a simpler spectrum, resembling those of the aliphatic sulfoxides, with the exception of transitions 3 and 4, both of which involve the phenyl rings. In the case of diphenyl sulfide we found previously that conformational flexibility could dramatically change the computed spectra.51 Although diphenyl sulfoxide lacks the flexibility of diphenyl sulfide, some rotation about the C–S bonds can occur in solution5 and inspection of the crystal structure indicates that a more limited extent of phenyl rotation should still be possible. Preliminary calculations (not illustrated) show that even subtle phenyl ring rotations can effect substantially different computed spectra. While insufficiency of the theoretical methods used may be responsible, preliminary time-dependent-DFT calculations using the ORCA code71 employing methods similar to those used by Henthorn et al.,72 show no substantial improvements over the StoBe-deMon half-core-hole methods employed herein. Thus, it seems most plausible that the poorer agreement between experimental and computed spectra for diphenyl sulfoxide may be related to phenyl ring rotations, smearing out those transitions that are sensitive to these effects.5 This will be the subject of future studies using XAS at low temperatures.
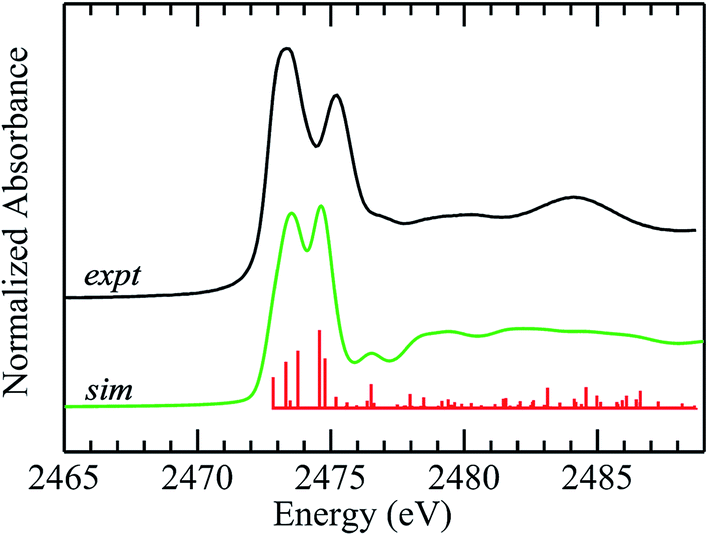 | ||
| Fig. 6 Density functional theory simulation of the sulfur K-near-edge spectrum of diphenylsulfoxide. The experimental spectrum (toluene solution) is shown in black, along with the simulated spectrum (green line) plus corresponding stick spectra showing the energies of computed transitions (red lines). | ||
Effects of ring strain in cyclic sulfoxides
We have previously reported the effect of ring strain on the sulfur K-edge X-ray absorption spectra of cyclic and acyclic sulfides.50 In the case of sulfides, the ring strain that is present in cyclic systems shifts the energy of the lowest energy sulfur K-edge XAS peak to lower energies. This feature is a 1s → (S–C)σ* transition and shifts by −0.28 eV between straight chain acyclic sulfides and tetrahydrothiophene (C4H8S).50 Fig. 7 compares the experimental sulfur K-edge XAS and oxygen K-edge XAS for the sulfoxide counterparts of two of the compounds in our earlier study, and additionally compares DFT simulations of the spectra.50 We note that these simulations neglect the effects of any hydrogen bonding, which might add complexity to the spectra, although for organic compounds we expect these effects to be less significant, as with diphenylsulfoxide. The sulfur K-edge spectra show a peak shift to lower energy for the cyclic system of approximately −0.14 eV, which is approximately half that observed for the corresponding sulfides. Unlike the sulfur K-edge the oxygen shows essentially no observable shifts, suggesting that the sulfinyl bonding from the oxygen perspective is not substantially perturbed by the presence of ring strain induced by the carbons that are each two atoms distant. Examination of the excited state molecular orbitals shows that it is the S 1s → [(S–O)π* + (S–C)σ*] transition 2 that is shifted to lower energy in tetrahydrothiophene sulfoxide, while the S 1s → (S–O)σ* (transition 1) is relatively unchanged in energy.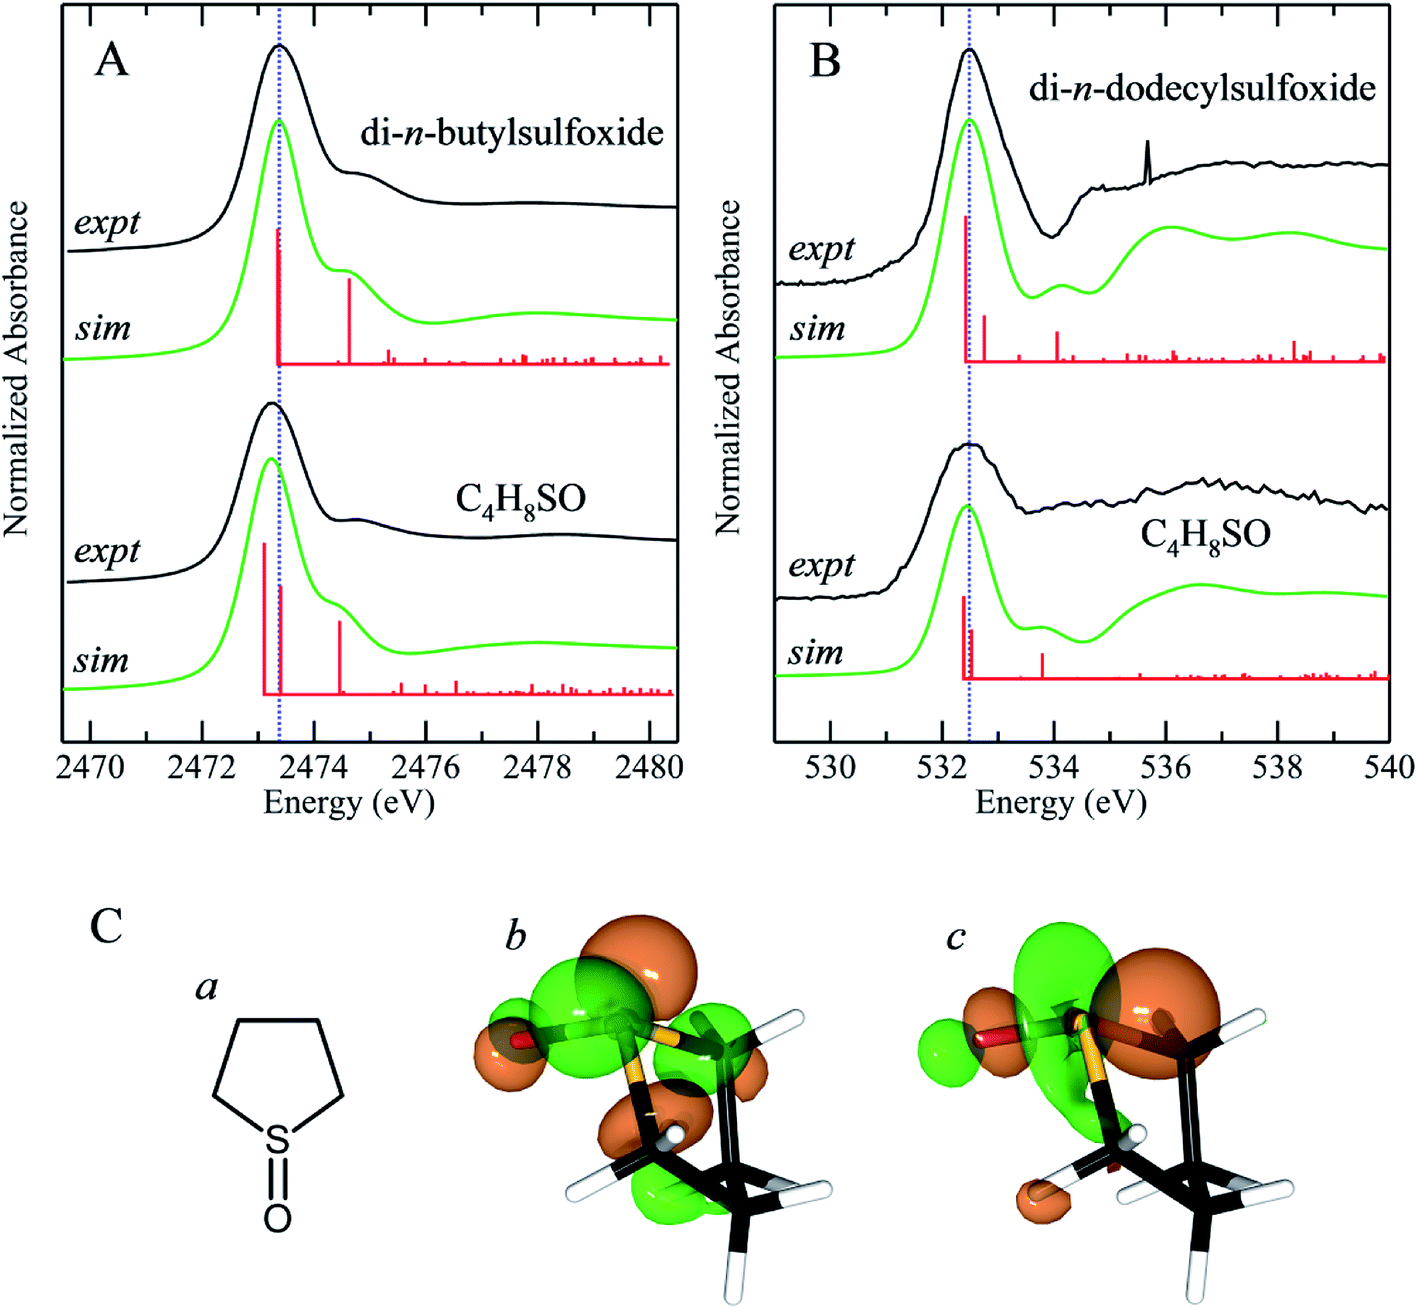 | ||
| Fig. 7 Sulfur K-edge (A) and oxygen K-edge (B) spectra together with density functional theory simulations of the spectra of sterically hindered and unhindered sulfoxides. The sulfur K-edge spectra were measured of 100 mM toluene solutions, while the oxygen K-edge spectra were measured on solid di-n-dodecylsulfoxide and pure liquid tetrahydrothiophene sulfoxide. Tetrahydrothiophene sulfoxide (C) schematic structure (a) along with representations of the LUMO (b) and LUMO+1 (c). | ||
Conclusions
The sulfur K-edge X-ray absorption near-edge spectra of the range of sulfoxides presented here are remarkably similar. In general, spectra show an intense absorption peak that is comprised of two transitions; a S 1s → (S–O)σ* transition and a S 1s → [(S–O)π* + (S–C)σ*]. In most cases these are sufficiently close in energy that they are not properly resolved. In tetrahydrothiophene sulfoxide, which has a mild degree of ring strain at the sulfur atom, the energies of these two transitions are changed, with the S 1s → [(S–O)π* + (S–C)σ*] being lowered in energy so that it is below the S 1s → (S–O)σ*. A comparison of the oxygen K-edge X-ray absorption near-edge spectra of tetrahydrothiophene sulfoxide with that of an unhindered sulfoxide shows little change, indicating that the electronic environment of oxygen is very similar irrespective of presence or lack of ring strain.Conflicts of interest
There are no conflicts to declare.Acknowledgements
Research at the University of Saskatchewan is supported by a grant from the Chevron Energy Technology Company, the Natural Sciences and Engineering Research Council (GNG, IJP), the University of Saskatchewan and by Canada Research Chairs (GNG, IJP). Use of the Stanford Synchrotron Radiation Lightsource (SSRL), SLAC National Accelerator Laboratory, is supported by the U.S. Department of Energy (DOE), Office of Science, Office of Basic Energy Sciences under Contract number DE-AC02-76SF00515, respectively. The SSRL Structural Molecular Biology Program is supported by the DOE Office of Biological and Environmental Research, and by the National Institutes of Health, National Institute of General Medical Sciences (including P41GM103393). The contents of this publication are solely the responsibility of the authors and do not necessarily represent the official views of NIGMS or NIH.References
- R. J. Charlson, J. E. Lovelock, M. O. Andreae and S. G. Warren, Nature, 1987, 326, 655–661 CrossRef CAS.
- E. H. Hoffman, A. Tilgner, R. Schrödner, R. Bräuer, R. Wolke and H. Herrmann, Proc. Natl. Acad. Sci. U. S. A., 2016, 113, 11776–11781 CrossRef PubMed.
- A. Demirbas, H. Alidrisi and M. A. Balubaid, Pet. Sci. Technol., 2015, 33, 93–101 CrossRef CAS.
- I. Fernández and N. Khiar, Chem. Rev., 2003, 103, 3651–3705 CrossRef PubMed.
- D. Casarini, L. Lunazzi and A. Mazzanti, Angew. Chem., Int. Ed. Engl., 2001, 113, 2604–2607 CrossRef.
- D. B. Chestnut and L. D. Quin, J. Comput. Chem., 2003, 25, 734–738 CrossRef PubMed.
- C. R. Groom, I. J. Bruno, M. P. Lightfoot and S. C. Ward, Acta Crystallogr., Sect. B: Struct. Sci., Cryst. Eng. Mater., 2016, 72, 171–179 CrossRef CAS PubMed.
- U. Kappler and H. Schäfer, The Metal-Driven Biogeochemistry of Gaseous Compounds in the Environment, in Metal Ions in Life Sciences, ed. P. M. H. Kroneck and M. E. Sosa Torres, Springer, Dordrecht, Heidelberg New York, London, 2014, vol. 14, pp. 279–313 Search PubMed.
- M. J. Pushie and G. N. George, Coord. Chem. Rev., 2011, 255, 1055–1084 CrossRef CAS.
- V. N. Gladyshev and B. Y. Lee, Free Radical Biol. Med., 2011, 50, 221–227 CrossRef PubMed.
- B. C. Lee, D. T. Le and V. N. Gladyshev, J. Biol. Chem., 2008, 283, 28361–28369 CrossRef CAS PubMed.
- Z. Lin, L. C. Johnson, H. Weissbach, N. Brot, M. O. Lively and W. T. Lowther, Proc. Natl. Acad. Sci. U. S. A., 2007, 104, 9597–9602 CrossRef CAS PubMed.
- A. De Luca, F. Sanna, M. Sallese, C. Ruggiero, M. Grossi, P. Sacchetta, C. Rossi, V. De Laurenzi, C. Di Ilio and B. Favaloro, Proc. Natl. Acad. Sci. U. S. A., 2010, 107, 18628–18633 CrossRef CAS PubMed.
- X.-J. Xiang, L. Song, X.-J. Deng, Y. Tang, Z. Min, B. Luo, W.-Q. Wen, K.-Y. Li, J. Chen, Y.-L. Ma, B.-L. Zhu, Z. Yan and G.-J. Chen, Exp. Neurol., 2019, 318, 145–156 CrossRef CAS PubMed.
- F. J. Veredas, F. R. Cantón and J. C. Aledo, Sci. Rep., 2017, 7, 40403 CrossRef CAS PubMed.
- A. Karunakaran-Datt and P. Kennepohl, J. Am. Chem. Soc., 2009, 131, 3577–3582 CrossRef CAS PubMed.
- E. M. Kaiser, R. D. Beard and C. R. Hauser, J. Organomet. Chem., 1973, 59, 53–64 CrossRef CAS.
- M. Spiekerman and B. Schrader, Free Radical Biol. Med., 1977, 16, 197–198 Search PubMed.
- E. D. Risberg, J. Mink, A. Abbasi, M. Y. Skripkin, L. Hajba, P. Lindqvist-Reis, E. Bencze and M. Sandström, J. Chem. Soc., Dalton Trans., 2009, 1328–1338 RSC.
- K. Capriotti and J. A. Capriotti, J. Clin. Asethet. Dermatol., 2012, 5, 24–26 Search PubMed.
- A. Horita and L. J. Weber, Life Sci., 1964, 3, 1389–1395 CrossRef CAS PubMed.
- T. M. Engber, E. J. Koury, S. A. Dennis, M. S. Miller, P. C. Contreras and R. V. Bhat, Neurosci. Lett., 1998, 241, 95–98 CrossRef CAS PubMed.
- E. Block, B. Dithier, B. Bechand, J. J. H. Cotelesage, G. N. George, K. Goto, I. J. Pickering, E. Mendoza Rengifo, R. Sheridan, E. Y. Sneeden and L. Vogt, J. Agric. Food Chem., 2018, 66, 10193–10204 CrossRef CAS PubMed.
- I. J. Pickering, R. C. Prince, T. C. Divers and G. N. George, FEBS Lett., 1998, 441, 11–14 CrossRef CAS PubMed.
- I. J. Pickering, G. N. George, E. Y. Yu, D. C. Brune, C. Tuschak, J. Overmann, J. T. Beatty and R. C. Prince, Biochemistry, 2001, 40, 8138–8145 CrossRef CAS PubMed.
- G. N. George, M. Gnida, D. A. Bazylinski, R. C. Prince and I. J. Pickering, J. Bacteriol., 2008, 190, 6376–6383 CrossRef CAS PubMed.
- E. Y. Yu, I. J. Pickering, G. N. George and R. C. Prince, Biochim. Biophys. Acta, 2001, 1527, 156–160 CrossRef CAS.
- I. J. Pickering, C. Wright, B. Bubner, M. W. Persans, E. Y. Yu, G. N. George, R. C. Prince and D. E. Salt, Plant Physiol., 2003, 131, 1460–1467 CrossRef CAS PubMed.
- I. J. Pickering, E. Y. Sneeden, R. C. Prince, H. H. Harris, G. Hirsch and G. N. George, Biochemistry, 2009, 48, 6846–6853 CrossRef CAS PubMed.
- E. Y. Sneeden, H. H. Harris, I. J. Pickering, R. C. Prince, S. Johnson, X. Li, E. Block and G. N. George, J. Am. Chem. Soc., 2004, 126, 458–459 CrossRef CAS PubMed.
- P. Frank, B. Hedman and K. O. Hodgson, J. Inorg. Biochem., 2014, 131, 99–108 CrossRef CAS PubMed.
- M. Gnida, E. Y. Sneeden, J. C. Whitin, R. C. Prince, I. J. Pickering, M. Korbas and G. N. George, Biochemistry, 2007, 46, 14735–14741 CrossRef CAS PubMed.
- M. J. Hackett, S. E. Smith, P. G. Paterson, H. Nichol, I. J. Pickering and G. N. George, ACS Chem. Neurosci., 2012, 3, 178–185 CrossRef CAS PubMed.
- C. L. Spiro, J. Wong, F. W. Lytle, R. B. Greegor, D. H. Maylotte and S. H. Lamson, Science, 1984, 226, 48–50 CrossRef CAS PubMed.
- G. N. George and M. L. Gorbaty, J. Am. Chem. Soc., 1989, 111, 3182–3186 CrossRef CAS.
- M. J. Grossman, M. K. Lee, R. C. Prince, K. K. Garrett, G. N. George and I. J. Pickering, Appl. Environ. Microbiol., 1999, 65, 181–188 CrossRef CAS PubMed.
- G. S. Waldo, R. M. K. Carlson, J. M. Moldowan, K. E. Peters and J. E. Penner-Hahn, Geochim. Cosmochim. Acta, 1991, 55, 801–814 CrossRef CAS.
- S. R. Kelemen, C. C. Walters, P. J. Kwiatek, H. Freund, M. Afeworki, M. Sansone, W. A. Lamberti, R. J. Pottorf, H. G. Machel and K. E. Peters, Geochim. Cosmochim. Acta, 2010, 74, 5305–5332 CrossRef CAS.
- A. E. Pomerantz, K. D. Bake, P. R. Craddock, K. W. Kurzenhauser, B. G. Kodalen, S. Mitra-Kirtley and T. B. Bolin, Org. Geochem., 2014, 68, 5–12 CrossRef CAS.
- G. N. George, M. L. Gorbaty, S. R. Kelemen and M. Sansone, Energy Fuels, 1991, 5, 93–97 CrossRef CAS.
- F. E. Huggins and G. P. Huffman, Int. J. Soc. Mater. Eng. Resour., 2002, 10, 1–13 CrossRef CAS.
- J. Majzlan, C. N. Alpers, C. B. Koch, R. B. McCleskey, S. C. B. Myneni and J. M. Neil, Chem. Geol., 2011, 284, 296–305 CrossRef CAS.
- M. A. Vairavamurthy, D. Maletic, S. Wang, B. Manowitz, T. Eglinton and T. Lyons, Energy Fuels, 1997, 11, 546–553 CrossRef CAS.
- M. J. Morra, S. E. Fendorf and P. D. Brown, Geochim. Cosmochim. Acta, 1997, 61, 683–688 CrossRef CAS.
- J. Majzlan and S. C. B. Myneni, Environ. Sci. Technol., 2005, 39, 188–194 CrossRef CAS PubMed.
- Y. Fors, F. Jalilehvand, R. E. Damian, C. Bjoerdal, E. Phillips and M. Sandström, J. Archaeol. Sci., 2012, 39, 2521–2532 CrossRef CAS.
- G. N. George, M. J. Hackett, M. Sansone, M. L. Gorbaty, S. R. Kelemen, R. C. Prince, H. H. Harris and I. J. Pickering, J. Phys. Chem. A, 2014, 118, 7796–7802 CrossRef CAS PubMed.
- J. J. H. Cotelesage, M. J. Pushie, M. Barney, A. Nissan, I. J. Pickering, L. Vogt and G. N. George, J. Phys. Chem. A, 2016, 120, 6929–6933 CrossRef CAS PubMed.
- M. J. Pushie, J. J. H. Cotelesage, L. Vogt, M. Barney, I. J. Pickering and G. N. George, J. Phys. Chem. A, 2018, 122, 3711–3712 CrossRef CAS PubMed.
- J. J. H. Cotelesage, M. Barney, L. Vogt, I. J. Pickering and G. N. George, J. Phys. Chem. A, 2017, 121, 6256–6261 CrossRef CAS PubMed.
- L. I. Vogt, N. V. Dolgova, J. J. H. Cotelesage, M. Barney, S. Sharifi, I. J. Pickering and G. N. George, J. Phys. Chem. A, 2019, 123, 2861–2866 CrossRef CAS PubMed.
- I. J. Pickering, M. Barney, A. Nissan, J. J. H. Cotelesage, M. J. Pushie, R. C. Princeand and G. N. George, J. Phys. Chem. A, 2016, 120, 7279–7286 CrossRef CAS PubMed.
- D. H. Templeton and L. K. Templeton, J. Appl. Crystallogr., 1988, 21, 151–153 CrossRef.
- F. W. Lytle, R. B. Greegor, D. R. Sandstron, E. C. Marques, J. Wong, C. L. Spiro, G. P. Huffman and F. E. Huggins, Nucl. Instrum. Methods Phys. Res., 1984, 226, 542–548 CrossRef CAS.
- H. Sekiyama, N. Kosugi, H. Kuroda and T. Ohta, Bull. Chem. Soc. Jpn., 1986, 59, 575–579 CrossRef CAS.
- S.-J. Lee, C. J. Titus, R. Alonso Mori, M. L. Baker, D. A. Bennett, H. S. Cho, W. B. Doriese, J. W. Fowler, K. J. Gaffney, A. Gallo, J. D. Gard, G. C. Hilton, H. Jang, Y. I. Joe, C. J. Kenney, J. Knight, T. Kroll, J.-S. Lee, D. Li, D. Lu, R. Marks, M. P. Minitti, K. M. Morgan, H. Ogasawara, G. C. O'Neil, C. D. Reintsema, D. R. Schmidt, D. Sokaras, J. N. Ullom, T.-C. Weng, C. Williams, B. A. Young, D. S. Swetz, K. D. Irwin and D. Nordlund, Rev. Sci. Instrum., 2019, 90, 113101 CrossRef PubMed.
- G. N. George, 2001, http://www-ssrl.slac.stanford.edu/exafspak.html.
- B. Delley, J. Chem. Phys., 1990, 92, 508–517 CrossRef CAS.
- B. Delley, J. Chem. Phys., 2000, 113, 7756–7764 CrossRef CAS.
- J. P. Perdew, K. Burke and M. Ernzerhof, Phys. Rev. Lett., 1996, 77, 3865–3868 (Erratum, 1997, 78, 1369) CrossRef CAS PubMed.
- A. Klamt and G. Schüürmann, J. Chem. Soc., Perkin Trans. 2, 1993, 799–805 RSC.
- K. Hermann, L. G. M. Pettersson, M. E. Casida, C. Daul, A. Goursot, A. Koester, E. Proynov, A. St-Amant, D. R. Salahub, V. Carravetta, H. Duarte, N. Godbout, J. Guan, C. Jamorski, M. Leboeuf, V. Malkin, O. Malkina, M. Nyberg, L. Pedocchi, F. Sim, L. Triguero and A. Vela, StoBe-deMon Code, 2001 Search PubMed.
- J. P. Perdew and Y. Wang, Phys. Rev. B: Condens. Matter Mater. Phys., 1986, 33, 8800 CrossRef PubMed.
- J. P. Perdew, Phys. Rev. B: Condens. Matter Mater. Phys., 1986, 33, 8822–8824 CrossRef PubMed.
- J. P. Perdew, Phys. Rev. B: Condens. Matter Mater. Phys., 1986, 34, 7406 CrossRef.
- W. Kutzelnigg, U. Fleischer and M. Schindler, NMR Basic Principles and Progress, Springer, Berlin, Heidelberg, NewYork, 1990 Search PubMed.
- E. D. Risberg, F. Jalilehvand, B. O. Leung, L. G. M. Pettersson and M. Sandström, J. Chem. Soc., Dalton Trans., 2009, 3542–3558 RSC.
- S. C. Abrahams, Acta Crystallogr., 1957, 10, 417–422 CrossRef CAS.
- C. Brouder, J. Phys.: Condens. Matter, 1990, 2, 701–738 CrossRef CAS.
- I. J. Pickering and G. N. George, Inorg. Chem., 1995, 34, 3142–3152 CrossRef CAS.
- F. Neese, Wiley Interdiscip. Rev.: Comput. Mol. Sci., 2012, 2, 73–78 CAS.
- J. T. Henthorn, R. J. Arias, S. Koroidov, T. Kroll, D. Sokaras, U. Bergmann, D. C. Rees and S. DeBeer, J. Am. Chem. Soc., 2019, 141, 13676–13688 CrossRef CAS PubMed.
| This journal is © The Royal Society of Chemistry 2020 |