
 Open Access Article
 This Open Access Article is licensed under a Creative Commons Attribution-Non Commercial 3.0 Unported Licence
Luminescent chitosan/carbon dots as an effective nano-drug carrier for neurodegenerative diseases†
Sheril Ann Mathewa,
P. Praveenaa,
S. Dhanavelb,
R. Manikandanc,
S. Senthilkumar d and
A. Stephen*a
d and
A. Stephen*a
aDepartment of Nuclear Physics, University of Madras, Guindy Campus, Chennai, India. E-mail: stephen_arum@hotmail.com; stephen@unom.ac.in; Tel: +91-44-22202802
bMaterials Chemistry & Metal Fuel Cycle Group, Indira Gandhi Centre for Atomic Research (IGCAR), Kalpakkam, 603102, India
cDepartment of Zoology, University of Madras, Guindy Campus, Chennai, India
dDepartment of Chemistry, School of Advanced Sciences, Vellore Institute of Technology (VIT), Vellore-632014, India
First published on 25th June 2020
Abstract
Designing new materials for effective and targeted drug delivery is pivotal in biomedical research. Herein, we report on the development of a chitosan/carbon dot-based nanocomposite and investigate its efficacy as a carrier for the sustained release of dopamine drug. The carbon dots (CDs) were synthesized from the carbonization of chitosan and were further conjugated with chitosan (CS) to obtain a chitosan/carbon dot (CS/CD) matrix. Dopamine was later encapsulated in the matrix to form a dopamine@CS/CD nanocomposite. The cytotoxicity of IC-21 and SH-SY5Y cell lines was studied at various concentrations of the nanocomposite and the results demonstrate around 97% cell viability. The photoluminescence property revealed the characteristic property of the carbon dots. When excited at 510 nm an emission peak was observed at 550 nm which enables the use of carbon dots as a tracer for bioimaging. The HRTEM images and the D, G, and 2D bands of the Raman spectra confirm the successful synthesis of carbon dots and through DLS the particle size is estimated to be ∼3 nm. The release studies of the encapsulated drug from the composite were analyzed in an in vitro medium at different pH levels. The novelty of this method is the use of a non-toxic vehicle to administer drugs effectively towards any ailment and in particular, the carbon dots facilitate the consistent release of dopamine towards neurodegenerative diseases and tracing delivery through bioimaging.
Introduction
Manipulating the structure of matter on a length scale of nanometres is one of the main areas of research today. Due to the immense growth of technology, life expectancy and quality of life have increased exponentially. With the dawn of nanotechnology, progress in research, especially in the field of medicine, has reached new dimensions.1 Delivering therapeutics to specific sites with the help of nanotechnology is currently being researched extensively.2,3 Particularly, nanocomposites are used as carriers to deliver drugs to the affected area in cancer treatments.4 This decreases the side effects and enhances efficiency and is an excellent substitute in cancer treatment with desirable results.5 Since nano drug delivery carriers have numerous advantages they can be employed and used as carriers of therapeutics for a wide range of ailments. Neurodegenerative diseases in an organism occur due to various causes like head injuries, defective proteins, toxins etc. But the pathology and etiology of these diseases are yet to be confirmed.6–8 Parkinson's disease (PD), Huntington's disease (HD), Alzheimer's disease (AD) are a few to be mentioned. The main obstacle in the treatment of such brain related ailments is the difficulty in permeability of therapeutics through the Blood Brain Barrier (BBB). The barrier which separates the blood from the cerebrospinal fluid has highly selective permeability.9 It hinders the passage of highly polar, large size non-lipophilic substances. Therefore, carriers are utilised to transport the drugs to the desired area. Synthesizing efficient carriers to achieve this goal is an upcoming area of research.10,11In Parkinson's disease, death of dopaminergic neurons leads to decrease in the amount of dopamine in the brain. Due to this, motor action of the patient is impaired. As time progresses the quality of life deteriorates. Currently the treatment administered in the early stages of the disease is L-dopa which is the precursor of dopamine.12 It crosses the BBB and L-amino acid decarboxylase or DOPA decarboxylase converts L-dopa to dopamine.13,14 As dopamine is a highly polar large molecule, it cannot cross the barrier. In this study dopamine is encapsulated in the chitosan/carbon dot (CS/CD) matrix so that it can be efficiently delivered across the barrier to the brain. An excess dose of L-dopa is harmful due to its side effects. Therefore, synthesizing an efficient carrier for dopamine to cross the barrier is the main aim of the work.
The design of an efficient nanocarrier requires a biocompatible material with good binding and release property. Chitosan has been reported as an excellent carrier of drug for targeted drug delivery in cancer treatment, wound treatment, tissue regeneration etc.15–17 Yadav et al., 2017 has reported that chitosan is used as a matrix to mediate the transfer of doxycycline hydrochloride across the blood brain barrier.18 Due to its bioavailability and biodegradability chitosan is an excellent choice in biomedical applications.19,20 It is a suitable matrix that will provide a firm base in the encapsulation of the drug.21
Numerous materials are researched to study its ability in biomedical applications and the less toxicity of carbon dots makes it an ideal candidate.22,23 Cell permeability and water solubility makes carbon dots an excellent choice as drug delivery carrier. Carbon dots can be functionalized easily and also has excellent luminescent properties. Therefore, these can be used as tracers or makers to monitor the metabolism. These tracers will help us understand the path followed by the nanocarriers encapsulating the drug, and the process by which these drug molecules are delivered to the target.24,25 Hence carbon nanodots are an ideal filler that can be used to synthesize a nanocarrier suitable to deliver drug across the blood brain barrier.
Experimental
Chemicals
Low molecular weight chitosan (∼85% deacetylated) and dopamine hydrochloride was purchased from Sigma Aldrich. Analytical grade chemicals and double distilled was employed for all experiments and analysis.Synthesis of carbon dots (CD)
1 g of chitosan, a natural biopolymer was subjected to heating in a muffle furnace at 300 °C for 2 hours. The heating rate of the furnace is 4 °C per minute. On cooling, the powder was collected, dispersed in water and centrifuged to obtain carbon nanodots through carbonization of chitosan.Synthesis of chitosan/carbon dots (CS/CD)
Optimised amount of chitosan was dissolved in 98 mL of distilled water and 2 mL of acetic acid. 5 wt% of carbon dots were added to the solution and maintained at 80 °C for 30 min. The settled precipitate was then washed several times and dried in the air oven at 60 °C.Synthesis of dopamine@chitosan/carbon dots (dopamine@CS/CD)
The drug nanocomposite was synthesized by a simple chemical procedure. Optimal amount of chitosan was dissolved to form a solution. 0.017 g of the drug, dopamine hydrochloride was added to the solution and was encapsulated in the chitosan matrix. The solution was continuously kept under stirring and sonication in order to prevent agglomeration and for even distribution. Subsequently TPP and tween80 was simultaneously mixed with the solution. After 2 hours 0.017 g of carbon dots were added to the mixture. Following the addition of carbon dots, the solution was continued to be kept under stirring and sonication for an hour. The drug loaded chitosan carbon dots nanocomposite precipitate had settled down overnight. The precipitate was collected and dried and was subjected to further characterization. The experiment was carried out at ambient temperature i.e. 25 °C throughout the synthesis. The synthesis procedure of the preparation of dopamine@CS/CD nanocomposite is explained and depicted pictorially in graphical abstract. A detailed flowchart for the preparation of dopamine@chitosan/carbon dots is given in Fig. S1.†Instrumentation
XRD patterns were obtained from GE-XRD 3003 TT with CuKα1 radiation (λ = 1.5406 Å) for 2θ = 5–60°. The UV/VIS data was taken from PerkinElmer UV Lambda 650 UV/VIS spectrometer. The TGA analysis was carried out using NETZSCH STA 2500 instrument. PL spectra was recorded using Horiba/Jobin Yvon FluoroLog-3 Modular Spectrofluorometer. JASCO FT/IR-6600 spectrometer was used to record the Fourier transform infrared spectrum. The AFM instrument in non-contact mode with model number MFP-3D was used to record the images. HRTEM was carried out using FEI-TECNAI G2-20 TWIN 200 kV instrument. The Raman characterization is done using the instrument LABRAM HR-[Horiba-Jobin Yvon]. Horiba Scientific Horiba SZ-100 instrument was utilised to record the particle size from DLS analysis. ZEISS Gemini SEM 300 was used to record the FESEM images and EDX.Results and discussion
The successful synthesis of carbon dots was confirmed by subjecting the as-synthesized material to different characterization techniques. Carbonization technique allows us to convert an organic material into carbon when subjected to extreme heat or pressure. The carbonization was confirmed by Fourier Transform Raman spectroscopy (FT-Raman). The spectrum results depicted a strong D band at 1378 cm−1, G band at 1580 cm−1 and a 2D phonon peak around 2400 cm−1 as shown in Fig. 1A and B. The presence of the 2D peak confirms that the carbon dots have numerous functional groups attached to its surface.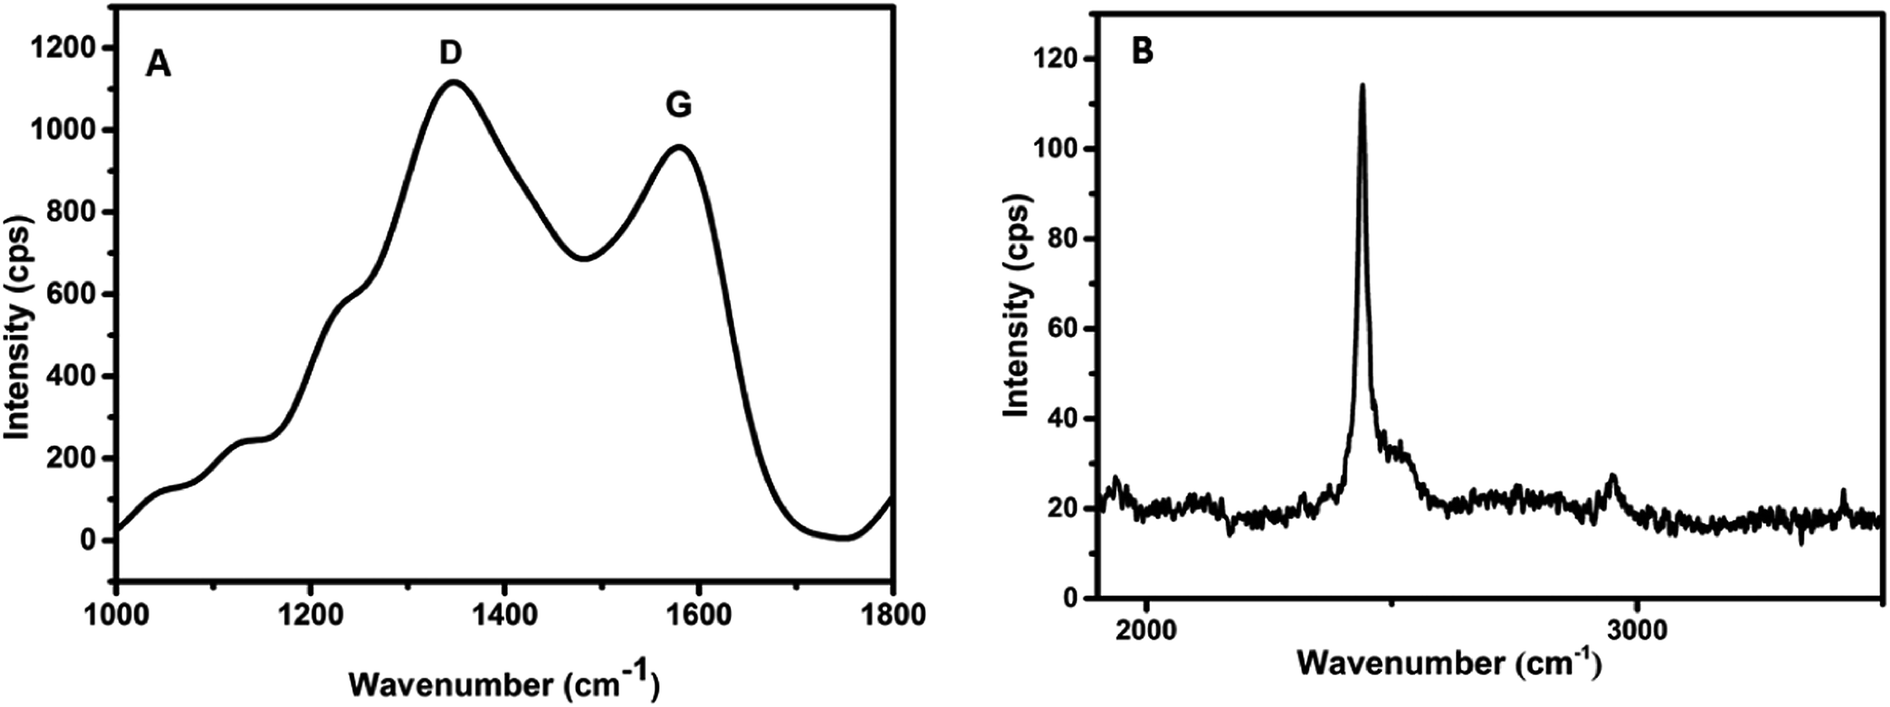 | ||
| Fig. 1 Raman spectra of as prepared carbon dots. (A) D, G bands, (B) 2D bands. | ||
The intensity ratio, ID/IG was calculated to be 1.16, indicating the presence of defects or amorphous carbon. This gives a measure of the degree of graphitization. The considerably higher value is due to the presence of surface defects. These surface defects are related to the oxygenated and nitrogenated groups on the surface of carbon dots.26–29 The D, G and the 2D bands seen in the Raman spectrum, helps in characterising the sp2 hybridisation in carbon dots. The presence of D, G and the 2D phonon interaction bands, confirms the carbonization of chitosan.
The HRTEM images of the carbon dots (dark spots) are shown in Fig. 2A and B. From the image the spherical morphology and the particle size of the synthesized material is confirmed. The high-resolution images provide further evidence for the even distribution of particles and are comparable with the AFM results. With the help of ImageJ software the particle size was calculated from the images by plotting a histogram and the approximate particle size was found to be 3 nm. The AFM image as portrayed in Fig. 2C displays the surface morphology of the carbon dots. The surface roughness value as measured from RMS value appears to vary from 1–6 nm. This confirms that carbon dots can be synthesized from chitosan and the particles are evenly distributed. The image obtained from AFM is consistent with the HRTEM images obtained. The size of the prepared carbon dots was confirmed as 2.7 nm through dynamic light scattering analysis which is shown in Fig. 2D. This confirms that nanosized carbon dots have been successfully synthesized and supports the HRTEM analysis. The thermal stability of the prepared carbon dots was analysed by using thermogravimetric analysis was shown in Fig. S2.†
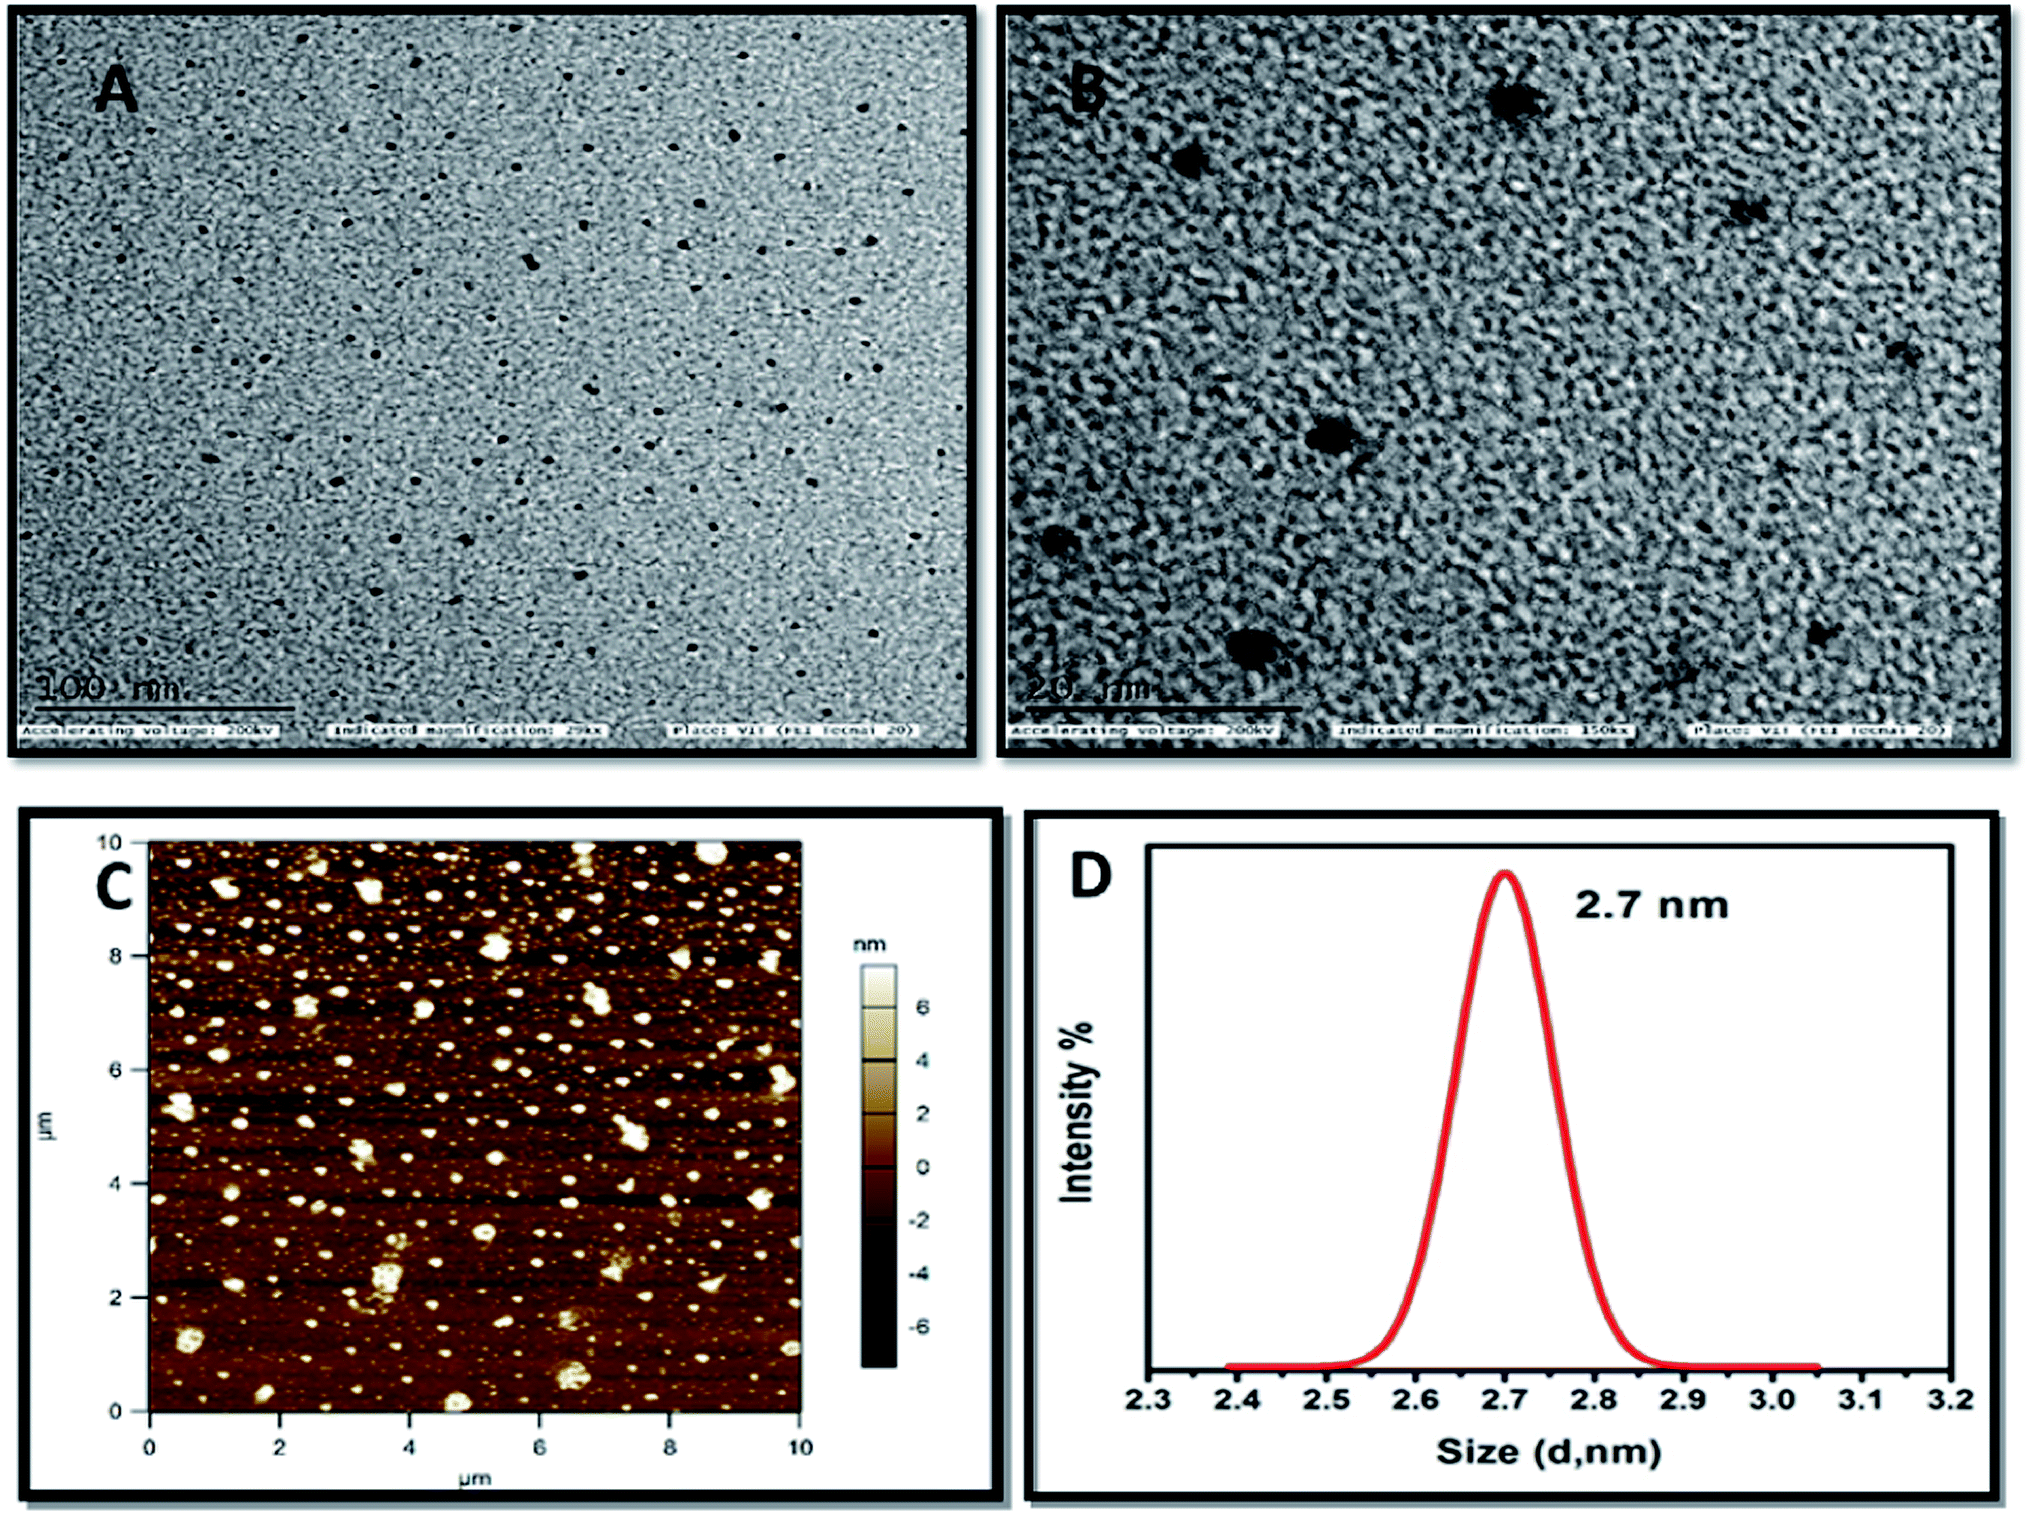 | ||
| Fig. 2 HRTEM images of as synthesized carbon dots (A). Low magnification (B). High magnification (C). AFM image of as prepared carbon dots (D). DLS spectra of as prepared carbon dots. | ||
Optical properties and bioimaging application of CDs
The emission property of the carbon dots was examined within the excitation range between 260–310 and 400–510 nm. When excited at 280 nm and further at 310 nm, strong emission peaks at 415 and 400 nm respectively was observed as seen in Fig. 3A. From these results it is concluded that when excited within the range between 260–310 nm (seen from Fig. S3† and 3A), the emission peak shifts to the lower wavelength. This proves that the prepared carbon dots exhibit excitation dependent emission spectra. When there is a change in the excitation wavelength there is a peak shift and decrease in intensity in the emission. Similar results have been reported by various other groups.30–34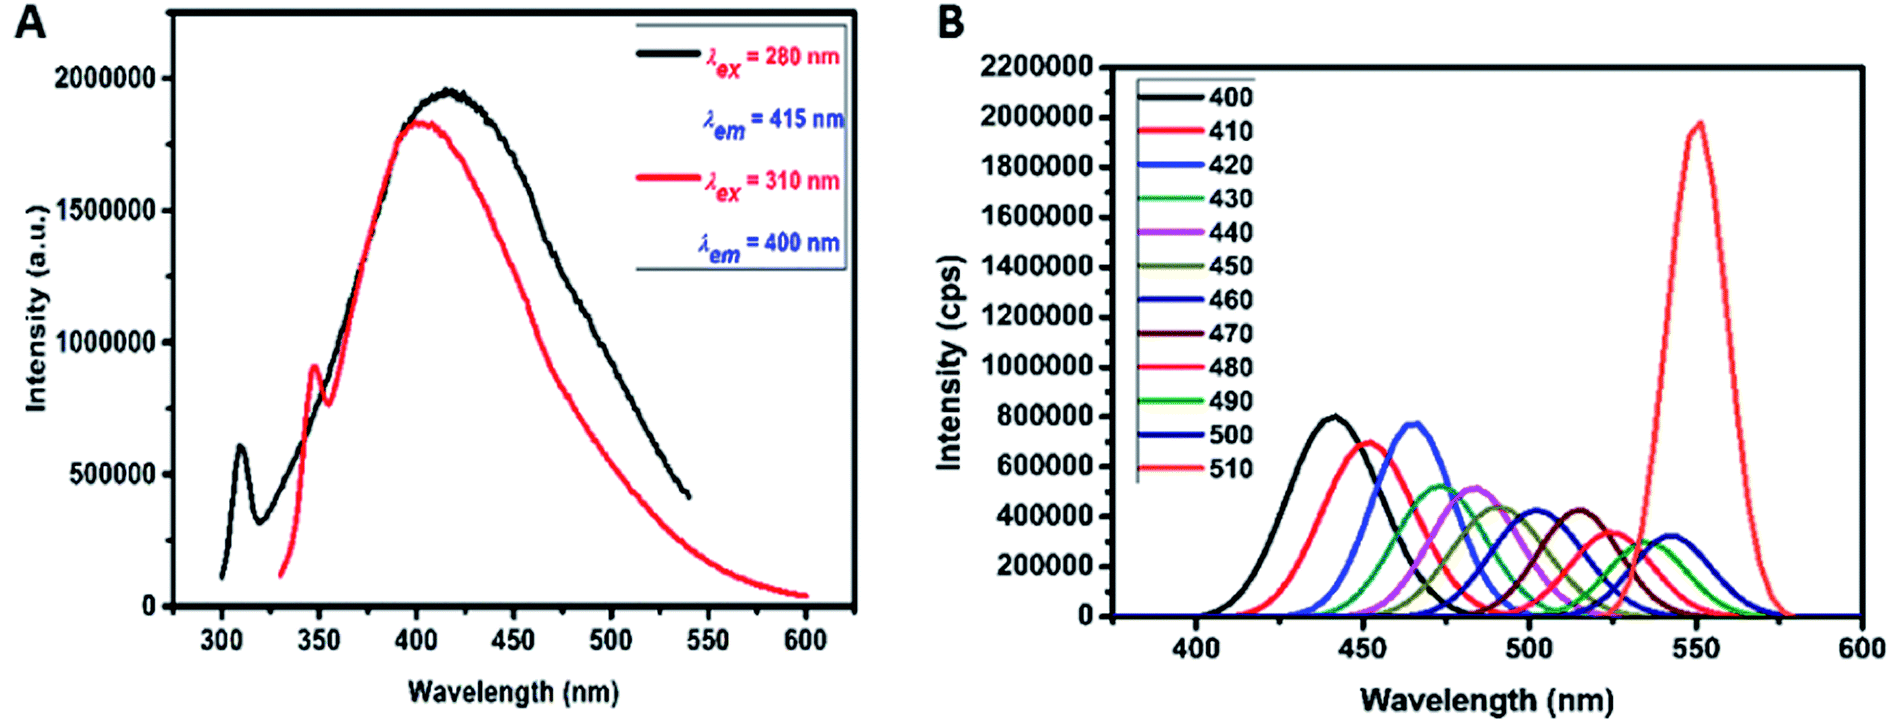 | ||
| Fig. 3 (A) PL emission for excitation of carbon dots at 280 and 310 nm. (B) Excitation emission spectrum of carbon dots for the excitation from 400 to 510 nm. | ||
It was also observed in Fig. 3B that when excited at higher wavelengths from 400–510 nm, strong emission peaks appear in the visible region. In this region, maximum emission was seen at 550 nm for excitation at 510 nm. Therefore, this material displays favourable up-conversion properties that can be used for bioimaging applications. This property may be attributed to two or multiphoton active processes. Xin Lui et al. (2016) suggests that pH dependent emission studies reveal that there is a maximum emission of the as-prepared carbon dots in pH 4. As pH increases there is a decrease in the emission peak intensity.35
Characterisation of dopamine@CS/CD composite
Ultraviolet-visible spectroscopic studies were carried out to analyse the optical properties of the samples. UV-Vis spectrum of carbon dots and chitosan/carbon dots (CS/CD) are depicted in Fig. 4A. The π–π* transition of C![[double bond, length as m-dash]](https://www.rsc.org/images/entities/char_e001.gif) C is seen in the broad absorption peak around 260 nm. The carbon dots are amino functionalised due to the presence of NH2 groups in chitosan as reported by Wang H., et al.36–39 In the absorption spectra of the composite, a shift in peak and peak broadening was observed due to the formation of nanocomposite and chitosan–carbon dot interaction.
C is seen in the broad absorption peak around 260 nm. The carbon dots are amino functionalised due to the presence of NH2 groups in chitosan as reported by Wang H., et al.36–39 In the absorption spectra of the composite, a shift in peak and peak broadening was observed due to the formation of nanocomposite and chitosan–carbon dot interaction.
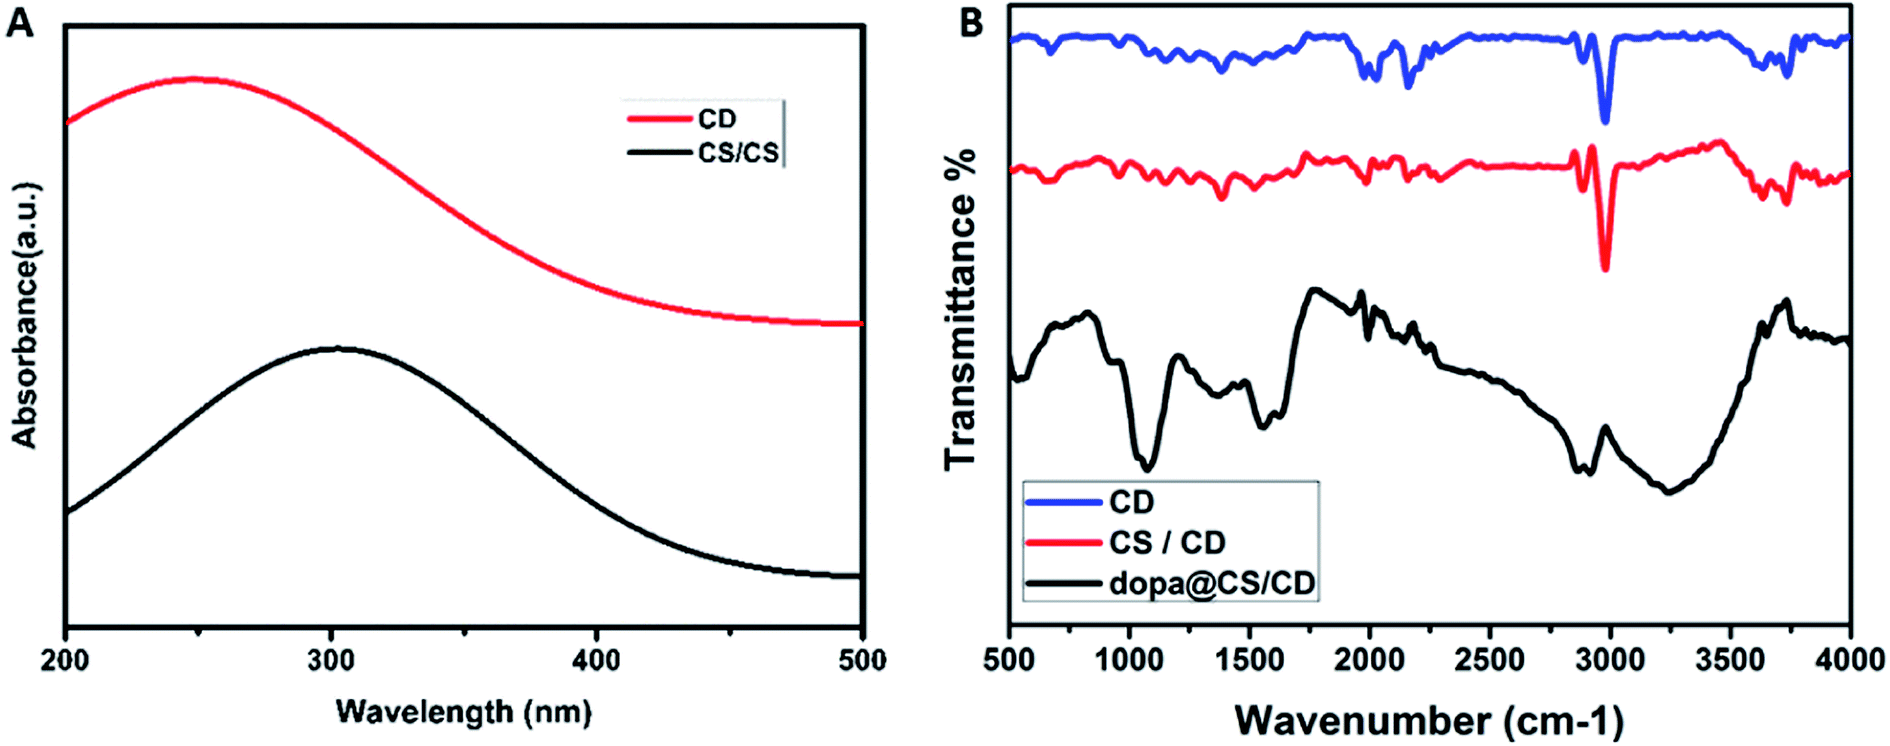 | ||
| Fig. 4 (A) UV absorption spectra of carbon dots and chitosan carbon dots. (B) FTIR spectrum of CD, CS/CD and dopamine@CS/CD nanocomposite. | ||
In the FTIR spectra of carbon dots, chitosan/carbon dots and dopamine@chitosan/carbon dots are depicted in Fig. 4B. The N–H stretching vibrations at 3000 cm−1 represents the presence of nitrogen. It confirms the formation of amine functionalized carbon dots. The peak at 3000 cm−1 also denotes alkane stretching vibrations. The peaks at 2145, 2242, 2030 and 1980 cm−1 denote nitrile (C![[triple bond, length as m-dash]](https://www.rsc.org/images/entities/char_e002.gif) N) and alkyne (CC) stretching vibrations respectively.40,41 There is a decrease in the intensity of the nitrile peaks and an increase in the N–H peak simultaneously. The spectra of dopamine@chitosan/carbon dots confirmed the loading of dopamine into the nanocomposite. The peak at 3450 and 3246 cm−1 corresponds to the O–H and N–H stretching respectively and 2917, 2860 cm−1 corresponds to C–H stretching vibration of both chitosan and carbon dots. 1645 and 1561 cm−1 correspond to N–H bending vibration of dopamine. 1362 cm−1 (CC, CN and CC–O groups) are the characteristic peaks for carbon dots. 1500–500 cm−1 is known as the fingerprint region of the resultant spectrum and the peaks observed here i.e. 1068 and 543 cm−1 are the characteristic peaks of dopamine. (C–H bending vibrations of the pyranose ring).42
N) and alkyne (CC) stretching vibrations respectively.40,41 There is a decrease in the intensity of the nitrile peaks and an increase in the N–H peak simultaneously. The spectra of dopamine@chitosan/carbon dots confirmed the loading of dopamine into the nanocomposite. The peak at 3450 and 3246 cm−1 corresponds to the O–H and N–H stretching respectively and 2917, 2860 cm−1 corresponds to C–H stretching vibration of both chitosan and carbon dots. 1645 and 1561 cm−1 correspond to N–H bending vibration of dopamine. 1362 cm−1 (CC, CN and CC–O groups) are the characteristic peaks for carbon dots. 1500–500 cm−1 is known as the fingerprint region of the resultant spectrum and the peaks observed here i.e. 1068 and 543 cm−1 are the characteristic peaks of dopamine. (C–H bending vibrations of the pyranose ring).42
The particle size of the composite was evaluated as shown in Fig. 5 using dynamic light scattering technique. Average particle size was calculated as ∼144 nm. Decreasing the particle size ensures dissolution and increase in the bioavailability of the drug. This particle size (144 nm) will also support interfacial interaction with the cell membranes compared to larger size nanocomposites.
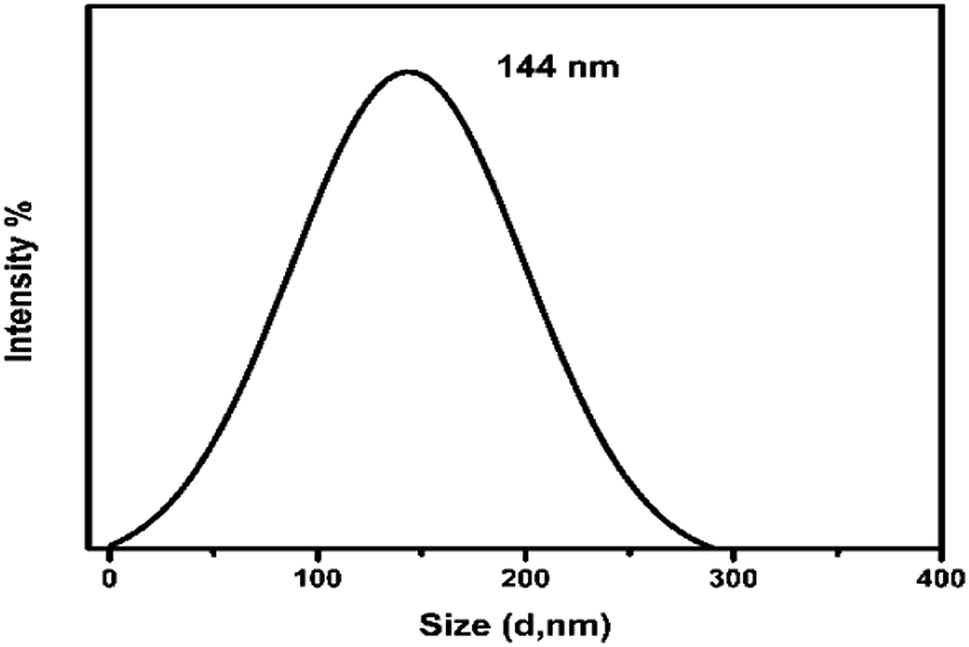 | ||
| Fig. 5 DLS spectra of the dopamine@CS/CD nanocomposite depicting the average particle size. | ||
The X-ray diffraction (XRD) pattern of carbon dots, pure dopamine and dopamine@CS/CD are given in Fig. 6. The XRD pattern of CS/CDs shows the presence of peaks at 2θ ∼ 11.3° and 25° corresponding to chitosan and carbon respectively.43,44 The broadened peak at 25° confirms the carbonization of the material, which was attributed to highly disordered carbon atoms. In the XRD pattern of dopamine@CS/CD the characteristic peaks that are responsible for dopamine are seen. The interlayer spacing of ∼3.56 Å further confirms the formation of carbon dots.
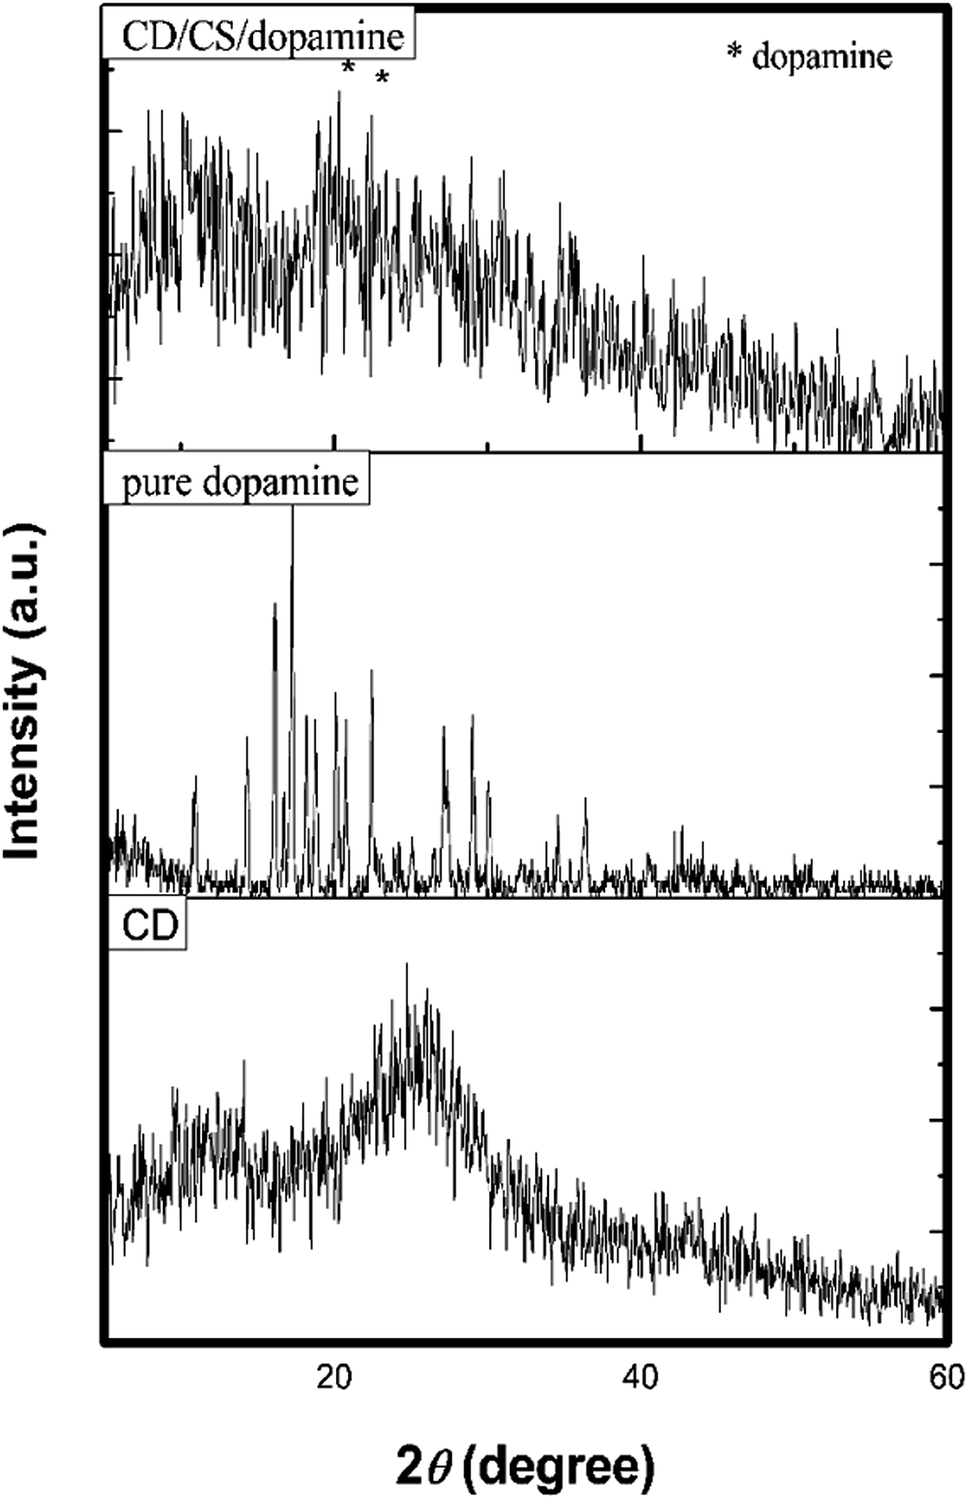 | ||
| Fig. 6 XRD spectra of carbon dots, pure dopamine, dopamine@CS/CD nanocomposite. | ||
The FESEM images of dopamine encapsulated CS/CD shows porous and chain/fibre like morphological structures. Rough surface of chitosan with uneven structure are vividly seen. The images with low and high magnification are depicted Fig. 7A and B respectively. The EDX spectrum of the above image as seen in Fig. 7C, clearly shows peaks attributed to C, N and O only, which is evidence that no impurities are present. The encircled area in both Fig. 7A and B are enlarged in Fig. 7D. These images clearly show the nano particles embedded in the porous and fibrous composite matrix. The zeta potential measured was shown in Fig. S4† and the dopamine encapsulated CS/CD composite was found to be ∼−37 mV.
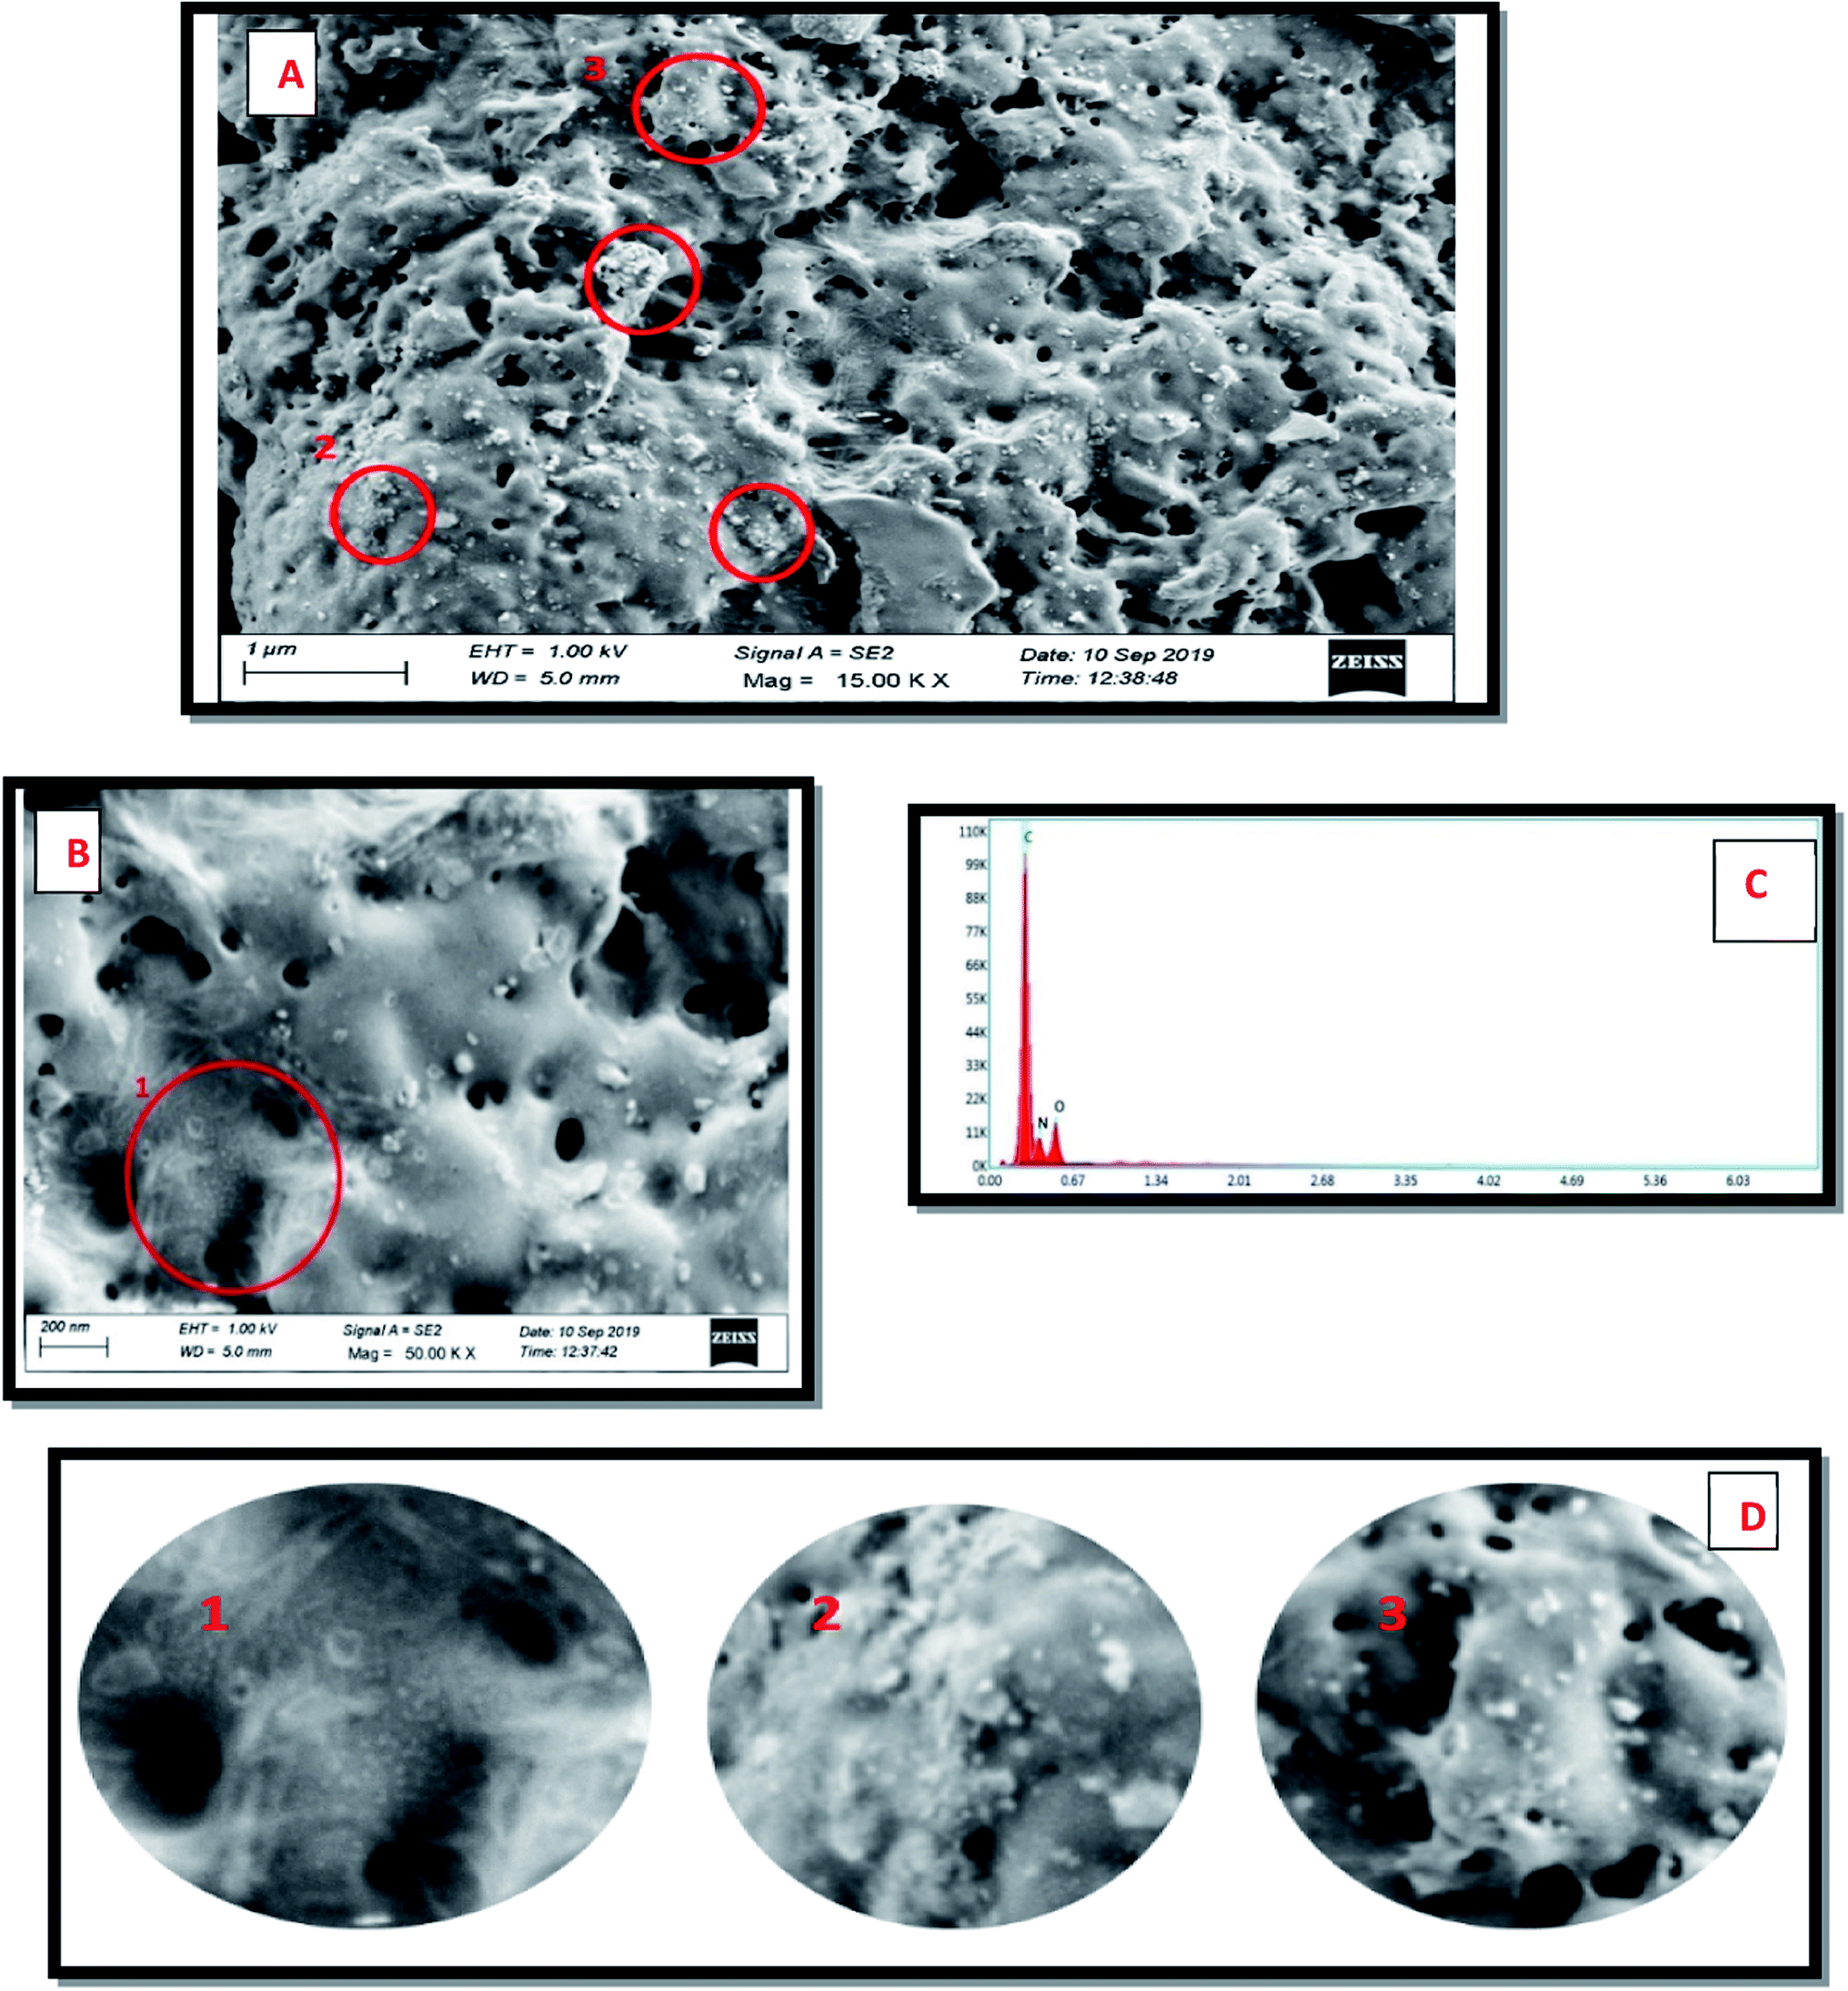 | ||
| Fig. 7 FESEM images of dopamine@CS/CD nanocomposite. (A) Low magnification, (B) High magnification, (C) EDX spectrum of the encircled region in (A), (D) enlarged circled areas numbered 1, 2 and 3 in (A) and (B). | ||
Application in drug delivery (in vitro drug release)
The dopamine@CS/CD has to function as an efficient drug delivery carrier and exhibit excellent sustained release. The release kinetics of the drug from the dopamine@CS/CD nanocomposite was studied by dispersing the composite in a tightly sealed dialysis bag (MWCO 1000 Da) and suspended in 60 mL of PBS buffer solution maintained at pH 4 and pH 7 to study the pH dependant release. About 3 mL was removed and stored at different intervals of time from the PBS. For every 3 mL of the buffer solution removed equal amount of fresh buffer was added to maintain the volume of the buffer at 60 mL. The schematic representation for our investigation on the in vitro release of the drug from the composite is given in ESI (Fig. S5†). Dopamine has a strong absorption peak at 280 nm. By measuring the intensity of the UV absorption peaks of the buffer solution removed and stored at different time intervals, the percentage of cumulative release can be calculated.Fig. 8A and B shows the graph of cumulative release of drug vs. time in pH 4 and pH 7 respectively. In order to calculate the amount of drug released from the spectroscopic data, a correlation graph between the known concentrations of drug vs. intensity of UV absorption was studied. Serial dilution of the drug in the PBS was carried out and an absorption maximum for the corresponding concentration ranging from 500 μg mL−1 to 5 μg mL−1 was noted. From the results of the serial dilution, a direct relation between the absorption maxima and concentration of drug is established. Initially the concentration of drug in 60 mL buffer is zero at time t = 0. As time progresses, the drug is released from the composite steadily. This steady increase can be analysed from the absorption maxima which in turn provides the concentration of drug released. The concentration of released drug is represented in percentage as the cumulative release. From the cumulative release studies, it is observed that 60% of the encapsulated drug was released from the nanocomposite when the buffer was maintained at pH 4 whereas for the buffer maintained at pH 7 only 4.5% of drug was released. This proves that the composite displays pH dependant release mechanism. Different pH is considered in this study from the observation that the healthy cells have pH similar to neutral (pH 7) and defective cells have a much lower pH. Several mathematical models explain the dissolution kinetics of the drug in the blood stream. They are zero order, first order, Higuchi, Hixson–Crowell and Korsmeyer–Peppas models. By evaluating the model with respect to the cumulative release the drug release profile can be correlated to the drug release kinetics.45–48 The drug release kinetics were studied by dividing the plot onto two regions. Region 1 was from 1–12 h and region 2 from 13 to 26 h. For the first twelve hours the correlation co-efficient for all the mathematical models were calculated. In region 1 as seen in Fig. 8C, the R2 value for zero order kinetics was maximum. Therefore, during the first twelve hours the release follows zero order kinetics. The equation of a zero-order kinetic reaction is given below in eqn (1).
| C0 − Ct = K0t | (1) |
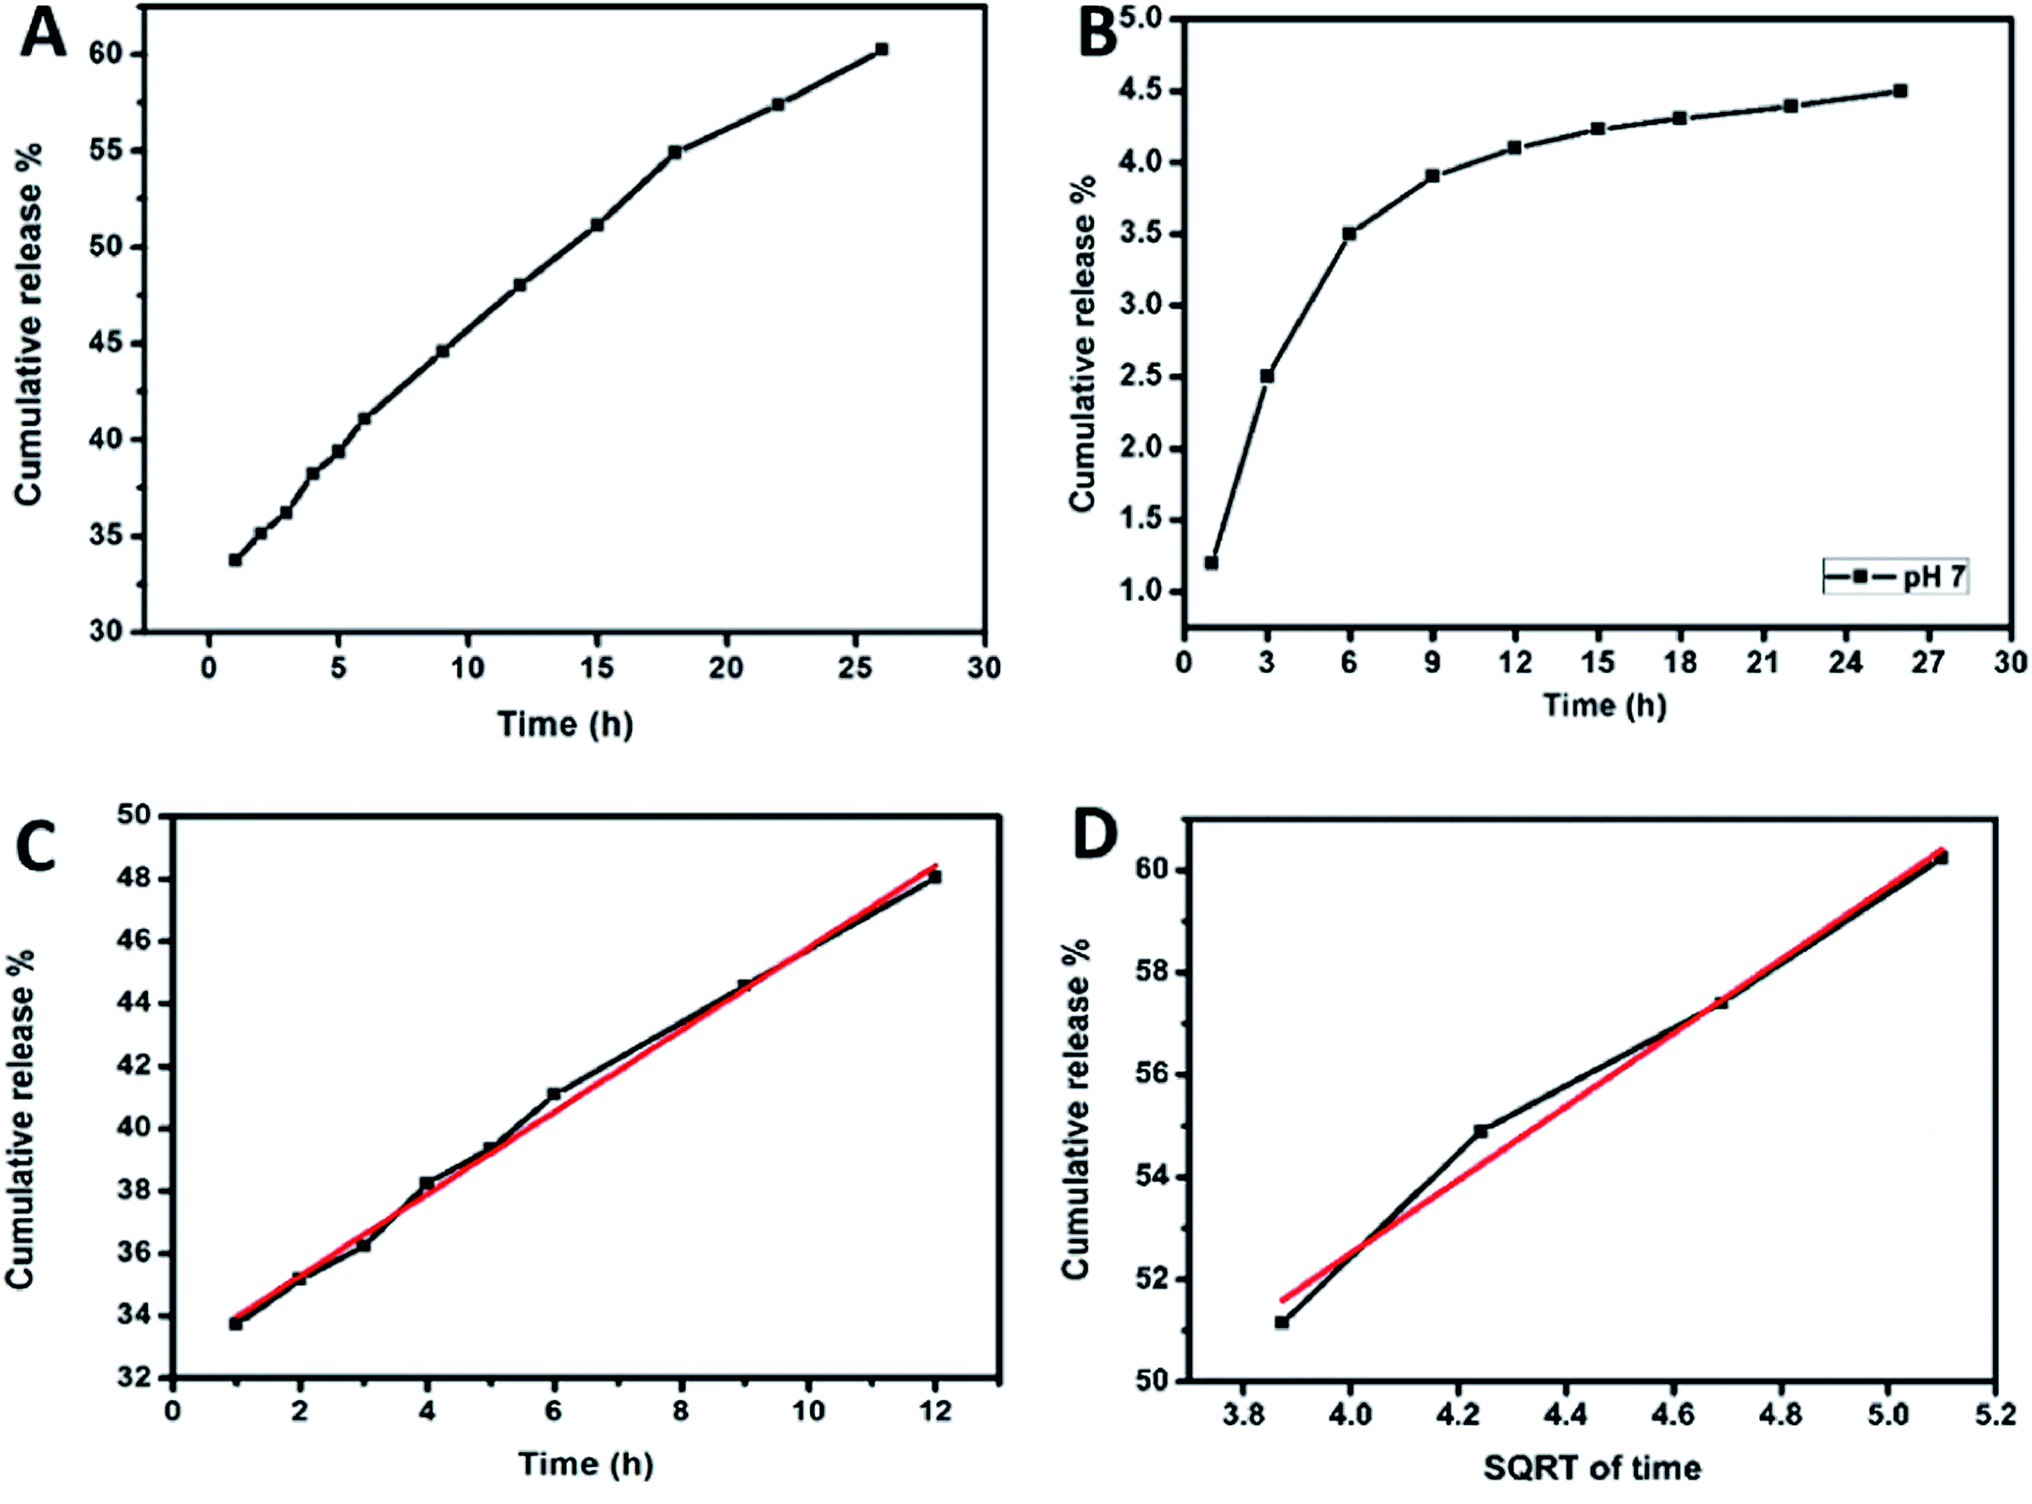 | ||
| Fig. 8 Cumulative drug release of dopamine from (A) dopamine@CS/CD nanocomposite at pH 4. (B) Dopamine@CS/CD nanocomposite at pH 7. (C) Zero order release kinetics observed in region 1. (D) Higuchi model release kinetics observed in region 2. | ||
Zero order kinetic release portrays that there is constant drug release from the nanocomposite. Since the release follows zero order kinetics during the first twelve hours with an R2 value of 0.993 we can confirm that there is no initial burst release and also there is continuous release of drug in the blood stream. There is control in the release which ensures that more amount of the drug will be utilised effectively. Therefore, for the first twelve hours there is a constant amount of drug in the blood stream. From the Korsmeyer–Peppas kinetics model the diffusion co-efficient obtained was ∼0.14. Since it has a value between 0 to 0.5, Fick's diffusion or diffusion-controlled release is observed.
From the correlation co-efficient for region 2 for different mathematical models, it is evident that Higuchi kinetics is followed with an R2 value of 0.98 as shown in Fig. 8D. Higuchi kinetics is seen while evaluating drug release from a polymer matrix. Since the kinetics followed in Higuchi model, Korsmeyer–Peppas helps in determining the type of diffusion that is followed. The diffusion coefficient is calculated to be 0.28 and Fickian diffusion is observed. The release kinetics suggests that there is controlled release of drug from the composite for a period of 24 hours. Higuchi reaction is expressed by the following eqn (2).
| Q = KH × t1/2 | (2) |
The encapsulation efficiency of the drug and the drug loading efficiency was estimated (as shown in the ESI E1 and E2†). The encapsulation efficiency of the dopamine on to the CS/CD nanocomposite was calculated to be 82%. The drug loaded efficiency of the composite is approximately 32%. As inferred from literature survey, Richa Pahuja et al. (2015)49 and Naveen K. Jain et al. (1998)50 had reported an encapsulation efficiency of 35.55% and 40.5% for the delivery of dopamine using a PLGA and liposomes nanocarrier respectively. On comparison with the above the encapsulation efficiency of dopamine@CS/CD nanocomposite is found to be better with sustained release of dopamine in time.
Cytotoxicity
An effective way to find neurotoxicity of the nanocomposite was to use SH-SY5Y differentiated cell culture. 96-well plates with cells were plated for 24 h at 37 °C on at a density of 3 × 10⁴ cells per well. Nutrient mixture-12 Ham, Kaighn's modification – HiMedia was used as the culture. After 24 h the cells were treated with the dopamine@CS/CD nanocomposite in a medium containing 2% FBS. The nanocomposite was ultrasonicated in water 10 mg mL−1 stock. The cells were incubated for 24 h, and the viability of the cells in the presence of the composite was evaluated.The images of the cell viability at control and different concentration of the nanocomposite are given in Fig. 9. As shown in Fig. 10 and S6,† after 24 h, the viability of treated SH-SY5Y and IC-21 cell lines at different concentrations of the nanocomposite (10, 25, 50, 100, 200, 400 μg mL−1) and (12.5, 25, 50, 75, 100 μg mL−1) is seen, respectively. The cell viability of these cell lines was approximately 97%. Results reveal that the composite had no toxic effect on the cell viability of the treated cell line and the morphology of the cells was retained. Hence this composite can be efficiently used as a drug vehicle because of its high biocompatibility. The dopamine@CS/CD nanocomposite being biocompatible and having particle size well within the range can transport dopamine across the selectively permeable blood brain barrier, thereby making it available for neurotransmission to control motor action in patients with Parkinson's disease.
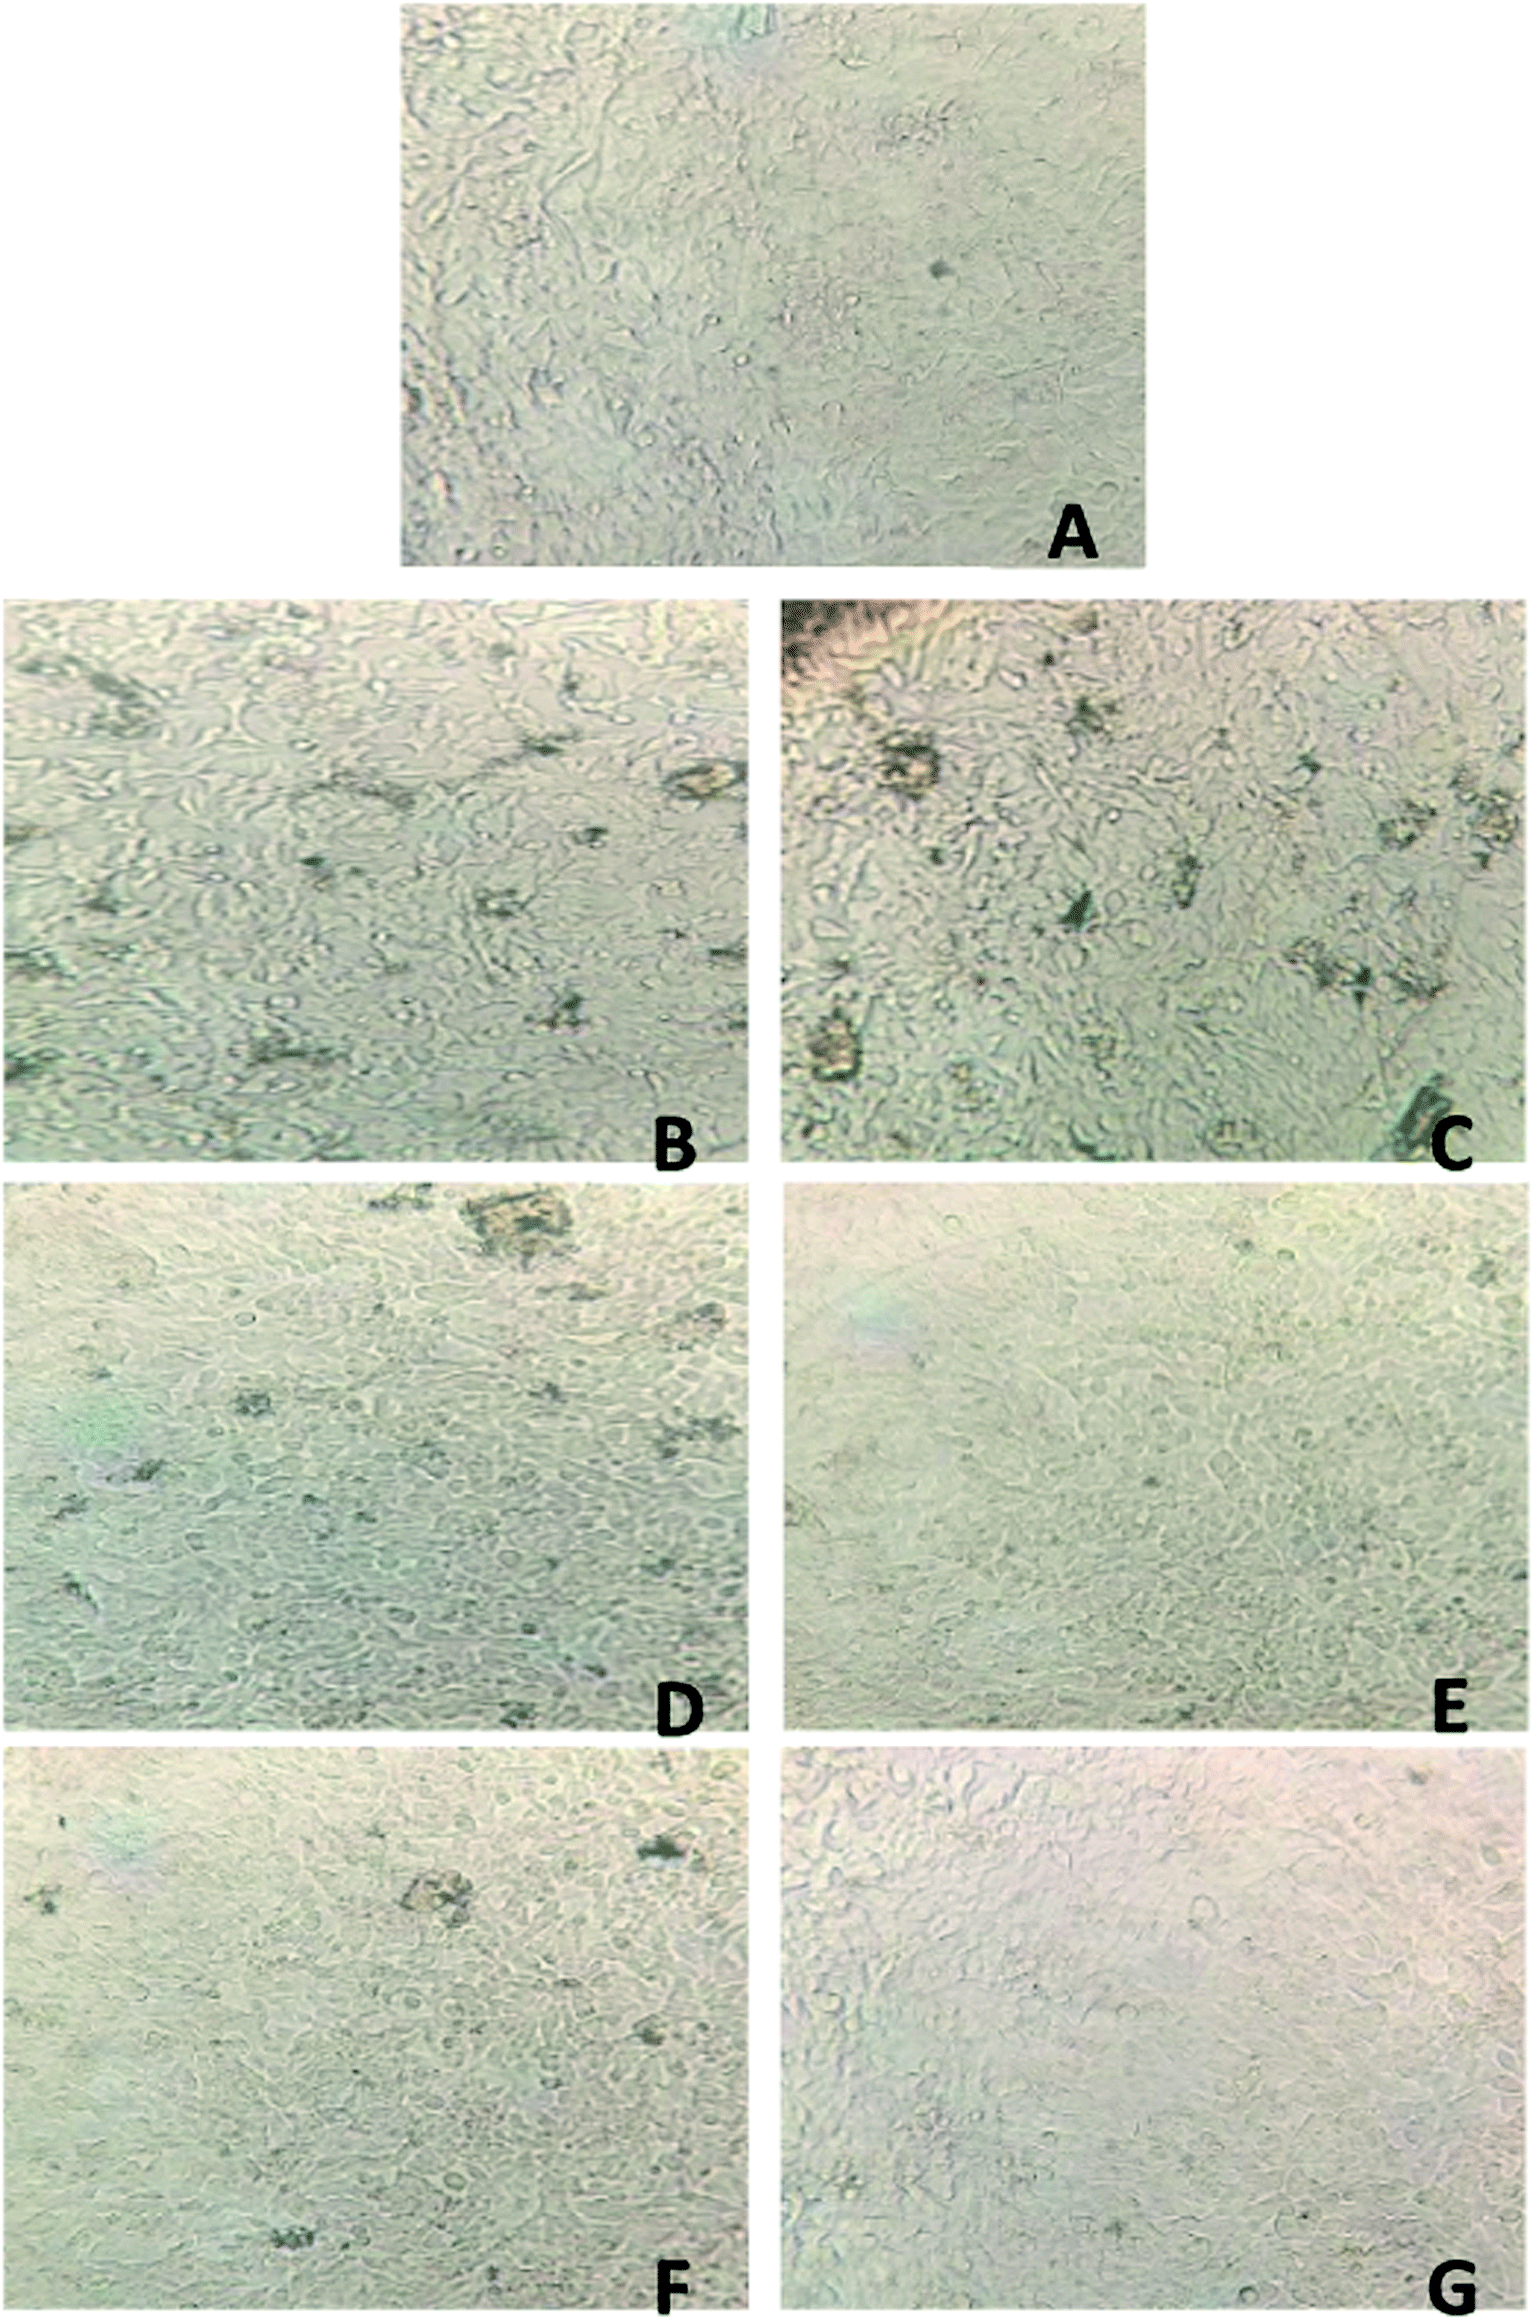 | ||
| Fig. 9 Images (A) control cells, (B) 400 μg, (C) 200 μg, (D) 100 μg, (E) 50 μg, (F) 25 μg, (G) 10 μg of the dopamine@CS/CD nanocomposite treated SH-SY5Y cell line. | ||
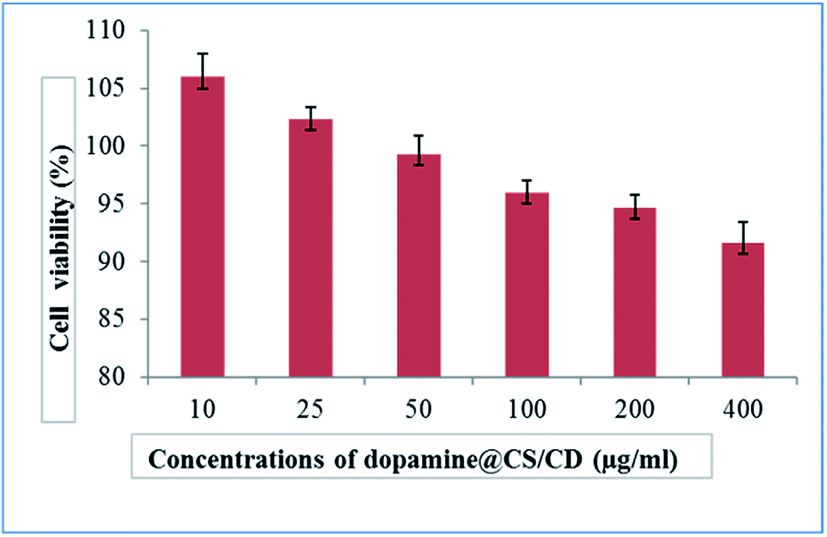 | ||
| Fig. 10 Plot of % viability vs. sample concentration for dopamine@CS/CD towards SH-SY5Y cell line. Values are expressed as mean ± S.D. of 3 independent experiments. | ||
Conclusion
An effective drug delivery vehicle derived completely from chitosan was synthesized and characterised. A facile carbonization technique was employed to synthesize carbon dots from chitosan. The particle size of the dopamine@CS/CD nanocomposite was calculated to be ∼144 nm which is ideal for cell membrane permeability. The zeta potential values of the drug loaded composite show their stability which in turn evidences the encapsulation of drugs into CS/CD thus making it a suitable drug carrier. The composite exhibited excellent biocompatible properties of IC-21 and SH-SY5Y cell lines through cell viability and hence proved to be an efficient drug delivery carrier. The in vitro drug release profile from the drug encapsulated nanocomposite showed zero order kinetics up to 12 h with initial burst release and Higuchi kinetics from 12 to 26 h with release controlled. The promising encapsulation efficiency (>80%), drug loading efficiency and the sustained release of dopamine ensures that more amount of the drug will be utilised effectively. The cytotoxicity tests ensure that the composite is non-toxic and hence, it is appropriate to be used in a biological system. The up-conversion fluorescence property of the carbon dots helps in bioimaging due to excitation and emission in the visible region i.e. when excited at 510 nm a high intensity emission was visible at 550 nm. Thus, carbon dots conjugated with chitosan matrix demonstrates itself as an ideal drug delivery nanocarrier for neurodegenerative diseases as it facilitates efficient drug transport, sustained release of drug and has avenues for bioimaging. The potentiality of the composite could further be extended for other diseases upon encapsulation of suitable drugs and is underway.Conflicts of interest
There are no conflicts to declare.Acknowledgements
The author, Sheril Ann Mathew, thanks DST-INSPIRE (IF170624) for the fellowship. The University of Madras Research Facility is acknowledged for UV-Vis, AFM, FESEM and TGA facilities.References
- D. F. Moyano and V. M. Rotello, Langmuir, 2011, 27, 10376–10385 CrossRef CAS
.
- K. E. Sapsford, W. R. Algar, L. Berti, K. B. Gemmill, B. J. Casey, E. Oh, M. H. Stewart and I. L. Medintz, Chem. Rev., 2013, 113, 1904–2074 CrossRef CAS PubMed
- P. R. Leroueil, S. Hong, A. Mecke, J. R. Baker, B. G. Orr and M. M. Banaszak Holl, Acc. Chem. Res., 2007, 40, 335–342 CrossRef CAS PubMed
- E. A. K. Nivethaa, S. Dhanavel, V. Narayanan and A. Stephen, Polym. Bull., 2016, 73, 3221–3236 CrossRef CAS
- A. Sachdev, I. Matai and P. Gopinath, J. Mater. Chem. B, 2015, 3, 1217–1229 RSC
- C. Bagni and A. C. Kreitzer, Curr. Opin. Neurobiol., 2018, 48, iv–vi CrossRef CAS PubMed
- S. K. Godin, J. Seo and L.-H. Tsai, in The Molecular and Cellular Basis of Neurodegenerative Diseases, ed. M. S. Wolfe, Academic Press, 2018, pp. 509–526, DOI:10.1016/B978-0-12-811304-2.00017-1
- J. E. Robinson and V. Gradinaru, Curr. Opin. Neurobiol., 2018, 48, 17–29 CrossRef CAS
- A. Chowdhury, S. Kunjiappan, T. Panneerselvam, B. Somasundaram and C. Bhattacharjee, Int. Nano Lett., 2017, 7, 91–122 CrossRef CAS
- M. L. Jessica, R. M. Douglas and E. B. Mark, Curr. Top. Med. Chem., 2014, 14, 1148–1160 CrossRef PubMed
- M. M. Patel and B. M. Patel, CNS Drugs, 2017, 31, 109–133 CrossRef CAS PubMed
- I. N. Mavridis, M. Meliou, E.-S. Pyrgelis and E. Agapiou, in Design of Nanostructures for Versatile Therapeutic Applications, ed. A. M. Grumezescu, William Andrew Publishing, 2018, pp. 1–29, DOI:10.1016/B978-0-12-813667-6.00001-2
- S. Georgia, A. Athanasios, A. Ghulam Md, S. Asad Ali, M. Gohar and A. K. Mohammad, Curr. Drug Metab., 2015, 16, 705–712 CrossRef
- A. C. Kaushik, S. Bharadwaj, S. Kumar and D.-Q. Wei, Sci. Rep., 2018, 8, 9169 CrossRef
- E. A. K. Nivethaa, S. Dhanavel, A. Rebekah, V. Narayanan and A. Stephen, Mater. Sci. Eng. C, 2016, 66, 244–250 CrossRef CAS
- A. Bernkop-Schnürch and S. Dünnhaupt, Eur. J. Pharm. Biopharm., 2012, 81, 463–469 CrossRef PubMed
- S. Dhanavel, S. A. Mathew and A. Stephen, in Functional Chitosan: Drug Delivery and Biomedical Applications, ed. S. Jana and S. Jana, Springer Singapore, Singapore, 2019, pp. 385–413, DOI:10.1007/978-981-15-0263-7_13
- M. Yadav, M. Parle, N. Sharma, S. Dhingra, N. Raina and D. K. Jindal, Drug Delivery, 2017, 24, 1429–1440 CrossRef CAS
- R. de Oliveira Pedro, F. M. Goycoolea, S. Pereira, C. C. Schmitt and M. G. Neumann, Int. J. Biol. Macromol., 2018, 106, 579–586 CrossRef PubMed
- T. M. Ways, W. Lau and V. Khutoryanskiy, Polymers, 2018, 10, 267 CrossRef
- S. Dhanavel, E. A. K. Nivethaa, V. Narayanan and A. Stephen, Mater. Sci. Eng. C, 2017, 75, 1399–1410 CrossRef CAS PubMed
- T. Sarkar, H. B. Bohidar and P. R. Solanki, Int. J. Biol. Macromol., 2018, 109, 687–697 CrossRef CAS PubMed
- D. Chowdhury, N. Gogoi and G. Majumdar, RSC Adv., 2012, 2, 12156–12159 RSC
- H. Wu, J. Wang, J. Xu, Y. Jiang, T. Zhang, D. Yang and F. Qiu, J. Iran. Chem. Soc., 2018, 15, 23–33 CrossRef CAS
- J. Guo, T. Mei, Y. Li, M. Hafezi, H. Lu, J. Li and G. Dong, J. Biomater. Sci., Polym. Ed., 2018, 29, 1549–1565 CrossRef CAS PubMed
- J.-B. Wu, M.-L. Lin, X. Cong, H.-N. Liu and P.-H. Tan, Chem. Soc. Rev., 2018, 47, 1822–1873 RSC
- H. Li, Z. Kang, Y. Liu and S.-T. Lee, J. Mater. Chem., 2012, 22, 24230–24253 RSC
- C. Ferrante, A. Virga, L. Benfatto, M. Martinati, D. De Fazio, U. Sassi, C. Fasolato, A. K. Ott, P. Postorino, D. Yoon, G. Cerullo, F. Mauri, A. C. Ferrari and T. Scopigno, Nat. Commun., 2018, 9, 308 CrossRef CAS
- T. Shimada, T. Sugai, C. Fantini, M. Souza, L. G. Cançado, A. Jorio, M. A. Pimenta, R. Saito, A. Grüneis, G. Dresselhaus, M. S. Dresselhaus, Y. Ohno, T. Mizutani and H. Shinohara, Carbon, 2005, 43, 1049–1054 CrossRef CAS
- S. Zhu, Y. Song, X. Zhao, J. Shao, J. Zhang and B. Yang, Nano Res., 2015, 8, 355–381 CrossRef CAS
- S. Li, L. Wang, C. C. Chusuei, V. M. Suarez, P. L. Blackwelder, M. Micic, J. Orbulescu and R. M. Leblanc, Chem. Mater., 2015, 27, 1764–1771 CrossRef CAS
- X. Sun and Y. Lei, TrAC, Trends Anal. Chem., 2017, 89, 163–180 CrossRef CAS
- X.-J. Mao, H.-Z. Zheng, Y.-J. Long, J. Du, J.-Y. Hao, L.-L. Wang and D.-B. Zhou, Spectrochim. Acta, Part A, 2010, 75, 553–557 CrossRef PubMed
- M. Zheng, S. Ruan, S. Liu, T. Sun, D. Qu, H. Zhao, Z. Xie, H. Gao, X. Jing and Z. Sun, ACS Nano, 2015, 9, 11455–11461 CrossRef CAS PubMed
- X. Liu, J. Pang, F. Xu and X. Zhang, Sci. Rep., 2016, 6, 31100 CrossRef CAS PubMed
- J. Chen, W. Liu, L.-H. Mao, Y.-J. Yin, C.-F. Wang and S. Chen, J. Mater. Sci., 2014, 49, 7391–7398 CrossRef CAS
- W. Zhang, J. Zheng, Z. Lin, L. Zhong, J. Shi, C. Wei, H. Zhang, A. Hao and S. Hu, Anal. Methods, 2015, 7, 6089–6094 RSC
- H. Wang, P. Sun, S. Cong, J. Wu, L. Gao, Y. Wang, X. Dai, Q. Yi and G. Zou, Nanoscale Res. Lett., 2016, 11, 27 CrossRef PubMed
- S. B. Aziz, O. Abdullah, D. Saber, M. Rasheed and H. M. Ahmed, Int. J. Electrochem. Sci., 2017, 12, 363–373 CrossRef CAS
- S. Gogoi, M. Kumar, B. B. Mandal and N. Karak, RSC Adv., 2016, 6, 26066–26076 RSC
- A. P. P. Praxedes, A. J. C. da Silva, R. C. da Silva, R. P. A. Lima, J. Tonholo, A. S. Ribeiro and I. N. de Oliveira, J. Colloid Interface Sci., 2012, 376, 255–261 CrossRef CAS
- M.-C. Lin, H.-Y. Tai, T.-C. Ou and T.-M. Don, Cellu, 2012, 19, 1689–1700 CrossRef CAS
- N. Puvvada, B. N. P. Kumar, S. Konar, H. Kalita, M. Mandal and A. P. Mahanty, Synthesis of biocompatible multicolor luminescent carbon dots for bioimaging applications, 2012 Search PubMed
- X.-F. Zheng, Q. Lian, H. Yang and X. Wang, Sci. Rep., 2016, 6, 21409 CrossRef CAS
- A. Ray Chowdhuri, S. Tripathy, C. Haldar, S. Roy and S. K. Sahu, J. Mater. Chem. B, 2015, 3, 9122–9131 RSC
- E. Barcia, L. Boeva, L. García-García, K. Slowing, A. Fernández-Carballido, Y. Casanova and S. Negro, Drug Delivery, 2017, 24, 1112–1123 CrossRef CAS PubMed
- E. A. K. Nivethaa, S. Dhanavel, V. Narayanan, C. A. Vasu and A. Stephen, RSC Adv., 2015, 5, 1024–1032 RSC
- E. A. K. Nivethaa, S. Baskar, C. A. Martin, R. J. Ramana, A. Stephen, V. Narayanan, B. S. Lakshmi, O. V. Frank-Kamenetskaya, S. Radhakrishnan and K. S. Narayana, Sci. Rep., 2020, 10, 3991 CrossRef CAS PubMed
- R. Pahuja, K. Seth, A. Shukla, R. K. Shukla, P. Bhatnagar, L. K. S. Chauhan, P. N. Saxena, J. Arun, B. P. Chaudhari, D. K. Patel, S. P. Singh, R. Shukla, V. K. Khanna, P. Kumar, R. K. Chaturvedi and K. C. Gupta, ACS Nano, 2015, 9, 4850–4871 CrossRef CAS
- N. K. Jain, A. C. Rana and S. K. Jain, Drug Dev. Ind. Pharm., 1998, 24, 671–675 CrossRef CAS PubMed
Footnote |
| † Electronic supplementary information (ESI) available. See DOI: 10.1039/d0ra04599c |
| This journal is © The Royal Society of Chemistry 2020 |