 Open Access Article
Influence of reduced graphene oxide on flow behaviour, glass transition temperature and secondary crystallinity of plasticized poly(vinyl chloride)
H. Akhinaa,
Koduvayur A. Ramya b,
M. R. Gopinathan Nairc,
Allisson Saiter-Fourcin
 d,
Marie-Rose Gardad,
Abhijit P. Deshpande
 b,
Nandakumar Kalarikkal
 a and
Sabu Thomas
 *ac
*ac
aInternational and Inter University Centre for Nanoscience and Nanotechnology, Mahatma Gandhi University, P.D.Hills (P.O), Kottayam, 686 560, Kerala, India. E-mail: sabuthomas@mgu.ac.in
bIndian Institute of Technology Madras, Chennai, 600036, Tamilnadu, India
cSchool of Chemical Sciences, Mahatma Gandhi University, Kottayam, India
dNormandie Univ, UNIROUEN Normandie, INSA Rouen, UMR CNRS 6634, Groupe de Physique des Matériaux, 76801 Saint Etienne du Rouvray, France
First published on 7th August 2020
Abstract
Understanding the rheological behaviour of thermoplastic nanocomposites is important to obtain a concrete knowledge of their processability. The viscoelastic properties of nanocomposites are a reflection of their morphology. The study of flow and deformation of nanocomposites provides essential information related to prevalent interactions in the system as well as contribution from the dispersion of incorporated nanofillers. In the present study, plasticized polyvinyl chloride/reduced graphene oxide nanocomposites (PPVC/RGO) were fabricated using melt mixing technique with different filler concentration. Flow behaviour of the nanocomposites was analyzed using small amplitude oscillatory shear (SAOS) measurements and it indicated an enhancement in the storage modulus (G′), loss modulus (G′′) and complex viscosity (η*) with RGO content. This can be attributed to very good dispersion and reinforcing effect of RGO in PPVC matrix as supported by TEM and FTIR results. Weak gel model is used to fit the rheological parameters and is found to be in excellent agreement with the SAOS experiments. Thermal history of the prepared nanocomposites was learned using differential scanning calorimetry. A shift in glass transition temperature (Tg) to higher temperature region could be seen, that manifest the effect of RGO in the amorphous portion of PPVC. An interesting property called secondary crystallinity was also found in these materials.
1. Introduction
Graphene based polymer nanocomposites have been extensively studied in the last decade. The effective dispersion of graphene based nanofillers within polymer matrices in combination with sufficient interfacial interactions between the fillers and the polymer can account for substantially enhanced reinforcement of the polymer matrices. A large number of reports can be seen in literature regarding the enhanced mechanical, electrical, thermal and gas barrier properties of graphene based polymer nanocomposites.1–8 Materials with desired properties can be prepared by suitably modifying the graphene based nanofillers.Reports on the rheological investigation of nanocomposites, though limited, have shown to provide interesting insights related to their structure. Literature on graphene based polymer nanocomposites reveals that small amplitude oscillatory shear (SAOS) tests have been widely used to evaluate the percolation threshold. Rheological parameters such as elastic modulus G′ and viscous modulus G′′ in frequency sweep experiments, help to understand the percolation through polymer–graphene–polymer bridging interactions that give rise to an elastic network. This can be identified by the appearance of a plateau in the low frequency region.9 One such investigation reported the shear thinning behaviour of poly(arylene ether nitrile)/graphene composites as compared to the Newtonian poly(arylene ether nitrile).10 Rheological behavior of polypropylene/graphene nanocomposites prepared by melt compounding were studied.11 They had observed a nearly Maxwellian behaviour for low graphene concentrations and a viscoelastic solid-like behaviour for graphene concentrations exceeding the percolation threshold. The effect of reduced graphene oxide (RGO) on melt rheological properties of poly(methyl methacrylate) (PMMA) were analyzed.12 They have found that moduli and viscosity of PMMA/RGO nanocomposites increased with increase in RGO loading, and a decrease in viscosity was observed with increasing frequency indicating a shear thinning behaviour.12 Recently, rheological properties of three different nanocomposites, consisting of graphene oxide (GO), RGO, and polyhedral oligomeric silsesquioxane grafted reduced graphene oxide (RGO-POSS) as nanofillers with poly dimethyl siloxane (PDMS) matrices, were investigated by large amplitude oscillatory shear (LAOS).13 They have noticed that different surface functionalization of nanoparticles resulted in different rheological behaviour due to the formation of different network-like structures. Phase transition and anomalous rheological behaviour of polylactide/graphene nanoplatelets (GNP) nanocomposites have been reported.14 GNP incorporation significantly enhanced the linear viscoelastic properties of PLA particularly its storage modulus, which showed weaker frequency dependency in the low frequency region with increasing GNP loading.
The interestingly high surface area of graphene has an impact on glass transition temperature (Tg) values of host polymer matrices and can make them more suitable for desired applications. Composite preparation methods such as solvent and melt mixing, which do not involve covalent bonding to the graphene surface, are generally incapable of providing enough restriction by interactions between the matrix polymers and fillers. However, the chains of polar polymers with low Tg can be confined by strong hydrogen bonding to graphene containing oxygen groups (RGO, thermally reduced graphene (TRG), etc.) leading to an increase in Tg.15 Tg of PMMA is found to increase up to 29 °C by the incorporation of 0.05 wt% TRG.16
In the present study, poly(vinyl chloride) (PVC) is chosen as the polymer matrix. Because of its widespread use as a fabricating material, considerable work has been done so far on determining the properties of both plasticized and unplasticized PVC.17–20 Plasticized PVC (PPVC), also called as “Flexible PVC”, can be prepared by adding required amount of plasticizers in the PVC. Structurally, PVC consists of primary and sub primary particles which are hard to plasticize into a homogeneous mixture, and hence PVC shows particulate flow characteristics. Partial crystallinity of the PPVC is considered as the primary cause for its relatively high elastic modulus compared to the other plasticized purely glassy polymers.21 Normally, plasticization of PVC leads to the lowering of Tg, and the degree and nature of lowering is controlled by the amount and the type of the plasticizer.
A few research studies have been reported in the literature on the rheological and thermal properties of PPVC/RGO nanocomposites, however to our knowledge; no work has been reported on the effect of RGO on the secondary crystallinity of PPVC. In the present study, PPVC/RGO nanocomposites were prepared using melt mixing method. A comprehensive study on the flow behaviour was carried out to understand the effect of RGO on the rheological behaviour of the PPVC nanocomposites. Morphology of the prepared nanocomposites was examined using TEM. Differential scanning calorimetry was used to explore the Tg and secondary crystallinity of PPVC/RGO nanocomposites. As the accurate determination of the Tg in the case of PPVC and its nanocomposites was difficult, physical aging procedure was carefully performed for determination of Tg. Finally, the morphology–property correlation has been established.
2. Experimental
2.1 Materials & methods
PVC (K value 67) was kindly provided by Reliance Industries Limited. The dioctyl phthalate (DOP) is used as the plasticizer and the heat stabilizers such as zinc stearate, [Zn(O2C18H35)2, 98%], and calcium stearate, [Ca(O2C18H35)2], were procured from Chem Lab. Graphite powder, KMnO4, NaNO3, H2SO4, and 30% H2O2 were procured from Merck. All materials were used as received.Firstly, GO was synthesized using a previously reported procedure.23 The obtained GO was dried and then reduced using thermal reduction method at a temperature of 200 °C for 2 hours to obtain RGO.24 PPVC/RGO nanocomposites were prepared by melt compounding technique using Haake mixer at 170 °C for 7 minutes at a rotor speed of 60 rpm. Different amount of filler (0.5, 1, 2 and 5 phr) was used for the preparation of nanocomposites. Then, 2 mm thick sheets were prepared using compression molding machine at 175 °C. Formulation for the PPVC–RGO composites and the sample code are given Table 1.
| PVC (phr) | Calcium stearate (phr) | Zinc stearate (phr) | DOP (phr) | RGO (phr) | Sample code |
|---|---|---|---|---|---|
| 100 | 6 | 5 | 40 | 0 | PPVC |
| 100 | 6 | 5 | 40 | 0.50 (0.495 wt%) | PPVCRGO.5 |
| 100 | 6 | 5 | 40 | 1 (0.990 wt%) | PPVCRGO1 |
| 100 | 6 | 5 | 40 | 2 (1.98 wt%) | PPVCRGO2 |
| 100 | 6 | 5 | 40 | 5 (4.95 wt%) | PPVCRGO5 |
2.2 Characterization techniques
Transmission electron microscopy (TEM) was performed with a JEOL 2100 facility to understand the morphology of prepared PPVC/RGO nanocomposites under an accelerating voltage of 200 kV. The rheological measurements were conducted in a stress controlled rheometer (Physica MCR301, Anton Paar) using a roughened parallel plate geometry (25 mm diameter) with a gap of 2.0 mm. The bottom plate comes with a Peltier system that does fast and precise temperature control. A glass solvent trap was used to avoid any drying of the sample due to solvent loss at higher temperatures.Dynamic strain sweep experiments were performed to determine the linear viscoelastic region at different temperatures (165–185 °C) in the strain amplitude range of 0.01–100% at a constant frequency of 1 Hz. Then, frequency sweep experiments were done from 50 down to 0.1 Hz at constant low strain amplitude within the linear viscoelastic region.
FT-IR spectra were recorded on PerkinElmer FT-IR spectrometer in attenuated total reflectance (ATR) mode between a frequency range of 4000 to 500 cm−1. Fifteen scans were done at a resolution of 4 cm−1.
DSC experiments were conducted on a thermal analysis instrument i.e. the heat flow calorimeter (DSC TA 2920 CE), coupled with a Refrigerated Cooling System (RCS). The apparatus was calibrated for temperature and enthalpy by using standard sample as indium. These experiments were conducted under inert nitrogen atmosphere with a flow of 50 mL min−1. First experiments have been performed on each sample in order to have a global view of the thermal signature and to erase the thermal history: the samples were cooled down to −45 °C and then heated up to 190 °C with a heating rate of 10 °C min−1. Then, the samples were cooled down and maintained at the aging temperature of −10 °C, for a duration of 15 hours. This corresponds to an aging procedure. At the end of the aging procedure, the samples were immediately cooled down to −45 °C. The samples were then heated from −45 °C up to 130 °C at a heating rate of 10 °C min−1. This first signal corresponds to the “aged” curves in the figures and will contain the signature of the aging procedure, i.e. an endothermic peak superimposed on to the heat flow step corresponding to the glass transition. A second heating ramp (corresponding to the “unaged” curves in the figures) is then performed from −45 °C up to 130 °C in order to check the thermal stability of the sample during the aging procedure. Indeed, the “aged” and “unaged” curves have to be superimposable before and after the glass transition region if nothing happened during the aging procedure. If not, one can consider that during this procedure chemical degradation and/or changing in microstructure have happened.
3. Results and discussion
3.1 Morphology
It is well known from earlier studies that homogeneous dispersion of graphene in polymer matrix plays a major role in the improvement of properties. Following are the TEM images (Fig. 1) of PPVC/RGO nanocomposites. They reveal an exfoliated morphology of the RGO nanosheets, which are very well dispersed in PPVC matrix without much aggregation. At low filler loading (0.5 phr) the number of RGO sheets is insufficient to form a continuous network and thin sheets of RGO are found to be scrolled into a tubular shape. Similar results have been reported for isolated thin carbon sheets.25,26 In the case of nanocomposite having 1 phr (Fig. 1(b), sample PPVCRGO1) one can see an inter connection of the nanosheets forming a continuous network along with some stacked portions. Higher filler loading leads to an increasing number of polymer filler interfaces (Fig. 1(c) and (d)) as well as a network of RGO throughout the PPVC matrix.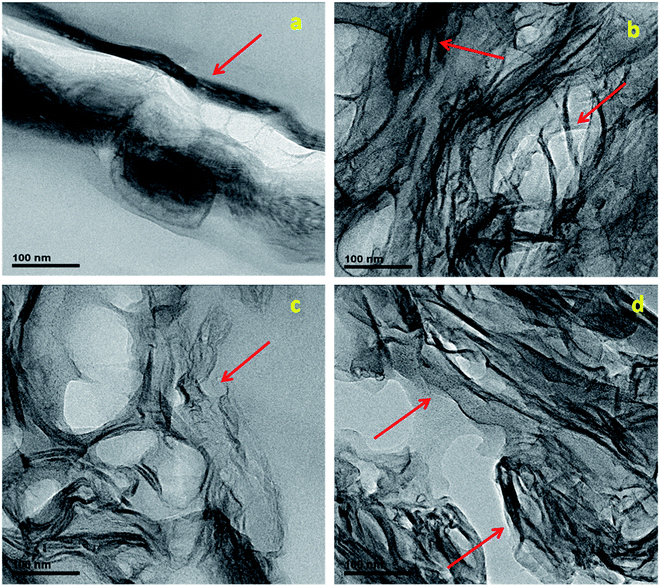 | ||
| Fig. 1 TEM images of PPVC/RGO nanocomposites: (a) PPVCRGO0.5, (b) PPVCRGO1, (c) PPVCRGO2 and (d) PPVCRGO5 (RGO sheets are denoted using arrows). | ||
3.2 Rheological behaviour
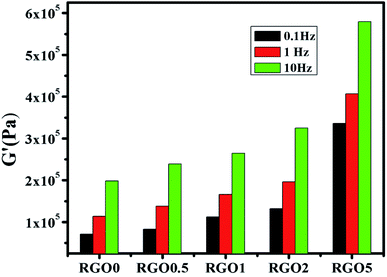
Rheology of nanocomposites is sensitive to the structure, particle size, shape and surface characteristics of the nano phase. Thus, rheology can be intensively used as a tool to assess the state of the dispersion in nanocomposites directly in the molten state. Understanding the rheological behaviour of nanocomposite melts helps to decipher information related to processability as well as microstructure. Hence to elucidate the network formation of RGO in PPVC, the nanocomposites were subjected to oscillatory shear in the linear viscoelastic region at 175 °C. Some set of experiments were repeated and the results were very much reproducible. First we have conducted strain sweep experiments in order to find the linear viscoelastic region.It is well known from literature that the storage modulus (G′) at low frequencies (or the elastic modulus at low shear rates) can provide maximum information on the quality of dispersion of graphene nanosheets in the polymer matrix.27 Therefore, frequency sweep measurements were carried out for evaluating the dispersion, interactions prevalent in the systems and the effect of RGO loading on the rheological response of PPVC. The effect of RGO on the viscoelastic properties of PPVC is explored in Fig. 2. Material functions of the nanocomposites such as the G′, loss modulus (G′′) and complex viscosity (|η*|) are plotted as a function of frequency at 175 °C. These can be called as the dynamic mechanical spectra of the PPVC/RGO nanocomposites as each showcases signatures of the microstructure of the corresponding composite. It is clearly understood from the rheological data that for all the nanocomposites as well as the neat sample, G′ is greater than G′′ in the measured frequency range. This is a clear evidence for the elastic behaviour of the PPVC matrix. Similar response has been reported earlier for plasticized PVC.28 Fig. 2(a) presents the variations of G′ of the PPVC and its nanocomposites with frequency. PPVC shows a clear terminal response in the low frequency regime. The G′ increases in the presence of RGO and the increase is monotonous with the increase in loading. This enhancement in G′ can be attributed to the reinforcing effect of RGO resulting in an effective dispersion of RGO in the polymer matrix due to interactions between PPVC and RGO. It is further supported by TEM images of the nanocomposites (Fig. 1) wherein an exfoliated morphology of the RGO sheets in the polymer matrix can be seen. Even though a slight increase in storage modulus is observed with RGO loading, a major improvement in storage modulus could be seen for the composite having 5 phr RGO. This can be due to the formation of 3D network of filler and hence it can be considered as the percolation threshold for this system.
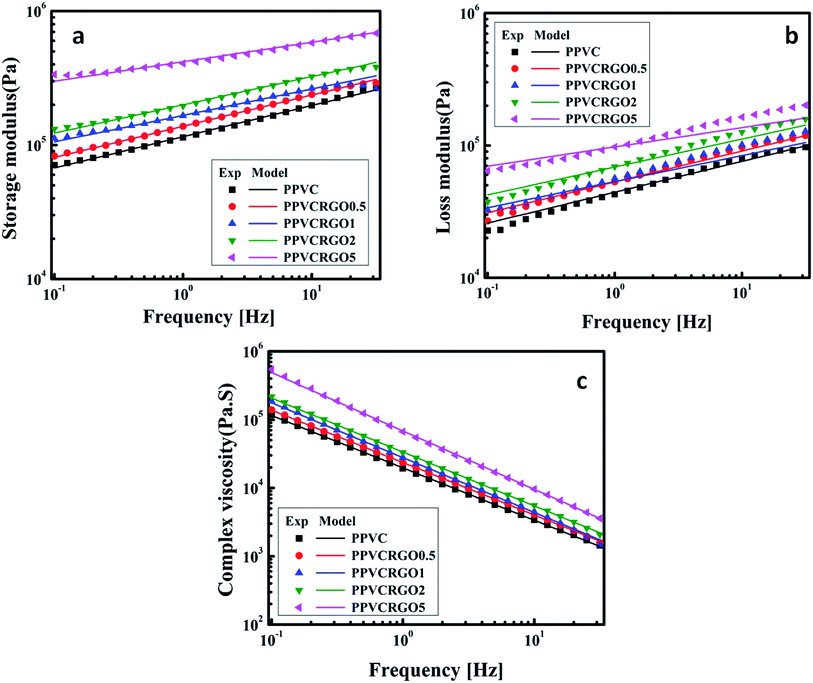 | ||
| Fig. 2 Rheological behaviour of nanocomposites: experimental and theoretical quantities of storage modulus (a), loss modulus (b) and complex modulus (c). | ||
At lower RGO concentrations, RGO sheets exist as individual units rather than forming interconnected networks. At medium concentrations, i.e. near the percolation threshold concentration, a polymer bridged RGO network is formed in the nanocomposites. It causes a decreased chain mobility of the polymer and as a result, the rheological properties begin to exhibit a pseudo solid-like behaviour. When the RGO concentration is high enough to follow a percolation path, 3D network is constructed in the nanocomposites. Within this network the motion of RGO sheets is hindered by the adjacent ones. The schematic showing the network evolution of RGO in PPVC matrix is shown in Fig. 3.
The variation of G′′ with frequency is shown in Fig. 2(b). It can be observed that G′′ of the filled systems shows same trend as that of G′ and its magnitude only slightly increased with increase in frequency or became less dependent on frequency range. The G′′ is higher for nanocomposites than the neat PPVC. The diminished dependence of G′ and G′′ of the nanocomposites at higher filler concentration is an indication of the solid network formation by RGO sheets.29 Corresponding complex flow curves are plotted in Fig. 2(c). The flow properties of PPVC and its nanocomposites with different filler loading are found to change with the increase in frequency. The value of complex viscosity increased with RGO concentration in the whole frequency range and exhibits a shear thinning behaviour. At higher frequencies (or shear rates) the chains become disentangled and will be oriented in the direction of shear. Thus, the resistance of chains moving past one another, i.e. the viscosity, decreases.30
As the PPVC and it nanocomposites based on RGO showed the gel like behaviour, weak gel model has been used to theoretically fit rheological parameters such as storage modulus, loss modulus and complex viscosity. The solid lines in the plots (Fig. 2(a)–(c)) represent the theoretical fitting using weak gel model. Based on weak gel model, the complex modulus is given by the following equation.31–33
 | (1) |
| RGO (phr) | Weak gel parameters | Temperature (°C) | ||||
|---|---|---|---|---|---|---|
| 165 | 170 | 175 | 180 | 185 | ||
| 0 | B | 212![[thin space (1/6-em)]](https://www.rsc.org/images/entities/char_2009.gif) 186.76 186.76 |
164![[thin space (1/6-em)]](https://www.rsc.org/images/entities/char_2009.gif) 061.58 061.58 |
123![[thin space (1/6-em)]](https://www.rsc.org/images/entities/char_2009.gif) 711.69 711.69 |
98![[thin space (1/6-em)]](https://www.rsc.org/images/entities/char_2009.gif) 990.29 990.29 |
71![[thin space (1/6-em)]](https://www.rsc.org/images/entities/char_2009.gif) 972.45 972.45 |
| n | 0.19 | 0.22 | 0.23 | 0.30 | 0.33 | |
| 0.5 | B | 245![[thin space (1/6-em)]](https://www.rsc.org/images/entities/char_2009.gif) 393.37 393.37 |
181![[thin space (1/6-em)]](https://www.rsc.org/images/entities/char_2009.gif) 286.35 286.35 |
148![[thin space (1/6-em)]](https://www.rsc.org/images/entities/char_2009.gif) 016.30 016.30 |
117![[thin space (1/6-em)]](https://www.rsc.org/images/entities/char_2009.gif) 410.86 410.86 |
116![[thin space (1/6-em)]](https://www.rsc.org/images/entities/char_2009.gif) 656.36 656.36 |
| n | 0.18 | 0.20 | 0.23 | 0.27 | 0.25 | |
| 1 | B | 295![[thin space (1/6-em)]](https://www.rsc.org/images/entities/char_2009.gif) 690.09 690.09 |
201![[thin space (1/6-em)]](https://www.rsc.org/images/entities/char_2009.gif) 152.36 152.36 |
174![[thin space (1/6-em)]](https://www.rsc.org/images/entities/char_2009.gif) 752.49 752.49 |
133![[thin space (1/6-em)]](https://www.rsc.org/images/entities/char_2009.gif) 655.14 655.14 |
1![[thin space (1/6-em)]](https://www.rsc.org/images/entities/char_2009.gif) 248 248![[thin space (1/6-em)]](https://www.rsc.org/images/entities/char_2009.gif) 866.22 866.22 |
| n | 0.17 | 0.19 | 0.19 | 0.26 | 0.22 | |
| 2 | B | 268![[thin space (1/6-em)]](https://www.rsc.org/images/entities/char_2009.gif) 890.13 890.13 |
132![[thin space (1/6-em)]](https://www.rsc.org/images/entities/char_2009.gif) 905.36 905.36 |
211![[thin space (1/6-em)]](https://www.rsc.org/images/entities/char_2009.gif) 300.80 300.80 |
174![[thin space (1/6-em)]](https://www.rsc.org/images/entities/char_2009.gif) 052.75 052.75 |
124![[thin space (1/6-em)]](https://www.rsc.org/images/entities/char_2009.gif) 282.50 282.50 |
| n | 0.19 | 0.22 | 0.21 | 0.21 | 0.29 | |
| 5 | B | 290![[thin space (1/6-em)]](https://www.rsc.org/images/entities/char_2009.gif) 160.61 160.61 |
391![[thin space (1/6-em)]](https://www.rsc.org/images/entities/char_2009.gif) 898.08 898.08 |
430![[thin space (1/6-em)]](https://www.rsc.org/images/entities/char_2009.gif) 140.34 140.34 |
243![[thin space (1/6-em)]](https://www.rsc.org/images/entities/char_2009.gif) 531.58 531.58 |
290![[thin space (1/6-em)]](https://www.rsc.org/images/entities/char_2009.gif) 160.61 160.61 |
| n | 0.19 | 0.19 | 0.14 | 0.25 | 0.19 | |
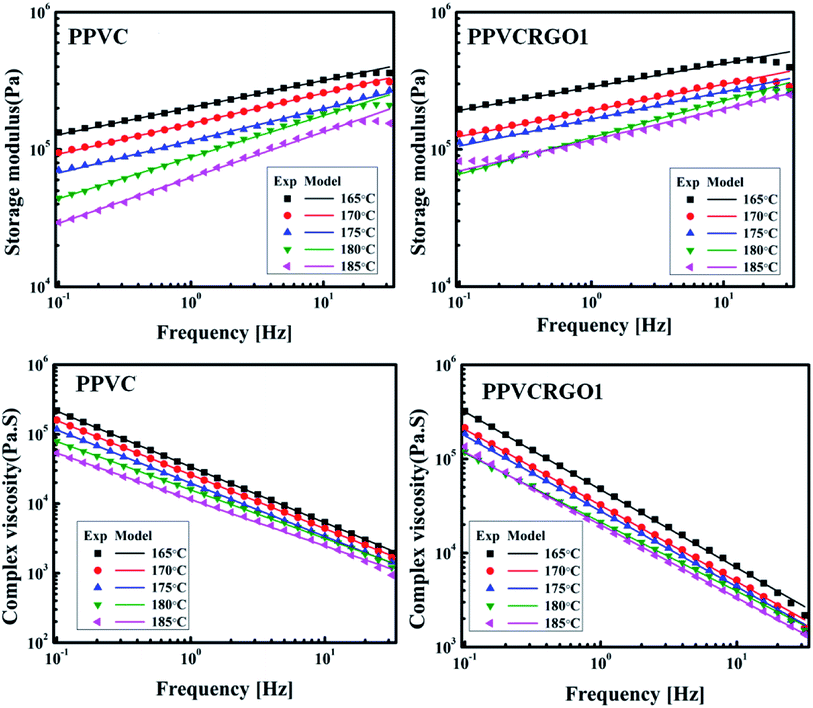
Fig. 5 shows the effects of temperature on the G′ and η* values of neat PPVC as well as PPVCRGO1. The G′ and η* decrease with increase in temperature as expected for polymeric systems that often exhibit rubbery states at higher temperatures. Decrease in G′ with increase in temperature is common for all nanocomposites and it may be attributed to the increase in mobility of polymer chains. The theoretical values of G′ and η* of all systems were calculated using the weak gel model (eqn (1)) and found to be in excellent agreement with the experimental values.
3.3 Molecular interactions as probed by FTIR
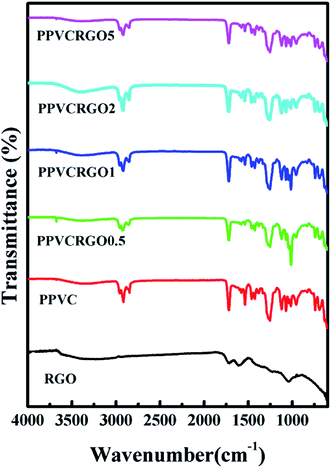
FTIR spectroscopy is an essential characterization technique used to analyze the structure of the materials at molecular scale. Fig. 6 shows the FTIR spectra of RGO, PPVC and its nanocomposites with different RGO loading. The oxygen functionalities in RGO were confirmed by a broad band at 3500 cm−1, which is attributed to O–H stretching of C–OH groups, peak at 1730 cm−1 due to the –C![[double bond, length as m-dash]](https://www.rsc.org/images/entities/char_e001.gif) O stretching vibrations and a peak at 1050 cm−1 due to C–O stretching vibrations.6,35 The spectrum of nanocomposites shows slight changes in intensities of some spectral lines which is the result of interactions between RGO and PPVC. The neat PPVC as well as the nanocomposites exhibit a dip at a wave number of 3000 cm−1 which corresponds to –C–H stretching in PVC.36 The peak around 1730 cm−1 in the case of RGO as well as PPVC nanocomposites can be ascribed to the strong –C
O stretching vibrations and a peak at 1050 cm−1 due to C–O stretching vibrations.6,35 The spectrum of nanocomposites shows slight changes in intensities of some spectral lines which is the result of interactions between RGO and PPVC. The neat PPVC as well as the nanocomposites exhibit a dip at a wave number of 3000 cm−1 which corresponds to –C–H stretching in PVC.36 The peak around 1730 cm−1 in the case of RGO as well as PPVC nanocomposites can be ascribed to the strong –C![[double bond, length as m-dash]](https://www.rsc.org/images/entities/char_e001.gif) O stretching vibrations. The overlapping of spectral lines of plasticizer dioctyl phthalate (DOP) and PVC made the FTIR interpretation difficult; even then one can see slight decrease in the intensity of the peak at 1601 cm−1 corresponding to the ring in plane vibrations of DOP which throws light on the interaction of RGO with PPVC.
O stretching vibrations. The overlapping of spectral lines of plasticizer dioctyl phthalate (DOP) and PVC made the FTIR interpretation difficult; even then one can see slight decrease in the intensity of the peak at 1601 cm−1 corresponding to the ring in plane vibrations of DOP which throws light on the interaction of RGO with PPVC.
3.4 Glass transition temperature
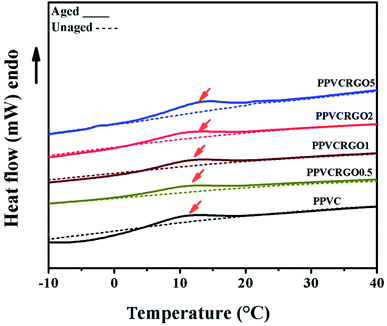
Differential scanning calorimetric measurements were used for the identification of the glass transition temperature (Tg). The segmental mobility of the polymer is greatly affected by the interactions of nanofillers which influence the Tg of the matrix. DSC thermograms of PPVC and its nanocomposites are shown in Fig. 7. The Tg of PPVC and its nanocomposites is expected to appear at low temperatures as shown by arrows but it is very difficult to be identified as well as distinguished due to the high amount of plasticizer content in all the systems. It has been reported in literature that increasing the amount of plasticizer causes broadening of the glass transition zone.37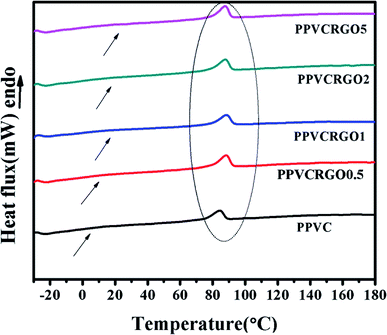 | ||
| Fig. 7 DSC thermograms of PPVC/RGO nanocomposites (arrows indicate expected glass transition range, and the peaks inside the ellipse show the melting of secondary crystallinity). | ||
In order to highlight the glass transition temperature region, we have adopted a protocol inducing physical aging in the amorphous phase as described in the experimental section. Indeed, the signature of physical aging in the amorphous phase corresponding to an endothermic peak superimposed onto the heat flow step in the glass transition range is observed as well described in the literature.38,39
According to the literature40 a Tg is expected around 10 °C, but as shown in Fig. 7 a single scan investigated by classical DSC is not sufficient to probe a Tg in this temperature range. The Tg range seems to be very wide, and the heat flow steps in this range are very low irrespective of the type of sample. Thus, we performed aging procedure to determine the glass transition temperature and the corresponding ΔCp. The heat flow curves obtained from DSC investigations are given in Fig. 8. Full lines and dotted lines correspond to the ‘aged’ and ‘unaged’ curves respectively. As can be seen for all the samples, an endothermic peak is superimposed onto the heat flow step around 10 °C, which is a clear signature of the glass transition range. Thus, it is possible to extract from the unaged spectra the Tg taken at the middle point, and the ΔCp at this temperature for each sample. The precise ΔCp values have been estimated by normalizing with the mass of PPVC (without filler). All the values are given in Table 3. For estimating the uncertainty on the measurement, each sample has been tested three times. The error bars given in Table 3 correspond to the greatest gaps.
| Samples | Tg mid (°C) | ΔCp(Tg mid) (J g−1 K−1) | Melting of secondary crystallinity (°C) |
|---|---|---|---|
| PPVC | 7 ± 1 | 0.10 ± 0.01 | 83 ± 1 |
| PPVCRGO0.5 | 5 ± 1 | 0.12 ± 0.01 | 87 ± 1 |
| PPVCRGO1 | 7 ± 1 | 0.13 ± 0.01 | 87 ± 1 |
| PPVCRGO2 | 12 ± 1 | 0.13 ± 0.01 | 88 ± 1 |
| PPVCRGO5 | 10 ± 1 | 0.12 ± 0.01 | 88 ± 1 |
According to the accuracy evaluated experimentally by experiment repetition, we can conclude that there is no evolution of the ΔCp values with the filler content. We obtain an average value of ΔCp = 0.11 ± 0.01 J g−1 K−1. This surprising behaviour has been already observed in other nanocomposites.41,42 But, in terms of Tg, we can conclude that this temperature slightly increases with the amount of filler, from Tg = 7 ± 1 °C up to Tg = 10 ± 1 °C. These results are consistent with literature.12 The amount of amorphous phase is constant irrespective of the filler content (i.e. ΔCp is constant), but the molecular relaxation is excessively constrained in this amorphous phase, inducing an increase of Tg. Furthermore, an increase in Tg variations can be correlated to an exfoliated system,41 this result being consistent to the morphologies observed by TEM (Fig. 1). Furthermore, a Tg increase highlight the decreasing in molecular mobility due to the high filler–matrix interactions.
3.5 Secondary crystallinity in PPVC/RGO nanocomposites
Apart from low temperature glass transition, we obtained melting peaks at high temperature (around 80 °C), indicated using an ellipse in Fig. 7. These melting peaks can be attributed to the secondary crystallinity of PPVC, which is developed during storage at room temperature.43 The melting of secondary crystallinity is given in the Table 3. It is well known that plasticization decreases the Tg of PVC by reducing the cohesive forces between polymer chains. The glass transition of PPVC is situated below room temperature. Therefore, storage at room temperature means the annealing of plasticized samples. The stiffening of products containing PPVC over the course of time is also the result of this acquired crystallinity.43 It has been reported in the literature that the crystalline micro domains PPVC melt at the processing temperature and reformed during the cooling of fused PPVC.22 A slight increase in melting temperature of secondary crystallinity could be noticed upon the addition of RGO. This indicates the restriction of motion of polymer chains due to the interaction between RGO and PPVC and also the reinforcing effect of RGO. Hence it can be realized that RGO has a positive role in delaying the stiffening of objects made of PPVC. Furthermore, we can observe through the amplitude of the melting peak, which the secondary crystallinity concerns the same quantity of matter whatever the filler amount is. Thus, the increase of the Tg is not due to the presence of secondary crystallinity, but due to an increase in the filler content, i.e. to an increase in filler/matrix interactions.4. Conclusions
Nanocomposites of PPVC with RGO were prepared using melt mixing technique. The FTIR spectra revealed changes in intensities of some spectral lines which is the result of interactions between RGO and PPVC. Morphology and melt rheological response indicated increased filler–polymer interactions leading to an effective dispersion. The rheological properties of the nanocomposites melt were influenced obviously by the incorporation of RGO. With increasing RGO content, moduli and complex viscosity were enhanced. Under the contribution of the RGO networks, the nanocomposites made a transition to solid-like behavior. The rheological parameters obtained using theoretical fitting are in agreement with the experimental values. DSC and physical aging protocol showed an increase of the glass transition temperature Tg with increase in RGO loading, proving a very good interaction between fillers and matrix and confirming exfoliated morphologies. Furthermore, DSC experiments highlighted the secondary crystallinity due to the storage at room temperature. RGO has a positive role in delaying the stiffening of objects made of PPVC. The work revealed that RGO enhances all the properties of PPVC making the resultant nanocomposites more effective and a better choice for desirable applications.Conflicts of interest
There are no conflicts to declare.Acknowledgements
The authors are grateful to CSIR New Delhi for financial support, student Fardoussa Abdourahman Omar, Normandie Univ, UNIROUEN Normandie, INSA Rouen, UMR CNRS 6634, Groupe de Physique des Matériaux, 76801 Saint Etienne du Rouvray and Pious. C. V, School of Chemical Sciences, Mahatma Gandhi University for their precious help and Dr Pramoda Kumari, IMRE for Microscopy.References
- Y. Cui, S. I. Kundalwal and S. Kumar, Carbon, 2016, 98, 313–333 CrossRef CAS.
- D. Wang, Y. Bao, J. Zha, J. Zhao, Z. Dang and G. Hu, ACS Appl. Mater. Interfaces, 2012, 4, 6273–6279 CrossRef CAS PubMed.
- H. Bin Zhang, W. G. Zheng, Q. Yan, Y. Yang, J. W. Wang, Z. H. Lu, G. Y. Ji and Z. Z. Yu, Polymer, 2010, 51, 1191–1196 CrossRef.
- J. Kim, Int. J. Nanomed., 2016, 11, 1927–1945 Search PubMed.
- S. R. Ahmad, R. J. Young and I. A. Kinloch, Int. J. Chem. Eng. Appl., 2015, 6, 1–5 CAS.
- T. S. Srinivasarao Yaragalla, C. Sarath Chandran, N. Kalarikkal, R. H. Y. Subban and C. H. Chan, Polym. Eng. Sci., 2015, 55, 2439–2447 CrossRef.
- M. Birenboim, R. Nadiv, A. Alatawna, M. Buzaglo, G. Schahar, J. Lee, G. Kim, A. Peled and O. Regev, Composites, Part B, 2019, 161, 68–76 CrossRef CAS.
- Y. M. Ma, Y. F. Zhuang, X. Y. Cao, J. N. Zhang, Y. Y. Ma, X. X. Shang, J. X. Lu, S. L. Yang and K. Zheng, Composites, Part A, 2019, 120, 49–55 CrossRef.
- P. Pötschke, M. Abdel-Goad, I. Alig, S. Dudkin and D. Lellinger, Polymer, 2004, 45, 8863–8870 CrossRef.
- X. Yang, Y. Zhan, R. Zhao and X. Liu, J. Appl. Polym. Sci., 2012, 124, 1723–1730 CrossRef CAS.
- N. M. Barkoula, B. Alcock, N. O. Cabrera and T. Peijs, Polym. Polym. Compos., 2008, 16, 101–113 CAS.
- S. N. Tripathi, R. S. Malik and V. Choudhary, Polym. Adv. Technol., 2015, 26, 1558–1566 CrossRef CAS.
- F. J. S. Lei Du and M. Namvari, Rheol. Acta, 2018, 57, 429–443 CrossRef.
- S. Kashi, R. K. Gupta, T. Baum, N. Kao and S. N. Bhattacharya, Composites, Part B, 2018, 135, 25–34 CrossRef CAS.
- K. Liao, S. Aoyama, A. A. Abdala and C. Macosko, Macromolecules, 2014, 47, 8311–8319 CrossRef CAS.
- T. Ramanathan, A. A. Abdala, S. Stankovich, D. A. Dikin, A. M. Herrera, R. D. Piner, D. H. Adamson, H. C. Schniepp, X. Chen, R. S. Ruoff, S. T. Nguyen, I. A. Aksay, R. K. Prudhomme and L. C. Brinson, Nat. Nanotechnol., 2008, 3, 327–331 CrossRef CAS PubMed.
- O. Faruk and L. M. Matuana, J. Vinyl Addit. Technol., 2008, 14, 60–64 CrossRef CAS.
- N. H. Abu-Zahra and A. M. Alian, Polym.-Plast. Technol. Eng., 2010, 49, 237–243 CrossRef CAS.
- H. E. Bair and P. C. Warren, J. Macromol. Sci., Part B: Phys., 1981, 20, 381–402 CrossRef.
- G. Teyssedre, H. Reinecke, T. Corrales, R. Navarro and P. Tiemblo, Macromolecules, 2005, 38, 10820–10828 CrossRef CAS.
- N. Hata and A. V Tobolsky, J. Appl. Polym. Sci., 1968, 12, 2597–2613 CrossRef CAS.
- C. Wilkes, C. Daniels and J. Summers, PVC Handbook, 2005, vol. 184 Search PubMed.
- K. S. Subrahmanyam, S. R. C. Vivekchand, a. Govindaraj and C. N. R. Rao, J. Mater. Chem., 2008, 18, 1517 RSC.
- H. Akhina, P. Mohammed Arif, M. R. Gopinathan Nair, K. Nandakumar and S. Thomas, Polym. Test., 2019, 73, 250–257 CrossRef CAS.
- L. H. Viculis, J. J. Mack and R. B. Kaner, Science, 2003, 299, 1361 CrossRef CAS PubMed.
- H. Kim, Y. Miura and C. W. Macosko, Chem. Mater., 2010, 22, 3441–3450 CrossRef CAS.
- C. M. Wu, S. S. Cheong and T. H. Chang, J. Polym. Res., 2016, 23, 1–9 CrossRef.
- S. G. Jiajia Zou, L. Su, F. You and G. Chen, J. Appl. Polym. Sci., 2011, 121, 1725–1733 CrossRef.
- C. Gao, S. Zhang, F. Wang, B. Wen, C. Han, Y. Ding and M. Yang, ACS Appl. Mater. Interfaces, 2014, 6, 12252–12260 CrossRef CAS PubMed.
- J. Bai, R. D. Goodridge, R. J. M. Hague, M. Song and M. Okamoto, Polym. Test., 2014, 36, 95–100 CrossRef CAS.
- D. Gabriele, B. De Cindio and P. D'Antona, Rheol. Acta, 2001, 40, 120–127 CrossRef CAS.
- K. A. Ramya, R. Srinivasan and A. P. Deshpande, Rheol. Acta, 2018, 181–195 CrossRef CAS.
- H. H. Winter and M. Mours, Neutron Spin Echo Spectrosc. Viscoelasticity Rheol., 1997, vol. 134, pp. 165–234 Search PubMed.
- M. E. De Rosa, A. Izuka and H. H. Winter, Polym. Gels Networks, 1994, 2, 239–245 CrossRef.
- M. G. Maya, S. C. George, T. Jose, L. Kailas and S. Thomas, Polym. Test., 2018, 65, 253–263 CrossRef.
- K. Deshmukh, S. M. Khatake and G. M. Joshi, J. Polym. Res., 2013, 20, 286 CrossRef.
- A. Stuart, M. M. Mccallum, D. Fan, D. J. Lecaptain, C. Y. Lee and D. K. Mohanty, Polym. Bull., 2010, 65, 589–598 CrossRef CAS.
- A. Saiter, M. Hess, N. A. D'Souza and J. M. Saiter, Polymer, 2002, 43, 7497–7504 CrossRef CAS.
- C. Lixon Buquet, F. Hamonic, A. Saiter, E. Dargent, D. Langevin and Q. T. Nguyen, Thermochim. Acta, 2010, 509, 18–23 CrossRef CAS.
- K. T. Varughese, J. Appl. Polym. Sci., 1990, 39, 205–223 CrossRef CAS.
- A. Saiter, N. Delpouve, E. Dargent, W. Oberhauser, L. Conzatti, F. Cicogna and E. Passaglia, Eur. Polym. J., 2016, 78, 274–289 CrossRef CAS.
- A. Saiter, H. Couderc and J. Grenet, J. Therm. Anal. Calorim., 2007, 88, 483–488 CrossRef CAS.
- J. A. Juijn, J. H. Gisolf and W. A. De Jong, Kolloid Z. Z. Polym., 1969, 235, 1157–1161 CrossRef CAS.
| This journal is © The Royal Society of Chemistry 2020 |


