 Open Access Article
Insight into the photophysics of strong dual emission (blue & green) producing graphene quantum dot clusters and their application towards selective and sensitive detection of trace level Fe3+ and Cr6+ ions†
Ganapathi Bharathia,
Devaraj Nataraj *ab,
Sellan Premkumara,
Padmanaban Saravananc,
Daniel T. Thangaduraid,
Oleg Yu Khyzhun
 e,
Kittusamy Senthilkumar
 bf,
Ramasamy Kathiresang,
Ponmalai Kolandaivelgi,
Mukul Gupta
 h and
Deodatta Phaseh
aQuantum Materials & Energy Devices (QM-ED) Laboratory, Department of Physics, Bharathiar University, Coimbatore, TN, India. E-mail: de.natraj2011@gmail.com
bUGC-CPEPA Centre for Advanced Studies in Physics for the Development of Solar Energy Materials and Devices, Department of Physics, Bharathiar University, Coimbatore, TN, India
cDefence Metallurgical Research Laboratory, Hyderabad 500 058, India
dDepartment of Nanoscience and Technology, Sri Ramakrishana Engineering College, Affiliated to Anna University, Coimbatore – 641 022, TN, India
eDepartment of Structural Chemistry of Solids, Frantsevych Institute for Problems of Materials Science, National Academy of Sciences of Ukraine, UA-03142 Kyiv, Ukraine
fDepartment of Physics, Bharathiar University, Coimbatore, TN, India
gMacromolecular Laboratory, Department of Physics, Bharathiar University, Coimbatore, TN, India
hUGC-DAE Consortium for Scientific Research, Indore, MP, India
iPeriyar University, Salem, TN, India
First published on 16th July 2020
Abstract
Graphene-nanostructured systems, such as graphene quantum dots (GQDs), are well known for their interesting light-emitting characteristics and are being applied to a variety of luminescence-based applications. The emission properties of GQDs are complex. Therefore, understanding the science of the photophysics of coupled quantum systems (like quantum clusters) is still challenging. In this regard, we have successfully prepared two different types of GQD clusters, and explored their photophysical properties in detail. By co-relating the structure and photophysics, it was possible to understand the emission behavior of the cluster in detail. This gave new insight into understanding the clustering effect on the emission behaviour. The results clearly indicated that although GQDs are well connected, the local discontinuity in the structure prohibits the dynamics of photoexcited charge carriers going from one domain to another. Therefore, an excitation-sensitive dual emission was possible. Emission yield values of about 18% each were recorded at the blue and green emission wavelengths at a particular excitation energy. This meant that the choice of emission color was decided by the excitation energy. Through systematic analysis, it was found that both intrinsic and extrinsic effects contributed to the blue emission, whereas only the intrinsic effect contributed to the green emission. These excitation-sensitive dual emissive GQD clusters were then used to sense Fe3+ and Cr6+ ions in the nanomolar range. While the Cr6+ ions were able to quench both blue and green emissions, the Fe3+ ions quenched blue emission only. The insensitivity of the Fe3+ ions in the quenching of the green emission was also understood through quantum chemical calculations.
Introduction
Photoluminescent graphene-based systems are phenomenal due to their low production cost and excellent biocompatibility.1–3 This is one of the areas, where the graphene-based luminescence systems outperform conventional inorganic luminescent materials. However, a fundamental understanding of the luminescence mechanism is quite important toward using them in a wide range of applications including optoelectronics, sensing and biological fields. There has been a wealth of research effort by scientists to understand the luminescence mechanism of the graphene systems. In general, pristine graphene sheets hardly exhibit any photoluminescence.1,2,4 However, nano-sized fragments of graphene, such as graphene quantum dots (GQDs) and graphene nanoribbons, exhibit good photoluminescence.5,6 Amongst these fragments, GQDs have gained much interest due to their simpler preparation methods and higher photoluminescence yield, which is comparable to those of inorganic luminescent semiconductors. However, unlike inorganic systems, the photoluminescence mechanism in GQDs is a complex one to understand. It was monotonically claimed that the reason for this complexity was that different emissions originated from surface states and a variety of functional molecules attached to the surface of GQDs. For example, according to Gan et al.,7 the surface states get activated when photons of the appropriate energy/wavelength hit the GQDs. Consequently, multiple emission bands result from this activation, depending upon the excitation energy. Sometimes, excitation energy-independent PL emission behavior has also been reported from the GQDs.8,9 Scientists have put forward different mechanisms for claiming the origin of the excitation-independent emission in GQDs. For example, Li et al.10 and Zhu et al.11 attribute the excitation energy-independent emission from the GQDs to the unified chromospheres. More specifically, it is the presence of a large amount of –NH2 groups at its edges that is responsible for the excitation-independent emission behavior. Permatasari et al.12 attributed the excitation-independent emission behavior to the optical transitions between the n and π* levels associated with the C![[double bond, length as m-dash]](https://www.rsc.org/images/entities/char_e001.gif) O and C
O and C![[double bond, length as m-dash]](https://www.rsc.org/images/entities/char_e001.gif) N bonds present in the GQDs. Pan et al.6 attributed the emission from GQDs to the carbine-like zigzag edge states. A few reports have shown that (for example, Yoon et al.13) the PL emission from the GQDs originated from the sp2 domains dispersed and confined in the sp3 matrices. Among the different types of emission origins, the one from the sp2 domains is intrinsic in nature. It has been reported that the sp2 domains with a size of 2–3 nm are responsible for the intrinsic blue emission from GQDs.13
N bonds present in the GQDs. Pan et al.6 attributed the emission from GQDs to the carbine-like zigzag edge states. A few reports have shown that (for example, Yoon et al.13) the PL emission from the GQDs originated from the sp2 domains dispersed and confined in the sp3 matrices. Among the different types of emission origins, the one from the sp2 domains is intrinsic in nature. It has been reported that the sp2 domains with a size of 2–3 nm are responsible for the intrinsic blue emission from GQDs.13
Because of this intrinsic emission property, this material can be utilized into an active optoelectronic material, similar to silicon and other bandgap-opened materials. However, its effective use as active optoelectronic material may be limited due to the surface and edge-attached functional molecules. For example, when GQD is coated as a thin layer and used as an active part in the solar cell, then the photogenerated electron–hole pairs from the quantum dots may find it harder to move from one dot to another due to the resistance to the charge transport by the surface-bound molecules. Therefore, the solution to this problem is to remove the surface-attached functional molecules. This can be done by interconnecting the individual GQDs into a larger-sized graphene sheet. In the interconnection process, the surface-to-volume (s/v) ratio of the graphene sheet can be largely decreased and consequently, the influence of the surface-attached functional molecules can be decreased. However, the interconnection process must be in such a way that the local structural discontinuity remains around the sp2-networked carbon domains of the graphene sheet to keep the molecular energy states of the sp2 domains undisturbed. This will give rise to the band gap-opened status to the graphene sheet. If the structural discontinuity is not formed during the interconnection process, then a larger-sized graphene sheet will result with metallic property due to the zero band of graphene.14,15 So, the growth of a graphene sheet with local structural discontinuity around each of the sp2 domains is a challenging task. To the best of our knowledge, few attempts have been made to bring in a structural discontinuity in the graphene sheet, so as to enable them into an active optoelectronic material. By either oxidizing the top surface of the graphene or introducing heavy metal atoms into the graphene network, it was possible to get a larger-sized graphene network with local quantum behavior.4,16 Gokus et al.16 has formed localized sp2 domains in the graphene sheet by simply oxidizing its surface via exposure to plasma. During plasma treatment, the Pz electron network was perturbed by oxygen atoms because of the formation of sp3 hybridization. When such sp3 bonds surround the domains of the sp2 carbon network, a local structural discontinuity can then result, which in turn, gives the emission property to the system. However, such emissive domains are only sensitive to the monolayer graphene. This is because the unexposed bottom layer will work as an emission quencher. In our previous work, we also demonstrated that it is possible to bring in GQDs close enough through the metal atom-assisted interconnection process and convert them into larger-sized (few micron sizes) solid sheets. Therefore, a strong intrinsic blue emission was possible from the graphene sheet through the energy transfer interaction.17
For the first time, we report herein a new type of graphene quantum dot (GQD)-coupled solid cluster system, which can give strong blue and green PL emissions. In this paper, we discuss the outcome of the results, characterized by various sophisticated techniques. This also includes the confirmation of the GQD solid formation and its dual emission characteristics. The science of sensing was also explained with suitable quantum chemical calculations.
Experimental section
The microwave-assisted synthesis method was used to prepare the GQD solid system. In all of the reactions, citric acid and urea were used as basic precursors. Microwave-assisted synthesis was conducted by taking citric acid and urea into a beaker, and dissolving them in double-distilled water. The citric acid concentration was kept at 0.5 g for all reactions, and the urea content was varied from 0.0 g to 1.0 g in increments of 0.125 g (M1: 0.0 g, M2: 0.125 g, M3: 0.25 g, M4: 0.375 g, M5: 0.5 g, M6: 0.675 g, M7: 0.75 g, M8: 0.875 g, M9: 1.0 g). A 0.7 mole zinc metal precursor was added to the M5 and M9 reactions to prepare the GQD interconnected wire-like structure, named as M5Z7 and M9Z7, respectively. The prepared samples were purified by the dialysis process, and then subjected to various characterizations.HRTEM analysis was carried out by coating the samples on a carbon-coated copper grid (200 mesh) using a JEOL JEM-2100 at an operating voltage of 200 kV. UV-vis absorption spectroscopy measurements were carried out using an Agilent CARY 60 spectrophotometer. PL excitation and emission measurements were carried out using a Horiba Jobin Yvon Fluoromax-4 spectrofluorimeter. Raman spectra were recorded using a Horiba LABRAM HR excited by a 514 nm laser. X-ray diffraction measurements were carried out with an Xpert PRO PANalytical instrument. The PL lifetime measurements were carried out using an IBH time-correlated single-photon counting (TCSPC) system, and the decay profile was deconvoluted using IBH data station software V2.6. XPS analysis of the samples marked as M2, M5, M5Z7, M9 and M9Z7 were made using the UHV-Analysis System (SPECS Surface Nano Analysis Company, Germany) equipped with a PHOIBOS 150 energy analyzer. During measurements of the XPS spectra, a base pressure of a sublimation ion-pumped chamber of the UHV-Analysis System was below 8 × 10⁻⁸ Pa. For the spectra excitation, Mg Kα irradiation (E = 1253.6 eV) was employed. The XPS spectra were measured at the pass energy of 35 eV. The spectrometer energy scale was calibrated by setting the Au 4f7/2 and Cu 2p3/2 binding energies of the reference metallic Au and Cu samples to 84.00 ± 0.05 and 932.66 ± 0.05 eV, respectively, with respect to the Fermi energy, EF. The soft X-ray absorption beamline (BL-1) of the Indus-2 synchrotron radiation source at Raja Ramanna Centre for Advance Technology, Indore, India was used for the X-ray absorption measurements. The XAS measurements were carried out in the total electron yield (TEY) mode, in an ultra-high vacuum (UHV) chamber with a base pressure of 5 × 10⁻¹⁰ mbar.
The quantum yield values were determined by comparing the emission of our samples with those from the quinine sulfate and fluorescein dye references using the following relation:18,19
Sensing experiments were conducted by dispersing the GQD nanostructured samples in double-distilled water. The analyte solutions were prepared by dissolving the metal salts in double distilled water. The PL emission spectra of the GQD nanostructured samples were recorded before and after adding analyte solutions. The GQD nanostructured sensing probe dispersions were freshly prepared for testing each analyte.
The Stern–Volmer equation19 given below was used to calculate the quenching efficiency.
| I0/I = 1 + Ksv |
where I0 and I are the PL emission intensities before and after addition of analyte, respectively, and Ksv represents the Stern–Volmer constant (Quenching constant). The detection limits for each analyte were calculated using the equation,3
Computational details
In the present work, spin-polarized density functional theory (DFT) calculations were performed using the projector-augmented wave (PAW)20,21 method as implemented in the Vienna Ab initio Simulation Package (VASP).22–24 The generalized gradient approximation (GGA) with the Perdew–Burke–Ernzerhof (PBE)25,26 functional was used to treat the electronic exchange and correlation interactions. In these calculations, due to the presence of 3d electrons in the Fe and Cr atoms, we used the DFT+U27 approach with U = 4.0 and J = 1.0 eV for the Fe atom28 and U = 4.5 and J = 1.0 eV (ref. 29) for the Cr atom. In this study, a 5 × 5 hexagonal graphene supercell consisting of 32 carbon atoms was used to construct GQD. The structure was optimized until the total energy difference was less than 10−5 eV and the force was less than 0.02 eV Å−1. In all calculations, we used a plane-wave basis set with a maximum energy cut off of 400 eV and 4 × 4 × 1 automatic mesh k-point grid for sampling the Brillouin zone. To improve the convergence, we used a Gaussian smearing of the Fermi surface with a smearing width of 0.2 eV. A vacuum region of 15 Å was used to avoid periodic image interactions between the atoms in the supercell. The interaction between GQD and the metal atom/ion was characterized by the interaction energy Eint, and was calculated using the following equation:| Eint = Etot − EGQD − Em |
Results and discussion
Growth of GQD clusters
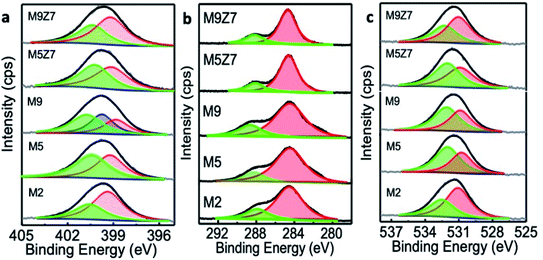
Graphene quantum dot (GQD) nanostructures were prepared by treating citric acid and urea in a microwave reactor. The citric acid concentration (0.5 g) was kept constant for all of the reactions, and the urea concentration was varied from 0.0 to 1.0 g in steps of 0.125 g. The samples were named after the different urea concentrations as follows: M1: 0.0 g, M2: 0.125 g, M3: 0.25 g, M4: 0.375 g, M5: 0.5 g, M6: 0.675 g, M7: 0.75 g, M8: 0.875 g, M9: 1.0 g. Two samples were prepared by adding 0.7 mole zinc metal precursor, along with the urea concentrations of 0.5 g and 1.0 g, and named as M5Z7 and M9Z7, respectively. The above sample names were followed consistently throughout the manuscript. The prepared graphene samples were first analyzed by HR-TEM in order to investigate the morphology. The sample prepared without adding urea (M1) did not show any formation of graphene. The HR-TEM images of the M2, M5 and M9 samples presented in Fig. 1 show the formation of spherical-shaped GQDs with increasing size from 5 nm to 20 nm, corresponding to the increasing urea concentration, i.e., the M2, M5, and M9 samples exhibited an average size of 5 nm, 10 nm, and 20 nm, respectively. The 20 nm particle consisted of smaller and larger-sized domains that reassembled into a “spherical shape” cluster-type nanostructure. Since we have not observed the formation of GQD in the absence of urea, we believe that nitrogen incorporation is a must for the formation of GQD by this method. Furthermore, it was observed that there is a correlation between the increasing trend in the urea/nitrogen content and size of the GQD. This supported the fact that nitrogen incorporation is a must in the growth of GQD by this method.It is well known that nitrogen can incorporate into the graphene network in three different sites named the graphitic, pyridinic and pyrrolic positions.8,10 To understand the nature of incorporation in the present samples, we have analyzed the as-prepared GQD samples by X-ray photoelectron spectroscopy. The obtained results showed that the incorporated nitrogen was initially at the pyridinic and graphitic positions. For example, the M2 sample had more nitrogen atoms incorporated in the pyridinic position, and this can be seen from a dominant deconvoluted peak at 399.1 eV, as shown in Fig. 2a.
When the urea concentration was increased (M5 sample), more nitrogen atoms got into the graphitic position. This is reflected in the rise of the deconvoluted N 1s peak at 400.7 eV.31–33 A further increase in the urea concentration (M9 sample) resulted in the incorporation of nitrogen in all three positions (pyridinic (398.8 eV), pyrrolic (399.8 eV) and graphitic (400.8 eV)). These XPS results were further supported by the Soft X-ray Absorption Spectroscopy (SXAS) results, which are discussed in the later part of the manuscript.
The increase of nitrogen in graphene with a corresponding increase of urea concentration in the reaction was also confirmed by the elemental composition obtained from XPS analysis (presented in ESI Table T1†). In addition, the formation of a graphitic carbon structure was confirmed by the high-resolution C 1s XPS spectra, presented in Fig. 2b, which contained peaks corresponding to C![[double bond, length as m-dash]](https://www.rsc.org/images/entities/char_e001.gif) C (284.6 eV) and C
C (284.6 eV) and C![[double bond, length as m-dash]](https://www.rsc.org/images/entities/char_e001.gif) O (288.1 eV).33,34 The O 1s spectra presented in Fig. 2c were deconvoluted into two peaks centered at 531.2 eV and 532.5 eV, corresponding to the C–O and C
O (288.1 eV).33,34 The O 1s spectra presented in Fig. 2c were deconvoluted into two peaks centered at 531.2 eV and 532.5 eV, corresponding to the C–O and C![[double bond, length as m-dash]](https://www.rsc.org/images/entities/char_e001.gif) O bonds.33
O bonds.33
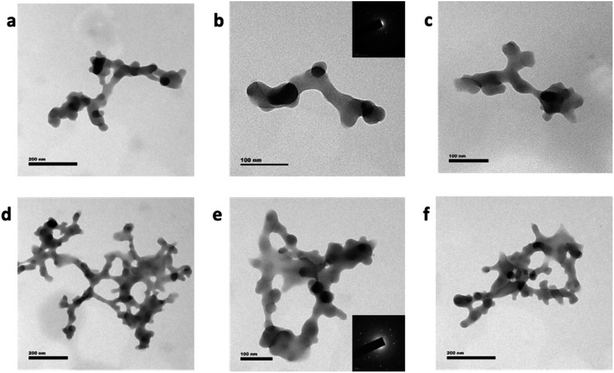
In short, it can be concluded that when the urea concentration is increased, nitrogen atoms start to incorporate into the graphene network, thereby helping the size of GQD to increase. When the metal precursor was introduced into the microwave reaction with citric acid and urea, then the GQD interconnected “wire-like cluster” type nanostructure was obtained (M5Z7 and M9Z7 samples), as shown in Fig. 3. The observed change in the morphology of the samples tells a fact that there is a correlation between the change in morphology associated with the metal concentrations. When the urea content alone increases, more nitrogen is incorporated into the graphene structure, with which the size of the GQD clusters increases spherically. However, once the metal precursor is added, the wire-like network-type clustered nanostructure is formed. That could be because of the different role performed by the metal atom. The following discussion explains the reason for the formation of the wire-like network type clusters. Because of its similar size, nitrogen can get into the graphene network in place of carbon, whereas metal atoms cannot do so because of its larger size. However, metal atoms can bind to the edge of GQD and connect other GQDs, thus helping to form a quantum dot-coupled cluster-type nanostructure. Previously, when we used a zinc metal atom in the hydrothermal reaction, larger sized single-crystalline-type solid sheets were obtained.17 The as-obtained solid sheet nanostructure was single-crystalline in nature as well, and also showed a strong intrinsic blue emission at 440 nm when excited through an energy transfer interaction. In the present case, the microwave-assisted synthesis method has resulted in a GQD-coupled wire-like network pattern with dual emission characteristics, which is a completely different photophysical property. We believe that the nature of the sample preparation is responsible for the change in the structure, morphology and optical properties.
Here, the as-formed GQD coupled-cluster type wire-like network is polycrystalline in nature, as evidenced by the selective area electron diffraction (SAED) pattern shown in the inset of Fig. 3b and e. Since the size of the GQD involved in the interconnection process was decided by the concentration of urea, we were able to control the nanostructure and thereby induce the desired photophysical properties. When the urea and metal precursor concentrations were 0.5 g and 0.7 mole, respectively, the interconnection process resulted in a wire-like network having a width of about 20 nm and length around 1 μm. When the urea concentration was increased further to 1.0 g by keeping the metal concentration at 0.7 mole, then the width of the GQD coupled wire network remained unchanged, but the network dimension increased with several branches, as shown in Fig. 3d–f. In the samples prepared without metal content, the increase of the urea content increased the lateral dimension of the GQDs (up to 20 nm). However, when the urea concentration was increased in the presence of the metal precursor, then the network length increased. This indicates the fact that due to the presence of interconnecting metal atoms, the increase of the urea concentration not only helped to increase the lateral dimension of GQDs, but supported the interconnection process between the dots (along with metal atoms), to form a wire-like network pattern with a greater number of arms. The observed results thus indicated the fact that nitrogen and zinc atoms are involved in the growth and formation process of the graphene dot coupled wire-like network. The incorporation of pyridinic and graphitic nitrogen within the GQD coupled wire-like network structure was demonstrated by the N 1s XPS spectra, which is presented in Fig. 2b. The C 1s and O 1s spectra are presented in Fig. 2, and the Zn 2p XPS spectra are given in the ESI Fig. S1.† The deconvolution of the C 1s spectra show the presence of C![[double bond, length as m-dash]](https://www.rsc.org/images/entities/char_e001.gif) C and C
C and C![[double bond, length as m-dash]](https://www.rsc.org/images/entities/char_e001.gif) O, and the O 1s spectra show the presence of C–O and C
O, and the O 1s spectra show the presence of C–O and C![[double bond, length as m-dash]](https://www.rsc.org/images/entities/char_e001.gif) O, as discussed in the case of GQDs. The Zn 2p deconvoluted spectra show two distinct peaks at 1022.1 eV and 1044.2 eV, corresponding to the Zn 2p3/2 and Zn 2p1/2 components, respectively, as evidence of the presence of Zn metal atoms in the GQD interconnected wire-like network samples.35
O, as discussed in the case of GQDs. The Zn 2p deconvoluted spectra show two distinct peaks at 1022.1 eV and 1044.2 eV, corresponding to the Zn 2p3/2 and Zn 2p1/2 components, respectively, as evidence of the presence of Zn metal atoms in the GQD interconnected wire-like network samples.35
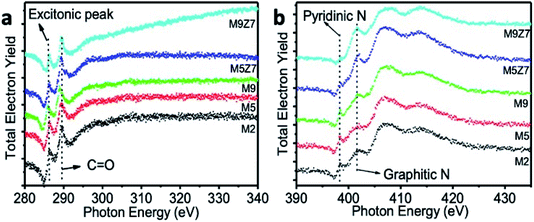
SXAS measurements were carried out in the total electron yield mode at the C K-edge, O K-edge, and N K-edges. Fig. 4a shows the X-ray absorption spectra measured at the C K-edge. A sharp X-ray absorption peak at 286.3 eV, observed for all samples, is an excitonic peak. This indicates the presence of a quantum confinement effect in all samples, including the wire-like clusters.36
The peak at 289.3 eV is attributed to the 1s–π* transitions of C![[double bond, length as m-dash]](https://www.rsc.org/images/entities/char_e001.gif) O. The broad absorption band beyond 293.8 eV corresponds to the superposition of the 1s–σ* transitions of C
O. The broad absorption band beyond 293.8 eV corresponds to the superposition of the 1s–σ* transitions of C![[double bond, length as m-dash]](https://www.rsc.org/images/entities/char_e001.gif) C, C–O–C, and C
C, C–O–C, and C![[double bond, length as m-dash]](https://www.rsc.org/images/entities/char_e001.gif) O. It has been noted that this broad absorption band, which arises from the 1s–σ* transitions, is enhanced upon GQD coupled wire-like cluster structure formation. This observed enhancement indicates the fact that there are more surface-attached functional molecules in the wire-like cluster-type nanostructure. The SXAS measurements at the N K-edge are shown in Fig. 4b. The X-ray absorption peaks at 398.3 eV and 401.1 eV originate from the 1s–π* transitions of the pyridinic and graphitic nitrogen atoms, respectively.37,38 The broad absorption peak beyond 407.0 eV is due to the superposition of the 1s–σ* transitions of the pyridinic and graphitic nitrogen atoms. The O K-edge SXAS spectra presented in the ESI Fig. S2† shows a peak at 534.3 eV, corresponding to the 1s–π* transition of C–O. In addition, the broad absorption peak beyond 542.0 eV is due to the superposition of the 1s–σ* transitions of C–O and C–O–C.39
O. It has been noted that this broad absorption band, which arises from the 1s–σ* transitions, is enhanced upon GQD coupled wire-like cluster structure formation. This observed enhancement indicates the fact that there are more surface-attached functional molecules in the wire-like cluster-type nanostructure. The SXAS measurements at the N K-edge are shown in Fig. 4b. The X-ray absorption peaks at 398.3 eV and 401.1 eV originate from the 1s–π* transitions of the pyridinic and graphitic nitrogen atoms, respectively.37,38 The broad absorption peak beyond 407.0 eV is due to the superposition of the 1s–σ* transitions of the pyridinic and graphitic nitrogen atoms. The O K-edge SXAS spectra presented in the ESI Fig. S2† shows a peak at 534.3 eV, corresponding to the 1s–π* transition of C–O. In addition, the broad absorption peak beyond 542.0 eV is due to the superposition of the 1s–σ* transitions of C–O and C–O–C.39
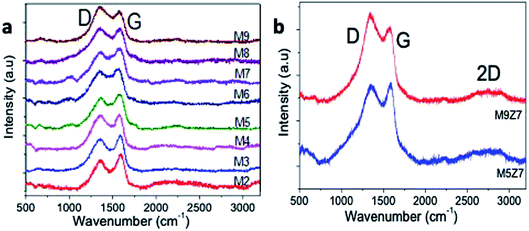
The formation of the graphene nanostructures was further investigated by Raman spectroscopy. Fig. 5 shows the Raman spectra of the microwave-synthesized GQD samples prepared with different urea concentrations. All samples presented two characteristic Raman bands at 1351 cm−1 and 1577 cm−1, corresponding to the A1g mode (D) and E2g mode (G) vibrations, respectively.40 In general, the A1g mode vibration originates from the sp3-hybridized and defect-structured carbon, and the E2g vibrational mode originates from the sp2 hybridized graphitic structure.
The Raman spectra of the blue-emitting GQD samples prepared with a low urea concentration have a G band dominating structure, and the green-emitting samples prepared with a high urea content exhibited a D band dominating structure. This rise of the D band with the increase of the urea concentration indicates that the addition of a high urea concentration to the reaction introduced an sp3 hybridized structure-containing oxygen species in an increasing trend. The Raman spectra of the wire-like cluster samples presented in Fig. 5b also indicate that a D band dominated structure due to the incorporation of a greater number of oxygen species into the structure.
Furthermore, it was noticed from the Raman spectra of the metal-doped sample that there was a rise in the 2D band, as evidenced by the presence of the few-layers of the graphene structure in the newly formed GQD interconnected wire-like network. The as-prepared nanostructures were further characterized with X-ray diffraction and Fourier transform infrared spectroscopy analysis, and the results are presented below in Fig. 6.
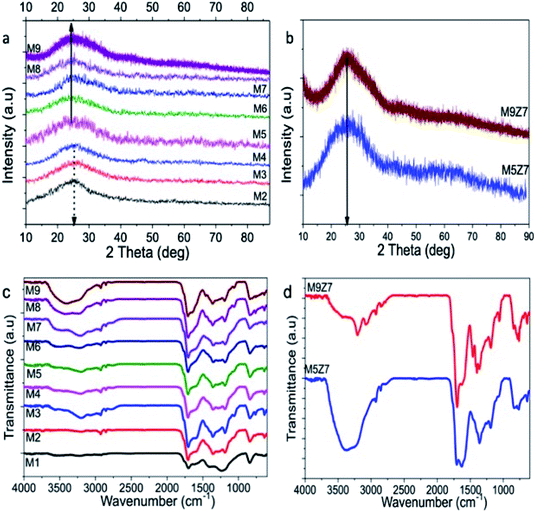
The X-ray diffraction pattern recorded from the microwave-synthesized GQDs and GQD coupled wire network are given in Fig. 6a and b. The peak observed at around 25 degrees indicates the formation of a hexagonal graphitic structure, which matches that of the JCPDS card no. 898487, corresponding to the graphitic carbon. The broadness of the X-ray diffraction peaks indicates the formation of nanosized crystalline carbon. The d-spacing values calculated from the diffraction pattern of the GQD sample increase from 0.35 nm to 0.382 nm with the increase of the urea concentration. This observed increase in the d-spacing values could be due to the introduction of oxygen-containing functional groups within the crystal planes.41 It should be noted that the diffraction pattern recorded from the GQD coupled wire network samples appears to be slightly shifted towards a higher diffraction angle, which resulted in the decrease in the d-spacing value to 0.36 nm. However, at the same time, the presence of the oxygen functional groups in these samples increased, as evidenced from the Raman and XAS studies as discussed before. Therefore, based on the XRD diffraction peak shift and the above said spectroscopy data, it was concluded that oxygen functionalization took place at the edge sites of the GQD coupled wire structure.
The microwave-synthesized GQD and GQD coupled wire network were also subjected to FTIR analysis, and the recorded FTIR spectra are shown in Fig. 6c and d. The broad peak covering the region from 3000 to 3700 cm−1 consists of two peaks at 3208 cm−1 and 3541 cm−1 corresponding to the N–H and O–H stretching vibrations, respectively.42 The small peaks at 2927 cm−1 and 2845 cm−1 can be attributed to the C–H stretching vibrations present in the aromatic rings. The presence of the carboxylic C![[double bond, length as m-dash]](https://www.rsc.org/images/entities/char_e001.gif) O stretching vibrations are identified from the peak at 1708 cm−1.43 A shoulder-like peak at 1605 cm−1 represents the stretching vibrations of the aromatic C
O stretching vibrations are identified from the peak at 1708 cm−1.43 A shoulder-like peak at 1605 cm−1 represents the stretching vibrations of the aromatic C![[double bond, length as m-dash]](https://www.rsc.org/images/entities/char_e001.gif) C bond, which constitutes the graphitic core of the as-prepared GQD samples. The stretching vibrations of the aromatic C–N bond were identified at 1354 cm−1, and the carboxylic C–O stretching peak was identified at 1187 cm−1.44 The out-of-plane bending vibrations of aromatic C–H were identified by the peak at 839 cm−1.42 The FTIR spectra of the metal-incorporated GQD solids also exhibited similar peaks, as in the case of the GQDs. In addition, there were two other peaks identified at 1631 cm−1 and 1459 cm−1, which could be attributed to the C
C bond, which constitutes the graphitic core of the as-prepared GQD samples. The stretching vibrations of the aromatic C–N bond were identified at 1354 cm−1, and the carboxylic C–O stretching peak was identified at 1187 cm−1.44 The out-of-plane bending vibrations of aromatic C–H were identified by the peak at 839 cm−1.42 The FTIR spectra of the metal-incorporated GQD solids also exhibited similar peaks, as in the case of the GQDs. In addition, there were two other peaks identified at 1631 cm−1 and 1459 cm−1, which could be attributed to the C![[double bond, length as m-dash]](https://www.rsc.org/images/entities/char_e001.gif) N and aromatic C–C bending vibrations, respectively.42 From the FTIR analysis, we can conclude that the graphitic quantum dot structure was formed with functional groups such as –COOH, –C
N and aromatic C–C bending vibrations, respectively.42 From the FTIR analysis, we can conclude that the graphitic quantum dot structure was formed with functional groups such as –COOH, –C![[double bond, length as m-dash]](https://www.rsc.org/images/entities/char_e001.gif) O and –NH2. Inclusion of the nitrogen species within the graphitic structure was also identified.
O and –NH2. Inclusion of the nitrogen species within the graphitic structure was also identified.
Optical properties
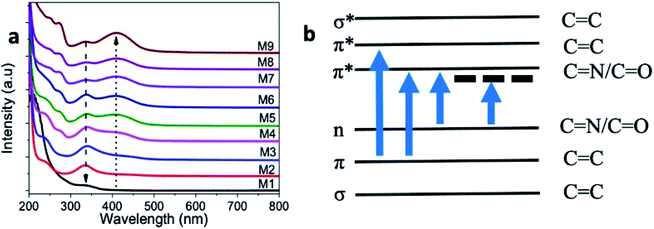
UV-visible absorption spectra of the microwave-synthesized samples (M2–M9) recorded in the range of 200–800 nm is given in Fig. 7a. For comparison, an absorption spectrum from the M1 sample prepared without urea content was also given, and exhibited a weak absorption band at 336 nm. The samples M2–M9 showed two absorption bands at 245 nm and 338 nm that correspond to the π–π* and n–π* transitions, originating from the C![[double bond, length as m-dash]](https://www.rsc.org/images/entities/char_e001.gif) C and C
C and C![[double bond, length as m-dash]](https://www.rsc.org/images/entities/char_e001.gif) N/C
N/C![[double bond, length as m-dash]](https://www.rsc.org/images/entities/char_e001.gif) O bonds present in the as-prepared samples, respectively.8,12,45 The π and π* energy levels originate from the bonding and non-bonding orbitals of the sp2 hybridized carbon, and the absorption at 245 nm corresponds to this transition. When nitrogen and oxygen atoms are present in GQD, the excess electrons in the nitrogen and oxygen atoms can contribute to the n-state. Consequently, the n–π* transition is possible at 338 nm. In addition, a new absorption band started appearing at 410 nm from the M3-coded sample and above. This new absorption band showed an increasing trend in the absorption value with the increase of the urea concentration. This absorption band at 410 nm is attributed to the sp2 domain of carbon.
O bonds present in the as-prepared samples, respectively.8,12,45 The π and π* energy levels originate from the bonding and non-bonding orbitals of the sp2 hybridized carbon, and the absorption at 245 nm corresponds to this transition. When nitrogen and oxygen atoms are present in GQD, the excess electrons in the nitrogen and oxygen atoms can contribute to the n-state. Consequently, the n–π* transition is possible at 338 nm. In addition, a new absorption band started appearing at 410 nm from the M3-coded sample and above. This new absorption band showed an increasing trend in the absorption value with the increase of the urea concentration. This absorption band at 410 nm is attributed to the sp2 domain of carbon.
Furthermore, we noticed an absorption band at 272 nm from GQD samples prepared with 0.375 g urea and higher concentrations (i.e., M4–M9 samples). This new absorption band indicates the optical transitions between π–π* of C![[double bond, length as m-dash]](https://www.rsc.org/images/entities/char_e001.gif) N/C
N/C![[double bond, length as m-dash]](https://www.rsc.org/images/entities/char_e001.gif) O, as represented in the schematic illustration (Fig. 7b). In general, these bands did not appear for the graphene nanostructures because of the dominant π–π* transitions of C
O, as represented in the schematic illustration (Fig. 7b). In general, these bands did not appear for the graphene nanostructures because of the dominant π–π* transitions of C![[double bond, length as m-dash]](https://www.rsc.org/images/entities/char_e001.gif) C.6,8 The incorporation of more nitrogen could be a reason for the appearance of these new bands in our samples.
C.6,8 The incorporation of more nitrogen could be a reason for the appearance of these new bands in our samples.
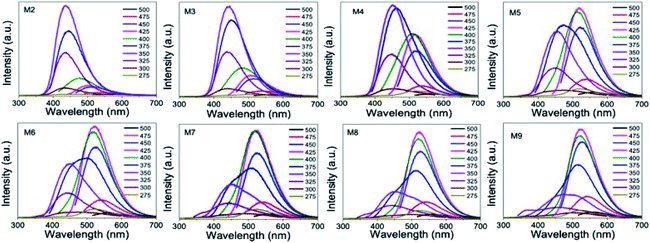
We recorded the PL emission spectrum from all of the samples. The M2 GQD sample showed a strong PL emission band at 440 nm with a PL quantum yield value of 18%, corresponding to an excitation of 350 nm. When we changed the excitation wavelength from 275 to 375 nm, the PL emission intensity increased. It reached the maximum value for an excitation of 350 nm, and then decreased without showing much shift in the emission band position (Fig. 8). However, when the excitation wavelength was changed beyond 400 nm, a weak red-shifted emission band appeared at 475 nm and beyond. Similar PL results from other GQD samples prepared with a higher concentration of urea resulted in a different trend in the PL emission. This could be due to the change in the dimension of the sample. For example, the PL emission of the M3 sample showed a PL quantum yield value of 16% at 440 nm when excited at 350 nm. Furthermore, the excitation wavelength-dependent study up to 375 nm showed a slightly quenched emission at 440 nm from this sample (Fig. 8). When the excitation wavelength was at 425 nm, we noticed an enhanced emission at 520 nm. This behavior was completely different from the PL observation from the M2 sample. By further increasing the excitation wavelength from 425 to 475 nm, we noticed a quenching in the PL emission yield at 520 nm. A similar measurement from sample M5 showed a strong PL emission at 520 nm, when excited at 425 nm, which is stronger than the emission at 440 nm (under 350 nm excitation), as shown in Fig. 8.
When this M2 QD system was excited at 350 nm, a strong emission at 440 nm resulted due to the radiative recombination through the molecular energy levels of the functional molecules. This recombination is clear from the emission band position, which is Stokes-shifted by 90 nm.1,8 Apart from the contribution of these surface molecule to the blue emission, 2–3 nm-sized sp2 domains in the GQDs can also contribute a weak emission at 440 nm, which is the intrinsic emission of GQD.13 However, it is hard to distinguish this intrinsic emission component because the surface-attached carboxylic acid functional molecules dominate the emission at this wavelength. If one wanted to see an intrinsic blue emission apart from GQD, then it is necessary to reduce the contribution of the surface-attached functional molecules to the blue emission band. This is possible to achieve by increasing the size of GQD, so that the surface-to-volume (s/v) ratio of GQD can be decreased. Thus, the contribution of the surface-attached functional molecules to the blue emission band can be decreased as well.
In the present work, during the initial synthesis, we increased the nitrogen concentration by increasing the urea, and did not add any metal during the microwave synthesis of GQD. However, we also noticed an increase in the size of GQD upon increasing the nitrogen doping. This means that there is a correlation between the increase in the nitrogen doping concentration and the size of the GQD. As a consequence, there is a decrease in the s/v ratio of the QD system. This reflects a decrease in the contribution of the edge-attached functional molecule to the absorption band at 350 nm. At the same time, an absorption band due to the sp2 domains started to appear at 410 nm, which is similar to the previously reported GQD solid sheet system.17 Although the average size of GQD increased upon nitrogen doping, the domain size seemed to not change. Consequently, the absorption band at 410 nm did not shift with nitrogen doping. Furthermore, it was found that the absorption band at 410 nm increasingly strengthened with a gradual decrease in the absorption at 350 nm and the increase of the GQD size (Fig. 7a). This observation shows that the contribution of the surface-attached functional molecules to both absorption and emission bands decreased. On the other hand, the sp2 domain contribution increased.
When the urea concentration increased from 0.625 to 1.0 g (M6 to M9), we noticed a strong rise in the emission band at 520 nm. At the same time, a drastic decrease in the blue emission was also noticed. Furthermore, this green emission band position was also excitation-wavelength independent in nature. This could be understood from the absence of much shift in the emission peak position when the excitation wavelength was changed. The reason for the appearance of the green emission band could be due to the change in the local structure and size of GQD. We believe that the green emission is from the sp2 domains having a high nitrogen content.
A normally, intrinsic blue emission close to the excitation energy is expected. Since we used the excitation energy of 410 nm, a less Stokes-shifted blue emission at 440 nm was expected. However, due to the heavy nitrogen doping, the photoexcited electrons underwent delocalization through the nitrogen rich graphene domains, thus shifting the emission maximum to the green side. Since all of the samples showed a blue emission band as well when excited at 350 nm, it is believed that nitrogen incorporation was done in a non-uniform way in the sample.
By looking at ESI Fig. S3,† one can understand the correlation between the structure and PL emission distribution. Fig. S3† shows the distribution of the excitation and emission intensity maxima as a function of the urea concentration used. While the excitation peak intensity at 350 nm decreases with increasing urea or increasing GQD size, the PL intensity at 440 nm decreased proportionately.
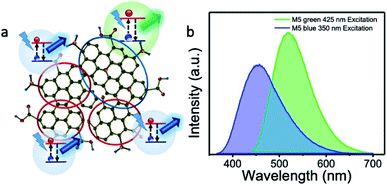
At the same time, the excitation peak maximum at 410 nm increased with increasing urea concentration. It matches with the increase in the PL emission at 520 nm. At a given urea concentration, the excitation intensities at 350 and 410 nm and the corresponding PL emission intensities at 440 nm and 520 nm, respectively, were similar in magnitude. Therefore, from this observation, we conclude that it is possible to tune the emission wavelength to either blue-rich or green-rich or blue-green rich by this method of preparation. Fig. 9 schematically represents the origin of the blue emission from less nitrogen-containing sp2 domains and green emission from high nitrogen-containing sp2 domains.
Furthermore, we took pH-dependent PL emission measurements, and found that the blue emission band was sensitive to the change in pH value (M5). Almost 80% of the blue emission was quenched at a pH value of 1 (ESI Fig. S4†) due to the protonation of the edge states/functional molecules.6,13,46,47 Therefore, the remaining unperturbed blue emission should be from the sp2 domains of graphene, as reported elsewhere. At the same time, the green emission band was not affected by the change in the pH value, which indicates that the green emission did not originate from the edge states and/or functional groups.
The optical absorption and PL emission properties of the as-prepared GQD coupled cluster-type solid wire network sample were also investigated in detail. The optical absorption spectra (Fig. 9) recorded from the as-prepared GQD coupled network samples showed a sharp absorption band at 336 nm, as shown in Fig. 10, corresponding to the n–π* transition. When we compared this absorption band at 336 nm of the GQD cluster-type wire-like network sample to that of the spherical-shaped GQDs prepared without a metal precursor, we noticed a strong absorption in the metal-containing GQD cluster sample. The excitation wavelength-dependent emission spectra (Fig. 10b and c) of the samples M5Z7 and M9Z7 showed a strong blue emission when compared to their metal-free counterparts. This observed enhancement in the blue emission of the GQD cluster samples, along with the increase in the absorption band at 336 nm, indicated that there is a strong correlation between the structure and optical property again. Unlike the metal-free sample, which is spherical in nature, the sample here appears as a dot-coupled wire-like clustered network having a zig-zag dimension. Therefore, there will be more edge sites with a greater number of functional molecules attached at these sites, which will then give rise to a strong absorption band at 336 nm and emission band at 440 nm. At the same time, the sp2 domains with less nitrogen content will also try to give emission at 440 nm, but with lesser magnitude. Weak blue emission due to domains was made visible in this sample by bringing down the emission contribution from the functional molecules. This was achieved by changing the pH conditions, as done previously. The absorption spectra of the cluster-type nanostructure also showed a weak band at 410 nm. When the sample was excited at this wavelength, we observed a strong green emission at 520 nm. The photoexcited charge carrier delocalization in the nitrogen-rich graphene domain is the reason for this green emission at 520 nm. The excitation energy-dependent measurements from samples prepared with two different urea concentrations (M5Z7 and M9Z7), but with a fixed optimized metal precursor concentration of 0.7 mole, resulted in two different excitation-independent strong emission regions at the 440 nm and 520 nm band positions. When comparing the relative emission intensity, the M9Z7 sample is green rich and the M5Z7 sample is blue-rich.
The present optical absorption and PL emission measurements thus indicate that one can switch the emission from blue to green by choosing the optimal excitation wavelength. In other words, it can be said that it is possible to shuttle the emission maximum between blue and green effectively by choosing the right excitation wavelength. An interesting point is that these coupled cluster-type nanostructures contain sp2 domains with two different nitrogen concentrations and sizes connected by metal atoms, but still have independent emission characteristics. This is because the charge carriers undergoing the radiative recombination responsible for blue emission are not able to delocalize throughout the nitrogen-rich graphene domains. We calculated the PL emission yield value corresponding to the blue and green emissions of the samples, and the results are presented in the ESI Table T2.† One more interesting observation is that these cluster-type nanostructures did not undergo energy transfer-assisted interaction with GQDs, as we noticed before in the GQD coupled single crystalline solid sheet samples. Because the PL emission from GQD was at 440 nm, which overlaps with the absorption at 410 nm of the cluster sample, either an enhanced blue or green emission was expected. However, we have not observed any enhancement in the PL emission yield upon the addition of GQD. This result therefore clearly shows that a mere spectral overlapping alone is not sufficient to observe the energy transfer interaction, but the dimension of the interacting systems is also important. However, further study is required to understand the absence of the energy transfer interaction between GQDs and GQD coupled clusters.
The chemically prepared graphene nanostructures have structural arrangements in such a way that they can easily detect Fe3+ and Cr6+ ions without any additives or post-synthesis treatments. There are several reports on sensing Fe3+, among which the blue emitting graphene/carbon quantum dot nanostructures have been used.48–50,58,59 Similarly, the Cr6+ ion analyte was also detected using graphene/carbon quantum dots.51,57,60–62 However, the sensing of both ions using a single graphene nanostructure probe has not been reported yet. There have been a few other reports on detecting more than one metal ion analyte, but they use a single emission, which could lead to the interference in sensing.3,48,63,64
In the present work, we were able to selectively detect Fe3+ and Cr6+ ions using our dual blue-green emitting graphene nanostructured samples, and the selectivity between the Fe3+ and Cr6+ ions can be achieved by choosing the emission (either blue alone or blue-green). The PL emission quenching occurs immediately after adding the analytes, and the change in the intensity of color can be used to detect the Fe3+ and Cr6+ analytes by naked eye. Our GQD cluster-type nanostructures synthesized by the microwave-assisted chemical method have dual blue-green emitting behavior. By choosing the emission wavelength for quenching, we were able to address the selectivity problem between the Fe3+ and Cr6+ ions. While the blue emission was quenched by the Fe3+ and Cr6+ ions, the green emission remains blind to the Fe3+ ions. At the same time, the green emission was quenched by the Cr6+ ions.
Therefore, it was possible to develop a sensing probe, which can selectively detect Fe3+ or Cr6+ ions. The metal ion sensing properties of the GQD coupled cluster-type wire-like nanostructure was investigated by subjecting the as-prepared samples to PL quenching-based sensing experiments. Different metal ions such as Cd2+, Zn2+, Mn2+, Cu2+, Fe3+, Fe2+, Mg2+, Pb2+, Cr6+, Ni2+, and Hg2+ ions were used as sensing analytes against the as-prepared graphene nanostructures.
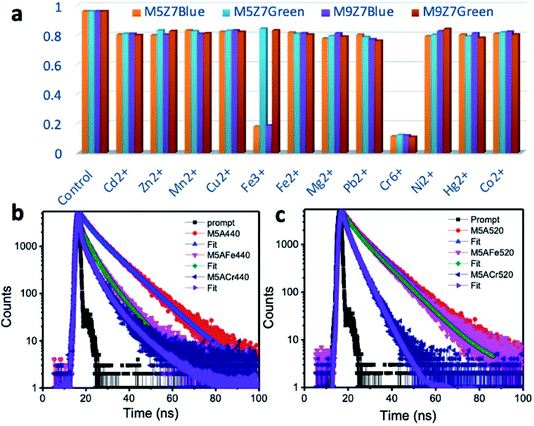
The bar diagram presented in Fig. 11 displays the selectivity of the as-prepared samples towards Fe3+ and Cr6+, amongst the tested analytes. The blue emission was quenched upon the addition of Fe3+ ions due to the interaction of these ions with the surface-attached functional molecules. These molecules are responsible for the blue emission. When the photoexcited charges were transferred to the ions, PL quenching occurs. In this quenching experiment, the complete quenching of blue emission was not seen. Therefore, the unquenched blue emission could be from the sp2 domains. The Fe3+ ions interacting with the graphene domain could not quench the intrinsic blue and green emissions. This could be because of its weaker interaction with the sp2 domain(s). The blue/green emissions were quenched upon the addition of the Cr6+ ions. This could be due to the transfer of photoexcited charges from both blue/green emitting sp2 domains and blue-emitting functional molecules to the Cr6+ metal ions. Inner filter effect (IFE) is also possible for the quenching of the blue and green emission by the Cr6+ ions, because these ions have absorption bands at around 260, 360 and 440 nm. When we excite the sample (graphene cluster with Cr6+ ions) at 350 nm to observe the blue emission or excite at 420 nm to observe the green emission, the Cr6+ ions could block (the inner filter effect) the excitation of the graphene nanostructure. Consequently, the emission at 440 or 520 nm could be reduced.56,62,65
Here, it must be noted that the previously reported sensing work towards the selective detection of Cr6+ ions involved a mechanism known as the inner filter effect (IFE). The absorption spectrum maxima of Cr6+ ions has values at 260, 360 and 440 nm matching with either the excitation maximum at around 350 nm of the blue emission-giving carbon dots,62 GQDs60,61 and green emission-giving g-C3N4 (ref. 51) or emission maximum at around 450 nm of carbon dots and GQDs. Because of this, the nanostructures were effectively shielded from giving a strong emission. Therefore, by monitoring the quenching trend of the emission at either 440 nm (ex: 350 nm) or 520 nm (ex: 350 nm), it was possible to selectively detect the Cr6+ ions. Some have reported the kinetic behavior of the reaction between the nanostructure and Cr6+ ions during sensing to be ‘static’ in nature.60,61 The static nature of the interaction was confirmed by monitoring the fluorescence lifetime (average value) before and after the addition of Cr6+ ions, which remained unchanged.
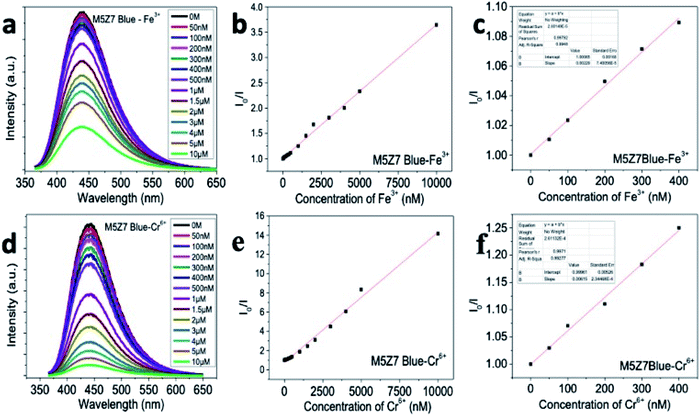
To understand the kinetic mechanism of sensing in the present case, the PL decay curves were measured. Fig. 11b and c show the PL decay curves of the M5 sample (as a representative example) at the blue and green emission positions in the absence and presence of metal ions. In a 3 ml volume of the M5 sample, we added Fe3+ in concentration steps of 50 nM to 500 nM. When the ion concentration reached 10 μM, the blue emission was quenched “almost completely”. In the case of Cr6+ ion sensing, the same volume of ion solution was added in a separate nanostructure dispersion of 3 ml volume. The emission at the blue wavelength was then monitored. Here, the blue emission intensity started being quenching from an unquenched state to a “completely quenched” state when the concentration of the Cr6+ ion solution reached 10 μM. In all experiments, the PL emission intensity was quenched immediately after the addition of the ion solution. Moreover, at a given concentration of ion solution, if the nanostructure dispersion was kept for a much longer time, then there was either no change in the quenching effect, or a clustering formation. Using the emission decay curves recorded from the quenched sample, the average lifetime value was calculated and compared with the lifetime values of unquenched samples at their respective emission wavelengths. For example, the PL decay curve was fitted with a bi-exponential decay, and the average lifetime value before the addition of Fe3+ or Cr6+ ions were calculated to be 12.8 ns at the blue emission wavelength. At the same time, a drastic decrease in the PL decay at 440 nm was observed upon the addition of either Fe3+ or Cr6+ analytes. It was therefore found that the average PL lifetime value was decreased from 12.8 ns to 5.4 ns and 4.1 ns upon adding Fe3+ and Cr6+ ions, respectively, at the blue wavelength. In a similar study, the decay curve at the green emission wavelength showed a decrease in the average lifetime value to 3.5 ns, from its unquenched average lifetime value of 13.4 ns, upon the addition of the Cr6+ ions. An interesting point is that the Fe3+ ion-sensed sample can also be used to conduct the Cr6+ ion quenching experiment since there is no change in the green emission intensity upon the addition of Fe3+ ions. The observed PL decay measurements thus supported the PL experimental data. Therefore, it is concluded that by using the blue emission-quenched sample (because of the addition of Fe3+), one can keep the green emission intact and can use this green emission intact sample to selectively monitor Cr6+ ions. Otherwise, one can monitor both blue and green emission quenching to quantify the Cr6+ ions. Thus, from the PL decay experiments, it was made clear that the reaction mechanism behind both Fe3+ and Cr6+ ion sensing was not static, but is dynamic in nature. This conclusion, therefore, rules out the inner filter effect-assisted quenching in the present samples as well.
The PL quenching graphs and respective Stern–Volmer plots,48,49 corresponding to the sensing of the Fe3+ and Cr6+ ions, are presented in Fig. 12, S5 and S6† for the M5Z7 and M9Z7 samples. The quenching constant values calculated from the Stern–Volmer plot, corresponding to the quenching of the emission wavelengths at 440 nm and 520 nm, are tabulated in Table 1. The blue emission from the M5Z7 sample showed the lowest detection limit of 39 nM against Fe3+ ions with a quenching constant value of 0.00915 × 10⁹, whereas the green emission from the M9Z7 sample showed a better detection limit of 43 nM against Cr6+ with a quenching constant value of 0.0118 × 10⁹. The R2 values corresponding to these sensing experiments are given in Table 1. The data corresponding to other samples (M2, M5, and M9) are given in the ESI Fig. S7–S10.† The PL quenching-based sensing experiments thus reveal that the as-prepared graphene nanostructures not only showed high selectivity, but also exhibited high sensitivity in the range of 39–43 nM. The limit of detection of the present study (for both Fe3+ and Cr6+) are much lower than the safe permissible limits prescribed by the Environmental Protection Agency, USA.66,67 Therefore, our probe can efficiently detect the trace levels of Fe3+ and Cr6+ ions in order to maintain the environmental safety. Also, by comparing the present results with the literature, it is clear that the limit of detection is much better than those of most reported values. A detailed comparison with the literature is presented in the ESI† as separate tables for Fe3+ (Table T3†) and Cr6+ (Table T4†) ions. From the overall sensing experimental investigations, it is clear that the underlying mechanism of sensing is the photoinduced electron transfer from the GQD nanostructures to the analyte metal ions (Fe3+ and Cr6+).
| Sample/analyte | Fe3+ | Cr6+ | ||||
|---|---|---|---|---|---|---|
| Quenching constant (×109) | LoD limit of detection (nM) | R2 | Quenching constant (×109) | LoD limit of detection (nM) | R2 | |
| a Fe – iron, Cr – chromium. | ||||||
| M2-blue | 0.00278 | 33.36 | 0.9971 | 0.0114 | 45.06 | 0.99482 |
| M5-blue | 0.00549 | 46.31 | 0.99756 | 0.012 | 43.41 | 0.99704 |
| M5-green | — | — | — | 0.00652 | 46.37 | 0.99339 |
| M9-green | — | — | — | 0.0114 | 46.29 | 0.99667 |
| M5Z7-blue | 0.00529 | 39.14 | 0.9948 | 0.00615 | 45.35 | 0.99277 |
| M5Z7-green | — | — | — | 0.00622 | 46.27 | 0.99669 |
| M9Z7-blue | 0.00202 | 45.15 | 0.99491 | 0.0131 | 42.64 | 0.99524 |
| M9Z7-green | — | — | — | 0.0118 | 43.54 | 0.99766 |
Now, a question is raised about the insensitivity of Fe3+ ions in the quenching of green emission. We believed that the strength of the interaction between the sp2 graphene domain and ions matter a lot in the quenching process. To investigate this, the electron transfer interaction was studied by performing the quantum chemical calculations in the graphene–ion complex system. The calculation details are presented separately. There are several reports3,49,51–54,57,60–62 on the PL quenching-based sensing of Fe3+ and a few other analytes, which claim that the photoexcited charge transfer from the GQD systems to the analytes was the reason for the PL quenching effect. However, this charge-transfer interaction was hardly studied theoretically.
In the present work, we made an attempt to study the interaction between the GQD nanostructures and analytes (Fe3+ and Cr6+), which quenched the PL emission from the GQD nanostructures, using the spin-polarized density functional theory calculations. In addition, Bader charge analyses were carried out in order to determine the charge transfer between the graphene structure and the interacting metal ions.
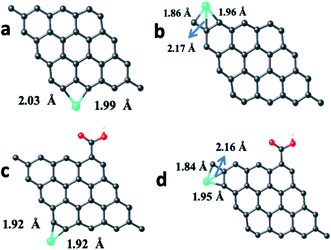
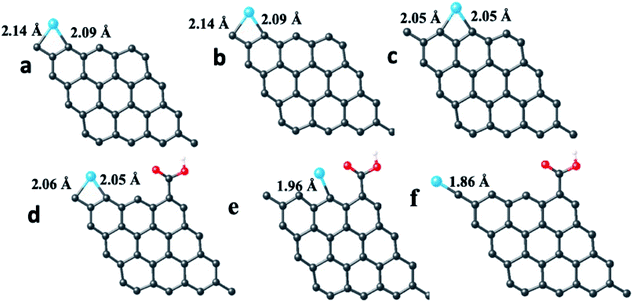
The pristine graphene sheet and –COOH (carboxylic acid) functionalized graphene sheet were allowed to interact with the Fe atom, Fe3+ ion, Cr atom, Cr3+ and Cr6+ ions at four different sites, viz., top, bridge, hollow and edge (the top, bridge, hollow and edge sites, respectively, represent the placing of the interacting atom/ion over the head of a carbon atom, over the bond between two carbon atoms, over the hollow space of a benzene ring and near the carbon atom at the edge of the graphene structure (parallel to the graphene structure)). The optimized structure of the pristine GQD, GQD–Fe, and GQD–Cr complexes are shown in Fig. 13–15 and S12–S21.† The calculated interaction energies are listed in Table 2. From the interaction energy values, it was found that the edge site was strongly interacting.
| Structure | Interacting site | Eint (eV) | CT (e) |
|---|---|---|---|
| a Fe – iron, Cr – chromium. | |||
| GQD–Fe | HH (hollow) | −1.53 | 0.89 |
| BH (bridge to hollow) | −2.70 | 0.88 | |
| TB (top to bridge) | −2.22 | 0.68 | |
| EE (edge) | −5.32 | 1.04 | |
| GQD–COOH–Fe | HH (hollow) | −1.18 | 0.86 |
| BH (bridge to hollow) | −1.35 | 0.87 | |
| TB (top to bridge) | −0.96 | 0.73 | |
| EE (edge) | −2.90 | 0.92 | |
| GQD–Fe3+ | HH (hollow) | −2.83 | 0.84 |
| BH (bridge to hollow) | −2.96 | 0.89 | |
| TE (top to edge) | −6.23 | 0.98 | |
| EE (edge) | −5.62 | 1.02 | |
| GQD–COOH–Fe3+ | HH (hollow) | −1.04 | 0.83 |
| BH (bridge to hollow) | −1.19 | 0.87 | |
| TE (top to edge) | −4.89 | 0.93 | |
| EE (edge) | −2.85 | 0.59 | |
| GQD–Cr | HH (hollow) | −1.86 | 0.82 |
| BH (bridge to hollow) | −3.68 | 0.99 | |
| TE (top to edge) | −4.83 | 0.97 | |
| EE (edge) | −3.00 | 0.65 | |
| GQD–COOH–Cr | HH (hollow) | −0.28 | 0.82 |
| BH (bridge to hollow) | −3.02 | 0.94 | |
| TE (top to edge) | −3.35 | 1.03 | |
| EE (edge) | −1.40 | 0.80 | |
| GQD–Cr3+ | HH (hollow) | −4.39 | 0.92 |
| BH (bridge to hollow) | −8.54 | 0.95 | |
| TE (top to edge) | −10.33 | 1.05 | |
| EE (edge) | −8.57 | 0.95 | |
| GQD–COOH–Cr3+ | HH (hollow) | −0.28 | 0.85 |
| BH (bridge to hollow) | −2.1 | 0.97 | |
| TE (top to edge) | −4.32 | 1.26 | |
| EE (edge) | −1.30 | 0.92 | |
| GQD–Cr6+ | HH (hollow) | −4.39 | 0.92 |
| BH (bridge to hollow) | −8.54 | 0.95 | |
| TE (top to edge) | −10.33 | 1.05 | |
| EE (edge) | −8.57 | 0.95 | |
| GQD–COOH–Cr6+ | HH (hollow) | −5.09 | 0.82 |
| BH (bridge to hollow) | −6.84 | 1.08 | |
| TE (top to edge) | −7.48 | 0.91 | |
| EE (edge) | −6.17 | 0.76 | |
The calculations were also done in carboxylic functional molecule attached GQD–ion complex systems to determine the influence of the functional molecules on the interaction strength of the ions with graphene. The GQD–COOH structures are shown in Fig. 14 and 15. Here, the edge site was also the highly interactive one. The interaction energies were −2.90 eV and −4.89 eV for the Fe atom and Fe3+ ion, respectively, with an average bond length of 1.92 Å. As shown in Fig. 13, 14 and S13,† the Fe atom initially placed at the bridge and top sites of graphene was moved to the hollow and bridge sites of GQD, and the Fe3+ ion initially placed at the bridge and top sites preferred to bind at the hollow and edge sites, respectively. The Fe atom and Fe3+ ions initially placed at the hollow and edge sites were covalently bound at the same sites of the graphene network. As shown in Fig. 14, it was found that the Fe atom and Fe3+ ions formed strong covalent bonds with the respective neighboring carbon atom of GQD at the edge sites. This result is in agreement with the previous study.68
As given in Table 2, among all of the configurations studied, the edge site was the highly interactive and favorable site for both Fe atom and Fe3+ ion with interaction energies of −5.32 eV and −6.23 eV, respectively. The bond lengths for Fe–C and Fe3+–C were 2.01 Å and 2.00 Å, respectively, which are comparable to the typical covalent bond distance between carbon and Fe atoms. From the Bader charge analysis (Table 2), it was observed that charges of about 1.04e and 0.98e were transferred to the Fe atom and Fe3+ ion, respectively, from the attached carbon atom of GQD.
Similar to the Fe atom and Fe3+ ion, the Cr atom, Cr3+ ion and Cr6+ ion were allowed to interact with the pristine graphene sheet at different sites (top, bridge, hollow and edge).
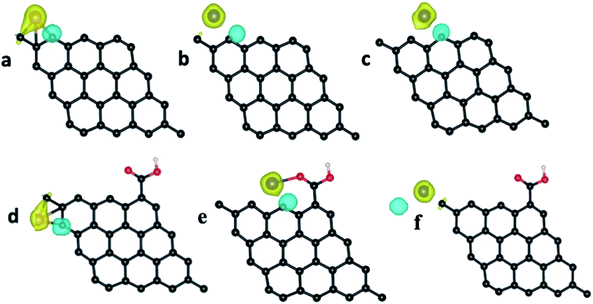
The optimized GQD–Cr and GQD–COOH–Cr complex structures are presented in Fig. 15 and S16–S21.† As presented in Fig. 15, the Cr atom, Cr3+, and Cr6+ ions also strongly interacted with GQD at the edge site through a covalent bond formation. The average bond length between the Cr atom/ion and the neighboring carbon atom was found to be 2.11 Å. As given in Table 2, the GQD–Cr6+ complex had a higher interaction energy of −10.33 eV, compared to the GQD–Cr and GQD–Cr3+ complexes, which demonstrates the higher possibility of interaction between the GQD structure and Cr6+ ions. The Bader charge analysis showed that a charge of 1.05e was transferred from the carbon atom of GQD to the Cr6+ ion. The interactions of the GQD–COOH structure with the Cr atom, Cr3+, and Cr6+ ions were also studied. The GQD–COOH–Cr6+ demonstrated a higher interaction energy of −7.48 eV, compared to the other complexes (Table 2). The electron density difference plots of the optimized structures with higher interaction energy values in each complex are shown in Fig. 16. Upon an overall comparison of the interaction energy values, it was observed that the Cr6+ ions had strong interaction energies. Among the various sites, the edge, hollow, top and bridge sites showed interaction strengths in descending order. The interaction energy value corresponding to the Cr6+ ions decreased in the presence of functional molecules, with the exception of the edge site. In the case of the interaction of the Fe3+ ion with graphene, the interaction energy values were low in magnitude. The interaction strength further decreased drastically in the presence of functional molecules. Since we have not observed green emission quenching by Fe3+ ions, by co-relating this experimental result with the theoretical data, we can conclude that the interaction strength for the Fe3+ ions with graphene domains is weak. Therefore, there is a restriction for the transfer of photoexcited charge carriers from graphene to Fe3+ ions. At the same time, this Fe3+ ion can quench the emission from functional molecules.
In the real-time experiments, the nanostructure with several functional molecules attached to the nanostructure would encounter Cr6+ or Fe3+ ions in close proximity, establishing a weak interaction. That weak interaction energy might have been sufficient enough to remove the photoexcited charge carriers from the functional molecules, thus resulting in the PL quenching at the blue wavelength. Based on the experimental and theoretical calculation results, the PL quenching-based sensing mechanism can be explained as follows. As discussed earlier, the blue emission around 440 nm is attributed to both intrinsic (sp2 domains) and extrinsic (–COOH functional groups) factors. While performing the sensing experiment, the illumination of the GQD sample with 350 nm excitation wavelength excites electrons from both the sp2 domains and functional groups. A competition thus arises between them to get transferred to the Fe3+ ion. The electrons excited from the functional groups compete to get transferred to the Fe3+ ion, whereas the electrons excited from the sp2 domains radiatively recombine to give out blue emission, which can be seen as unquenched emission in the PL quenching spectra. Therefore, it is clear that the Fe3+ ion can quench only the extrinsic emission from the GQD samples, which is termed as ‘extrinsic quenching’. It is because of this reason that the intrinsic green emission could not be quenched by the Fe3+ ions. We hypothesize that the less positive Fe3+ ions (compared to Cr6+ ions) are relatively weaker, and that they could not capture the electrons excited from the intrinsic origins (sp2 domains). Alternatively, the Cr6+ ions underwent ‘intrinsic quenching’ and completely quenched the intrinsic green emission. This indicates that the Cr6+ ions are strong enough (more positive) to scavenge the excited electrons from both the extrinsic and intrinsic origins.
Conclusion
The dual blue-green emitting graphene cluster-type nanostructures were prepared by the microwave-assisted synthesis method. The graphene quantum dots were initially formed by the reaction without metal content. The systematic increase in the urea concentration resulted in the increase of the lateral dimension of GQDs by increased nitrogen incorporation. Furthermore, their PL emission maxima shifted from the blue to green regions. The addition of metal content resulted in the formation of a new graphene quantum dot (GQD) interconnected cluster-type wire-like network morphology. We investigated the photophysics of the GQD coupled clusters in detail, and arrived at the following conclusions. The cluster system exhibited two strong emission colors that were sensitive to the excitation wavelength. The cluster, as a single system, behaved with dual-emitting character. The observed dual emission characteristics were a unique feature of this structure. In inorganic QD systems, when QDs with different sizes are brought close enough, the emission of the wide bandgap QD system is red shifted either through energy transfer or an electron transfer process. In contrast, the connected GQD system exhibited dual emission. The possible electron transfer process from the photoexcited blue emission graphene domain to green emission domain did not take place. This could be due to the constraint provided by the local structural disorder around the domains of the GQDs. As the charge localization mimics the Coulomb blockade effect in quantum nanostructures, it is believed that these structures can be used in quantum charge transport-based applications.The as-prepared graphene nanostructured samples were able to selectively detect Fe3+ ions and Cr6+ ions. The photoexcited electron transfer from the graphene nanostructures to the metal ion analytes was the reason behind the quenching process. The Fe3+ ions followed the extrinsic quenching to selectively quench the extrinsic blue emission, whereas the Cr6+ ions underwent both extrinsic and intrinsic quenching of the blue-green emissions. The PL decay lifetime investigation revealed that both Fe and Cr analytes dynamically quenched the PL emission. Spin-polarized quantum chemical calculations further confirmed the complex formation between the GQD nanostructures and analyte ions, and the resultant electron transfer interaction.
Authors contributions
Authors G. B. and D. N. conceived the idea. G. B. prepared the samples, and performed the structural and optical characterization. G. B. and S. P. carried out the sensing experiments. P. S. contributed to the HRTEM measurements. T. D. T. contributed to the FTIR measurements. K. S. K., R. K. and P. K. contributed to the quantum chemical calculations. O. Y. K. performed the XPS measurements. M. G. and D. P. carried out the X-ray absorption measurements. G. B. and D. N. analyzed the collected data and wrote the manuscript.Conflicts of interest
There are no conflicts to declare.Acknowledgements
Author G. B. acknowledges the University Grants Commission, Govt. of India, for providing a BSR fellowship. Author D. N. acknowledges the University Grants Commission, Govt. of India, for sanctioning the Centre for Advanced studies in Physics for the Development of Solar Energy Materials and Devices (Award No. F. No. 2-1/2013(NS/PE)). D. N. also acknowledges the RUSA Program Phase I (Component-8) Research and Innovation, India.References
- D. Qu, M. Zheng, J. Li, Z. Xie and Z. Sun, Light: Sci. Appl., 2015, 4, e364 CrossRef CAS
.
- M. K. Kumawat, M. Thakur, R. B. Gurung and R. Srivastava, ACS Sustainable Chem. Eng., 2017, 5, 1382–1391 CrossRef CAS
.
- L. Zhou, J. Geng and B. Liu, Part. Part. Syst. Charact., 2013, 30, 1086–1092 CrossRef CAS
.
- A. Nourbakhsh, M. Cantoro, T. Vosch, G. Pourtois, F. Clemente, M. H. Van Der Veen, J. Hofkens, M. M. Heyns, S. De Gendt and B. F. Sels, Nanotechnology, 2010, 21, 435203 CrossRef PubMed
.
- A. I. Chernov, P. V Fedotov, A. V Talyzin, I. Suarez Lopez, I. V Anoshkin, A. G. Nasibulin, E. I. Kauppinen and E. D. Obraztsova, ACS Nano, 2013, 7, 6346–6353 CrossRef CAS PubMed
.
- D. Pan, J. Zhang, Z. Li and M. Wu, Adv. Mater., 2010, 22, 734–738 CrossRef CAS PubMed
.
- Z. Gan, H. Xu and Y. Hao, Nanoscale, 2016, 8, 7794–7807 RSC
.
- D. Qu, M. Zheng, L. Zhang, H. Zhao, Z. Xie, X. Jing, R. E. Haddad, H. Fan and Z. Sun, Sci. Rep., 2014, 4, 5294 CrossRef CAS PubMed
.
- J. Ju and W. Chen, Biosens. Bioelectron., 2014, 58, 219–225 CrossRef CAS PubMed
.
- X.-F. Li, K.-Y. Lian, L. Liu, Y. Wu, Q. Qiu, J. Jiang, M. Deng and Y. Luo, Sci. Rep., 2016, 6, 23495 CrossRef CAS PubMed
.
- S. Zhu, Y. Song, X. Zhao, J. Shao, J. Zhang and B. Yang, Nano Res., 2015, 8, 355–381 CrossRef CAS
.
- F. A. Permatasari, A. H. Aimon, F. Iskandar, T. Ogi and K. Okuyama, Sci. Rep., 2016, 6, 21042 CrossRef CAS PubMed
.
- H. Yoon, Y. H. Chang, S. H. Song, E.-S. Lee, S. H. Jin, C. Park, J. Lee, B. H. Kim, H. J. Kang, Y.-H. Kim and S. Jeon, Adv. Mater., 2016, 28, 5255–5261 CrossRef CAS PubMed
.
- K. S. Novoselov, A. K. Geim, S. V Morozov, D. Jiang, M. I. Katsnelson, I. V Grigorieva, S. V Dubonos and A. A. Firsov, Nature, 2005, 438, 197–200 CrossRef CAS PubMed
.
- K. S. Novoselov, ECS Trans., 2009, 19, 3–7 CrossRef CAS
.
- T. Gokus, R. R. Nair, A. Bonetti, M. Böhmler, A. Lombardo, K. S. Novoselov, A. K. Geim, A. C. Ferrari and A. Hartschuh, ACS Nano, 2009, 3, 3963–3968 CrossRef CAS PubMed
.
- G. Bharathi, D. Nataraj, S. Premkumar, M. Sowmiya, K. Senthilkumar, T. D. Thangadurai, O. Y. Khyzhun, M. Gupta, D. Phase, N. Patra, S. N. Jha and D. Bhattacharyya, Sci. Rep., 2017, 7(10850) CAS
.
- W. U. Khan, D. Wang, W. Zhang, Z. Tang, X. Ma, X. Ding, S. Du and Y. Wang, Sci. Rep., 2017, 7, 1–9 CrossRef CAS PubMed
.
- Y. Liu, W. Duan, W. Song, J. Liu, C. Ren, J. Wu, D. Liu and H. Chen, ACS Appl. Mater. Interfaces, 2017, 9, 12663–12672 CrossRef CAS PubMed
.
- P. E. Blöchl, O. Jepsen and O. K. Andersen, Phys. Rev. B: Condens. Matter Mater. Phys., 1994, 49, 16223–16233 CrossRef PubMed
.
- G. Kresse and D. Joubert, Phys. Rev. B: Condens. Matter Mater. Phys., 1999, 59, 1758–1775 CrossRef CAS
.
- G. Kresse and J. Furthmüller, Phys. Rev. B: Condens. Matter Mater. Phys., 1996, 54, 11169–11186 CrossRef CAS PubMed
.
- G. Kresse and J. Furthmüller, Comput. Mater. Sci., 1996, 6, 15–50 CrossRef CAS
.
- G. Kresse and J. Hafner, Phys. Rev. B: Condens. Matter Mater. Phys., 1993, 47, 558–561 CrossRef CAS PubMed
.
- J. P. Perdew, K. Burke and M. Ernzerhof, Phys. Rev. Lett., 1997, 78, 1396 CrossRef CAS
.
- J. P. Perdew, K. Burke and M. Ernzerhof, Phys. Rev. Lett., 1996, 77, 3865–3868 CrossRef CAS PubMed
.
- S. L. Dudarev, G. A. Botton, S. Y. Savrasov, C. J. Humphreys and A. P. Sutton, Phys. Rev. B: Condens. Matter Mater. Phys., 1998, 57, 1505–1509 CrossRef CAS
.
- S. Chen and X. C. Zeng, ACS Appl. Mater. Interfaces, 2017, 9, 12100–12108 CrossRef CAS PubMed
.
- Y. Wang, H. Fang, C. L. Zacherl, Z. Mei, S. Shang, L.-Q. Chen, P. D. Jablonski and Z.-K. Liu, Surf. Sci., 2012, 606, 1422–1425 CrossRef CAS
.
- E. Sanville, S. D. Kenny, R. Smith and G. Henkelman, J. Comput. Chem., 2007, 28, 899–908 CrossRef CAS PubMed
.
- M. Figueras, I. J. Villar-Garcia, F. Vines, C. Sousa, V. A. De La Pena O'Shea and F. Illas, J. Phys. Chem. C, 2019, 123, 11319–11327 CrossRef CAS
.
- T. Xing, Y. Zheng, L. H. Li, B. C. C. Cowie, D. Gunzelmann, S. Z. Qiao, S. Huang and Y. Chen, ACS Nano, 2014, 8, 6856–6862 CrossRef CAS PubMed
.
- T. Song, Y. Zhao, T. Wang, J. Li, Z. Jiang and P. Yang, J. Fluoresc., 2020, 30, 81–89 CrossRef CAS PubMed
.
- A. Ganguly, S. Sharma, P. Papakonstantinou and J. Hamilton, J. Phys. Chem. C, 2011, 115, 17009–17019 CrossRef CAS
.
- S. Cao, J. Zheng, J. Zhao, Z. Yang, C. Li, X. Guan, W. Yang, M. Shang and T. Wu, ACS Appl. Mater. Interfaces, 2017, 9, 15605–15614 CrossRef CAS PubMed
.
- D. Lee, J. Seo, X. Zhu, J. Lee, H.-J. Shin, J. M. Cole, T. Shin, J. Lee, H. Lee and H. Su, Sci. Rep., 2013, 3, 2250 CrossRef PubMed
.
- R. Arrigo, M. E. Schuster, Z. Xie, Y. Yi, G. Wowsnick, L. L. Sun, K. E. Hermann, M. Friedrich, P. Kast, M. Ha and A. Knop-gericke, ACS Catal., 2015, 5, 2740–2753 CrossRef CAS
.
- E. Bekyarova, M. E. Itkis, P. Ramesh, C. Berger, M. Sprinkle, W. A. De Heer and R. C. Haddon, J. Am. Chem. Soc., 2009, 1336–1337 CrossRef CAS PubMed
.
- V. Lee, R. V Dennis, B. J. Schultz, C. Jaye, D. A. Fischer and S. Banerjee, J. Phys. Chem. C, 2012, 116, 20591–20599 CrossRef CAS
.
- M. Matsumoto, Y. Saito, C. Park, T. Fukushima and T. Aida, Nat. Chem., 2015, 7, 730–736 CrossRef CAS PubMed
.
- J. Zhao, L. Tang, J. Xiang, R. Ji, J. Yuan, J. Zhao, R. Yu, Y. Tai and L. Song, Appl. Phys. Lett., 2014, 105, 111116 CrossRef
.
- D. L. Pavia, G. M. Lampman, G. S. Kriz and J. Vyvyan, Introduction to spectroscopy, Brooks/Cole, Cengage Learning, Belmont, CA, 2009 Search PubMed
.
- J. Ou, Y. Tao, J. Ma and Y. Kong, J. Electrochem. Soc., 2015, 162, H884–H889 CrossRef CAS
.
- M. P. Kumar, T. Kesavan, G. Kalita, P. Ragupathy, T. N. Narayanan and D. K. Pattanayak, RSC Adv., 2014, 4, 38689–38697 RSC
.
- H. Nie, M. Li, Q. Li, S. Liang, Y. Tan, L. Sheng and W. Shi, Chem. Mater., 2014, 26, 3104–3112 CrossRef CAS
.
- S. Dutta Choudhury, J. M. Chethodil, P. M. Gharat, P. K. Praseetha and H. Pal, J. Phys. Chem. Lett., 2017, 8, 1389–1395 CrossRef CAS PubMed
.
- W. Gao, H. Song, X. Wang, X. Liu, X. Pang, Y. Zhou, B. Gao and X. Peng, ACS Appl. Mater. Interfaces, 2018, 10, 1147–1154 CrossRef CAS PubMed
.
- Z. Qian, J. Ma, X. Shan, H. Feng, L. Shao and J. Chen, Chem.–Eur. J., 2014, 20, 2254–2263 CrossRef CAS PubMed
.
- A. Ananthanarayanan, X. Wang, P. Routh, B. Sana, S. Lim, D. H. Kim, K. H. Lim, J. Li and P. Chen, Adv. Funct. Mater., 2014, 24, 3021–3026 CrossRef CAS
.
- V. Roshni and O. Divya, Curr. Sci., 2017, 112, 385–390 CrossRef CAS
.
- M. Rong, L. Lin, X. Song, Y. Wang, Y. Zhong, J. Yan, Y. Feng, X. Zeng and X. Chen, Biosens. Bioelectron., 2015, 68, 210–217 CrossRef CAS PubMed
.
- P. Lv, Y. Yao, H. Zhou, J. Zhang, Z. Pang, K. Ao, Y. Cai and Q. Wei, Nanotechnology, 2017, 28, 165502 CrossRef PubMed
.
- A. Hulanicki, S. Glab and F. Ingman, Pure Appl. Chem., 1991, 63, 1247–1250 Search PubMed
.
- S. Li, Y. Li, J. Cao, J. Zhu, L. Fan and X. Li, Anal. Chem., 2014, 86, 10201–10207 CrossRef CAS PubMed
.
- P. Hemmatkhah, A. Bidari, S. Jafarvand, M. R. M. Hosseini and Y. Assadi, Microchim. Acta, 2009, 166, 69–75 CrossRef CAS
.
- S. Huang, H. Qiu, F. Zhu, S. Lu and Q. Xiao, Microchim. Acta, 2015, 182, 1723–1731 CrossRef CAS
.
- F. Cai, X. Liu, S. Liu, H. Liu and Y. Huang, RSC Adv., 2014, 4, 52016–52022 RSC
.
- Z. S. Qian, X. Y. Shan, L. J. Chai, J. R. Chen and H. Feng, Biosens. Bioelectron., 2015, 68, 225–231 CrossRef CAS PubMed
.
- K. M. Tripathi, A. Singh, A. Bhati, S. Sarkar and S. K. Sonkar, ACS Sustainable Chem. Eng., 2016, 4, 6399–6408 CrossRef CAS
.
- F. Cai, X. Liu, S. Liu, H. Liu and Y. Huang, RSC Adv., 2014, 4, 52016–52022 RSC
.
- S. Huang, H. Qiu, F. Zhu, S. Lu and Q. Xiao, Microchim. Acta, 2015, 182, 1723–1731 CrossRef CAS
.
- M. Zheng, Z. Xie, D. Qu, D. Li, P. Du, X. Jing and Z. Sun, ACS Appl. Mater. Interfaces, 2013, 5, 13242–13247 CrossRef CAS PubMed
.
- X. Li, S. Zhang, S. a. Kulinich, Y. Liu and H. Zeng, Sci. Rep., 2015, 4, 4976 CrossRef
.
- J. Gu, D. Hu, W. Wang, Q. Zhang, Z. Meng, X. Jia and K. Xi, Biosens. Bioelectron., 2015, 68, 27–33 CrossRef CAS PubMed
.
- L. Bu, J. Peng, H. Peng, S. Liu, H. Xiao, D. Liu, Z. Pan, Y. Chen, F. Chen and Y. He, RSC Adv., 2016, 6, 95469–95475 RSC
.
- H. Xu, S. Zhou, L. Xiao, H. Wang, S. Li and Q. Yuan, J. Mater. Chem. C, 2015, 3, 291–297 RSC
.
- Y. Guo, F. Cao and Y. Li, Sens. Actuators, B, 2018, 255, 1105–1111 CrossRef CAS
.
- K. T. Chan, J. B. Neaton and M. L. Cohen, Phys. Rev. B: Condens. Matter Mater. Phys., 2008, 77, 235430 CrossRef
.
Footnote |
| † Electronic supplementary information (ESI) available. See DOI: 10.1039/d0ra04549g |
| This journal is © The Royal Society of Chemistry 2020 |


