 Open Access Article
STM apparent height measurements of molecular wires with different physical length attached on 2-D phase separated templates for evaluation of single molecular conductance†
Tomoya Iizuka,
Daiki Shimizu and
Kenji Matsuda
 *
*
Department of Synthetic Chemistry and Biological Chemistry, Graduate School of Engineering, Kyoto University, Katsura, Nishikyo-ku, Kyoto 615-8510, Japan. E-mail: kmatsuda@sbchem.kyoto-u.ac.jp
First published on 9th June 2020
Abstract
Single molecular conductance of molecular wires is effectively evaluated by the combination of STM apparent height measurement and a 2-D phase separation technique. Previously the method was only applied to a set of molecular wires with the same physical length, but herein we applied the method to thienylene-based and phenylene-based molecular wires with different physical lengths. By considering the difference in physical molecular height including thermal contribution of conformational isomers, the conductance ratio was determined to be 1.3 ± 0.7, which is in agreement with the reported value determined by a break-junction method.
Introduction
The concept of single molecular electronics has attracted great interest for decades because it can minimize the size of electric elements to the single molecular level, realizing higher integration of electronic devices.1 For developing single molecular electronics, it is a key issue to evaluate electric properties of various single molecular elements. In general, single molecular conductance can be measured by means of mechanically controllable break junction (MCBJ)2 and scanning tunneling microscopy break junction (STM-BJ) techniques.3 These methods offer statistical treatment of single molecular properties by repeating the measurements. However, the method is based on formation of a single molecular junction between the metal electrode and anchoring group of the molecule. Therefore, undesired effects of anchoring groups and metal substrates cannot be ignored.On the other hand, comparing apparent height in constant-current STM measurement is also effective for investigating molecular conductance.4 Generally, in the method, apparent height difference is measured between self-assembled monolayers (SAMs) as a reference molecule and subject molecules confined in the SAMs on an Au substrate (Fig. 1a). Although this method can be applied to a wide range of samples, statistical analysis is difficult because of low frequency of appearance of target molecules in an STM image in order to keep them in single molecule state.
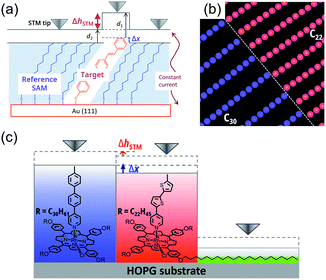 | ||
| Fig. 1 (a) STM apparent height measurement in self-assembled monolayers.4 (b) Schematic drawing of 2-D phase separation of porphyrin templates. (c) STM apparent height measurement on phase separated templates used in this study. | ||
To overcome these problems, we have proposed a novel method by using molecular templates.5 We employed tetraarylporphyrin–Rh(III) complexes bearing peripheral long alkyl chains as templates. When two porphyrin templates with different length of alkyl chains exist, each template separately forms two-dimensional (2-D) lamellar structures at a liquid/HOPG (highly oriented pyrolytic graphite) interface. The templates can be distinguished by measuring lattice parameters of a domain, which depends on the length of side chains.6,7 Furthermore, central Rh(III) atoms can carry a strongly bound axial ligand perpendicular to the surface. Thus, we can arrange two molecular wires on porphyrin templates closely and separately (Fig. 1b). These features allow simultaneous comparison of two different molecules and statistical treatment of apparent heights, which leads to more efficient and reliable investigation of single molecular conductance (Fig. 1c).
Conductance ratio between two molecules can be determined according to the eqn (1) below containing the difference of apparent heights (ΔhSTM) and physical molecular heights (Δx), which are derived from the two-layer tunnel junction model proposed by Weiss et al. (see ESI† for details).4 In our template method, derived conductance ratio can be regarded purely as the ratio between the two wires because transmission probability through the templates are canceled. Assuming electronic communication between attached wires and porphyrin template is negligible or independent from wire molecules, this method can avoid undesired effects of anchoring groups and metal substrate for junction formation.
 | (1) |
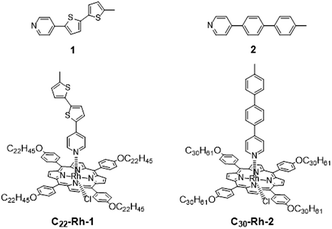
As shown in eqn (1), conductance ratio (G1/G2) is expressed as an exponential function about ΔhSTM and Δx. Therefore, precision of ΔhSTM and Δx is crucial for reliable evaluation. In the previous work, we demonstrated conductance measurement of planer and twisted 4-phenylpyridine derivatives on the basis of this method.5 In this special case, difference of molecular heights Δx can be regarded as zero, therefore conductance ratio can be simply evaluated from experimental ΔhSTM alone. The obtained conductance ratio agreed well to theoretically predicted value from their torsion angles.8–10 However, molecules of interest generally have different length, and Δx is not negligible. In this research, we compared single molecular conductance between two pyridyl molecules with different wire unit and molecular length; thienylene based 1 and phenylene based 2 (Fig. 2). We used DFT calculation for estimating Δx, which includes thermal contribution of conformation isomers, and the derived data were well agreed with the previously reported conductance ratio.
Results and discussion
We synthesized 1- or 2-appended tetraarylporphyrin–Rh(III) complexes with distinctive lengths of alkyl side chains (C22-Rh-1 and C30-Rh-2, see ESI† for synthetic procedures).5,11,12 Subscript numbers show the length of alkyl chains. STM image for a mixed solution of free base porphyrins with different alkyl chain lengths was reported in ref. 5, showing that there is no significant difference in the apparent height between these compounds.5Fig. 3 shows STM images of C22-Rh-1 and C30-Rh-2 obtained at 1-octanoic acid/HOPG interface using constant current mode. A drop of sample solution (8–10 μL) was deposited onto a freshly cleaved HOPG surface. The surface was kept wet because of the very slow evaporation of solvent. The tip was immersed into the solution on the HOPG surface and then images were collected. These tetraphenylporphyrins (TPPs) aligned side by side to form SAMs. The bright spots and the dark area correspond to TPP cores and alkyl chains, respectively. The lattice parameters of the unit cell (a, b, α) were (3.88 ± 0.01 nm, 1.72 ± 0.01 nm, 82°) for C22-Rh-1 and (5.04 ± 0.04 nm, 1.77 ± 0.01 nm, 82°) for C30-Rh-2. These parameters were compatible with those reported in our previous work using the same templates.5
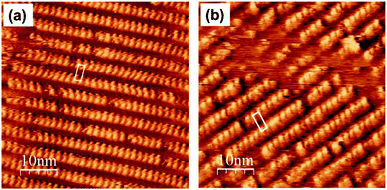 | ||
| Fig. 3 STM images of a solution of (a) C22-Rh-1 (4 × 10⁻⁶ M) and (b) C30-Rh-2 (4 × 10⁻⁷ M) in 1-octanoic acid on an HOPG substrate in the constant current mode (50 × 50 nm2, Iset = 30 pA, Vbias = −1.0 V).‡ White parallelograms show the unit cells. | ||
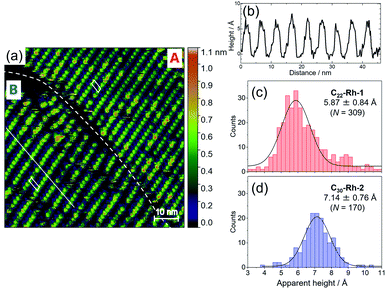
To measure apparent height difference between 1 and 2 simultaneously, first we optimized concentrations of C22-Rh-1 and C30-Rh-2. Taking accounts of stronger affinity of longer alkyl chains to an HOPG substrate, concentration of C22-Rh-1 was kept significantly higher than that of C30-Rh-2. After extensive optimizations (Fig. S3a–d in the ESI†), STM image with almost equal surface occupancies between C22-Rh-1 and C30-Rh-2 was obtained when concentration of C22-Rh-1 and C30-Rh-2 was 3.1 μM and 0.14 μM, respectively (Fig. S3e, f† and 3a). The optimized concentration of C30-Rh-2 was 20 times lower than that of C22-Rh-1, but observed coverages of C30-Rh-2 and C22-Rh-1 were comparable. In Fig. 4a, there are two domains with distinctive lattice indicated as domain A and B.
The lattice parameters of domain A were (3.90 ± 0.04 nm, 1.83 ± 0.02 nm, 83°), whereas those of domain B were (4.87 ± 0.01, 1.82 ± 0.01 nm, 86°). These parameters are compatible with those of pure C22-Rh-1 and C30-Rh-2 at 1-octanoic acid/HOPG interface (Table 1). Therefore, we assigned domain A and B as phase-separated C22-Rh-1 and C30-Rh-2 domains, respectively.
| a/nm | b/nm | α | |
|---|---|---|---|
| C22-Rh-1 | 3.88 ± 0.01 | 1.72 ± 0.01 | 82° |
| C30-Rh-2 | 5.04 ± 0.04 | 1.77 ± 0.01 | 82° |
| Domain A | 3.90 ± 0.04 | 1.83 ± 0.02 | 83° |
| Domain B | 4.87 ± 0.01 | 1.82 ± 0.01 | 86° |
Using the obtained STM image, the apparent height of C22-Rh-1 and C30-Rh-2 was analyzed. Apparent height of each bright spot in Fig. 4a was picked by section analysis as shown in Fig. 4b, and histograms of apparent height were separately created for both domains as shown in Fig. 4c and d. Each histogram was fitted with single Gaussian function to determine the apparent height. In domain B, some peaks are twice as high as the average. They might be two stacked molecules, but the number of these peaks are not notable in the histogram, so that they are not excluded from the analysis. As a result, apparent heights were obtained as 5.87 ± 0.84 Å for C22-Rh-1 and 7.14 ± 0.76 Å for C30-Rh-2. Therefore, difference in apparent height (ΔhSTM = h1 − h2) of C22-Rh-1 and C30-Rh-2 was calculated to be −1.27 ± 1.14 Å from Fig. 4a. To improve precision, we repeated the same analysis for another six images of the same scan area and determined ΔhSTM for each scan (Fig. S4, S5 and Table S3†). By averaging all seven obtained ΔhSTM, we determined ΔhSTM as −1.10 ± 0.55 Å. Because there are inevitable systematic errors among scans, we did not merge all the scan data into one histogram but averaged ΔhSTM determined from each scan.§
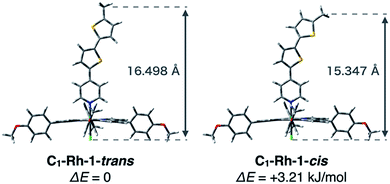
As mentioned above, it is necessary to determine the difference in physical molecular height between C22-Rh-1 and C30-Rh-2 (Δx) in order to derive the conductance ratio. We calculated energy-minimized structures of the rhodium complexes with shortened alkyl chains, namely C1-Rh-1 and C1-Rh-2. For better estimation of Δx, we considered both s-trans and s-cis conformations of the wire unit in 1 (C1-Rh-1-trans and C1-Rh-1-cis in Fig. 5).¶ Their physical heights were estimated to be 16.498 Å for C1-Rh-1-trans, 15.347 Å for C1-Rh-1-cis, and 17.563 Å for C1-Rh-2 based on optimized structures calculated at the B3LYP/6-31G(d) (for C,H,N,O,S,Cl), LANL2DZ (for Rh) level. It was also calculated that C1-Rh-1-trans is more stable by 3.21 kJ mol−1 than C1-Rh-1-cis (Table S4†). Assuming thermal equilibrium of C1-Rh-1-trans and C1-Rh-1-cis, we estimated the ratio of C1-Rh-1-trans/C1-Rh-1-cis to be 1/0.27 at 298 K by using the Boltzmann distribution. Therefore, the s-cis conformation has non-negligible effect on physical height of C1-Rh-1. Taking the weighted average length of C1-Rh-1-trans and C1-Rh-1-cis, physical height of C1-Rh-1 was given as 16.250 Å. Thus, Δx was determined to be −1.31 Å.
Introducing this Δx and the measured ΔhSTM to eqn (1), the conductance ratio between 1 and 2 was finally obtained to be G1/G2 = 1.3 ± 0.7. Note that as for decay constant of the gap space α in eqn (1), we adopted the decay constant of a methylene unit (β = 1.2 Å−1) reported by the measurement of a series of alkanethiols as a substitute for 1-octanoic acid,3 following our previous work.5 This result is in excellent agreement with the reported conductance ratio between bis(methylthio)-substituted bithiophene and biphenylene derivatives (G1/G2 = 1.1) determined by MCBJ method.13
Conclusions
In conclusion, we applied the constant current STM/2-D phase separated template method for comparing single molecular conductance of molecular wires with different lengths. With an aid of physical height estimation by DFT calculation including contribution of conformation isomers, the conductance ratio of thienylene-based 1 and phenylene-based 2 were estimated to be 1.3 ± 0.7. The obtained ratio was well agreed with the value derived from previously reported data determined by MCBJ method. It is reported that the relationship between apparent height and the conductance is not straightforward in the multi-layered structure.14 In this study, only one layer of molecule is concerned and the difference in apparent height is much less than the height of the layer, so that the conductance can be discussed by this method. Further investigations on single molecular conductance with STM/2-D phase separation technique are actively ongoing in our laboratory.Conflicts of interest
There are no conflicts to declare.Acknowledgements
This work was supported by a Grant-in-Aid for Scientific Research (B) (JSPS KAKENHI Grant Number JP19H02788).Notes and references
- N. Xin, J. X. Guan, C. G. Zhou, X. J. Chen, C. H. Gu, Y. Li, M. A. Ratner, A. Nitzan, J. F. Stoddart and X. F. Guo, Nat. Rev. Phys., 2019, 1, 211–230 CrossRef.
- M. A. Reed, C. Zhou, C. J. Muller, T. P. Burgin and J. M. Tour, Science, 1997, 278, 252–254 CrossRef CAS.
- B. Xu and N. J. Tao, Science, 2003, 301, 1221–1223 CrossRef CAS PubMed.
- L. A. Bumm, J. J. Arnord, T. D. Dunbar, D. L. Allara and P. S. Weiss, J. Phys. Chem. B, 1999, 103, 8122–8127 CrossRef CAS.
- T. Sakano, K. Higashiguchi and K. Matsuda, Chem. Commun., 2011, 47, 8427–8429 RSC.
- J. Otsuki, Coord. Chem. Rev., 2010, 254, 2311–2341 CrossRef CAS.
- T. Ikeda, M. Asakawa, M. Goto, K. Miyake, T. Ishida and T. Shimizu, Langmuir, 2004, 20, 5454–5459 CrossRef CAS PubMed.
- L. Venkataraman, J. E. Klare, C. Nuckolls, M. S. Hybertsen and M. L. Steigerwald, Nature, 2006, 442, 904–907 CrossRef CAS PubMed.
- D. Vonlanthen, A. Mishchenko, M. Elbing, M. Nueburger, T. Wandlowski and M. Mayor, Angew. Chem., Int. Ed., 2009, 48, 8886–8890 CrossRef CAS PubMed.
- A. Mishchenko, D. Vonlanthen, V. Meded, M. Bürkle, C. Li, I. V. Pobelov, A. Bagrets, J. K. Viljas, F. Pauly, F. Evers, M. Mayor and T. Wandlowski, Nano Lett., 2010, 10, 156–163 CrossRef CAS PubMed.
- S.-T. Liu, L. V. Reddy and R.-Y. Lai, Tetrahedron, 2007, 63, 1821–1825 CrossRef CAS.
- S. J. Thompson, M. R. Brennan, S. Y. Lee and G. Dong, Chem. Soc. Rev., 2018, 47, 929 RSC.
- E. J. Dell, B. Cpozzi, K. H. DuBay, T. C. Berkelbach, J. R. Moreno, D. R. Reichman, L. Venkataraman and L. M. Campos, J. Am. Chem. Soc., 2013, 135, 11724–11727 CrossRef CAS PubMed.
- D. Barlow, L. Scudiero and K. W. Hipps, Ultramicroscopy, 2003, 97, 47–53 CrossRef CAS PubMed.
Footnotes |
| † Electronic supplementary information (ESI) available: Experimental details, NMR/mass spectra and additional figures. See DOI: 10.1039/d0ra04484a |
| ‡ The concentrations of samples were determined by measuring absorbance at 429 nm, which corresponds to a Soret band of porphyrin templates. Molar extinction coefficient of C22-Rh-1 was determined to be 2.84 × 10⁵ M−1 cm−1 (Fig. S1 in the ESI†). We assumed that the molar extinction coefficients of C22-Rh-1 and C30-Rh-2 are identical. |
| § When all data for the seven scans were merged into one histogram, apparent height of C22-Rh-1 and C30-Rh-2 were obtained as 5.96 ± 0.94 Å and 6.76 ± 1.13 Å, respectively, and ΔhSTM was derived to be −0.80 ± 1.46 Å (Fig. S6 in the ESI†). The larger deviation is indicative for systematic error among scans, and thus simultaneous observation of two domains is important for data precision. |
| ¶ Physical heights of the complexes were calculated as sum of the Rh–Cl bond length and wire height. Wire height of each complex was measured as the distance between the top methyl carbon atom of the wire unit and the mean plane of porphyrin defined by porphyrinic 24 atoms (see ESI† for details). When s-trans conformation of C1-Rh-1 was solely considered, Δx and the center of G1/G2 were obtained as −1.07 Å and 0.96. From the reported experimental estimations (G1/G2 > 1 in ref. 12), we concluded that contribution of the conformers must be included. |
| This journal is © The Royal Society of Chemistry 2020 |

