
 Open Access Article
 This Open Access Article is licensed under a Creative Commons Attribution-Non Commercial 3.0 Unported Licence
Anaerobic fermentation of hybrid Pennisetum mixed with fruit and vegetable wastes to produce volatile fatty acids†
Tao Xing abcd,
Shutai Yue,
Feng Zhenabc,
Xiaoying Kongabc and
Yongming Sun*abc
abcd,
Shutai Yue,
Feng Zhenabc,
Xiaoying Kongabc and
Yongming Sun*abc
aGuangzhou Institute of Energy Conversion, Chinese Academy of Sciences, Guangzhou 510640, PR China. E-mail: sunym@ms.giec.ac.cn
bCAS Key Laboratory of Renewable Energy, Guangzhou 510640, PR China
cGuangdong Provincial Key Laboratory of New and Renewable Energy Research and Development, Guangzhou 510640, PR China
dUniversity of Chinese Academy of Sciences, Beijing 100049, PR China
eWestern China Energy & Environment Research Center, Lanzhou University of Technology, Lanzhou 730050, PR China
First published on 9th September 2020
Abstract
The production of volatile fatty acids (VFAs) via anaerobic fermentation is a new technology that provides a high-value utilization of biomass. This work used hybrid Pennisetum (HP) and fruit and vegetable waste (FVW) as raw materials to investigate the influence of different ratios of HP to FVW on the production of VFAs under different methanogenic inhibition conditions. It has been shown that both alkaline and neutral conditions (using methanogenic inhibitors), could generate higher acid yields than acidic conditions. Under initial alkaline conditions, mono-fermentation of HP and FVW could obtain maximum VFA yields of 596 ± 22 mg g−1 VS and 626 ± 7 mg g−1 VS, which were higher than those obtained under neutral conditions. In contrast, there was no remarkable difference in VFA yield between alkaline and neutral conditions when co-fermentation of HP and FVW was carried out. The VFA yields decreased significantly with the process of co-fermentation. The maximum VFA yields were decreased by 33.2% and 21.9% when HP was fermented with 15% and 30% of FVW, respectively. There was a clear difference in the composition of VFAs obtained under different initial conditions. The maximum selectivity was achieved under alkaline conditions, where the acetate content reached more than 85%. This study brings a theoretical basis for optimizing the anaerobic fermentation process of lignocellulose to produce VFAs.
1. Introduction
Lignocellulose is the most abundant and environmentally sustainable hydrocarbon resource. The conversion of lignocelluloses derived from the straw of crops or other plants into energy or bio-based products has aroused great interest.1,2 Anaerobic fermentation is one of the most promising technologies for the utilization of lignocellulosic biomass. It is an effective way to generate a clean form of energy and high-value derived products.3 Recently, besides its application for the production of biogas, a new way for the preparation of volatile fatty acids (VFAs), namely carboxylate platform compounds, has been revealed as a very promising technology, suited to gain maximum utilization of lignocellulose.4–6 VFAs are intermediate products generated during the acid production stage of anaerobic fermentation. VFAs are not only important platform compounds for food and pharmaceutical industries, using direct extraction of short-chain fatty acids (C2–C5),7 they are also raw materials to produce biofuels and high value-added chemicals.8,9 They can be used as a carbon source for biogas production, biopolymers (PHA), biofuels precursors, chain elongation or utilized as a carbon source for the biological nutrient removal from wastewater.10–13 In comparison with other technologies such as enzymatic saccharification for ethanol production, or thermochemical process for co-generation of carbon and gas, the technology for VFAs production offers potential benefits including high efficiency, low energy consumption, and economic profits.14In the past decades, the preparation of VFAs via anaerobic fermentation has been mainly based on the use of different organic wastes such as organic wastewater, kitchen waste, fruit and vegetable waste (FVW) or municipal sludge, rather than on the use of lignocellulose. Numerous efforts had been devoted to maximize the production of VFA and regulating the operating conditions of the anaerobic reactor.15–19 Sawatdeenarunat C. et al. reported optimum VFAs yield of 0.1 g g−1 VS from elephant grass with the micro-aerobic fermentation.20 Kim N.-J., et al. used an alkali-treated reed to maximally attain VFAs yield of 0.5 g g−1 raw material.21 Ai Ping et al. studied the effect of different pretreatments on acid fermentation from crop straw, and found that with alkaline pretreatment, an acid yield of 0.25 g g−1 VS could be achieved.22
On the other hand, it has been proven that the anaerobic co-fermentation has the advantages of an acid buffer system and an optimized C/N ratio of the substrate, representing significant progress in anaerobic fermentation technology.23,24 However, the anaerobic co-fermentation has been chiefly used to produce methane, and seldom applied for preparing VFAs. This study selected the energy plant-hybrid Pennisetum (HP) as the lignocellulosic raw material and fruit and vegetable waste (FVW) as the perishable raw material to investigate the impact of pH on the VFAs production from these two materials mixed at various ratios.
2. Material and methods
2.1 Substrate and inoculum
Pennisetum hybrid (P. americanum × P. purpureum) used in this study was harvested from Zengcheng, Guangdong Province, China, in November 2018. Grass samples were cut into 20 mm and then pulverized for 1 min using a DXF-20C pulverizer. The TS (total solid), VS (volatile solid) and C/N of grass were 14.9 ± 0.4%, 12.7 ± 0.3% and 37.0 ± 2.3. Fruit and vegetable waste which collected from Guangzhou Changban market were pulverized for 1 min using a DXF-20C pulverizer after removing the impurity. The TS, VS and C/N of FVW were 10.4 ± 0.3%, 9.4 ± 0.4% and 19.3 ± 0.1. The substrates were homogenized and stored at −20 °C before use. For the inoculum, anaerobic sludge, collected from a cow manure biogas plant in Longmen County, Guangdong Province, was cultured in a cellulose and cow manure fed mesophilic AD reactor. TS content, VS content and pH of the digestate was 1.4 ± 0.2%, 0.8 ± 0.2% and 7.6.2.2 Fermentation test setup
The acidogenic fermentation tests were conducted in batch mode in 500 ml glass bottles equipped with stirrers and Tedlar gas bags. 400 ml of inoculum and mass of substrate equivalent to the volatile solids loading of 2 g VS per 100 ml was added to each reactor. Deionized water was added to maintain the total volume of 450 ml. The reactors were placed in a constant temperature water bath and operated in the mesophilic temperature condition (37 °C) for 15 days. The experiment setup is shown in Table 1. Two mono-fermentation groups and two co-fermentation groups were carried out under different conditions. In order to avoid methanogenic activity, the pH in the reactors was adjusted initially to 6 or 11 using 18% HCl or 5 M NaOH. In the trials with neutral (unadjusted) pH, 50 mmol ml−1 BrCH2CH2SO3Na (BES) was added as a specific inhibitor in each reactor to inhibit the methanogenesis.25 During the entire fermentation period the pH in the bottles remained uncontrolled. Nitrogen gas was flushed into the bottles for 1 min to assure the anaerobic conditions. Afterwards, a 2 ml liquid sample was collected for analysis at day 1, 2, 3, 5, 10 and 15. All treatments were undertaken in duplicate.| Group | FVW percentage (VS, %) | C/N | Initial pH | BES (mmol l−1) |
|---|---|---|---|---|
| R1 | 0 | 37 | 6 | — |
| 11 | — | |||
| ∼7.5 | 50 | |||
| R2 | 15 | 32 | 6 | — |
| 11 | — | |||
| ∼7.5 | 50 | |||
| R3 | 30 | 29 | 6 | — |
| 11 | — | |||
| ∼7.5 | 50 | |||
| R4 | 100 | 19 | 6 | — |
| 11 | — | |||
| ∼7.5 | 50 |
2.3 Analytical methods
The contents of TS, VS, C and N were analyzed using previously described methods26,27 and pH was determined using a FiveEasy™ pH meter (METTLER TOLEDO, Switzerland). The soluble chemical oxygen demand (sCOD) concentration was measured using a spectrophotometer (Hach DR-2800, USA) and a Hach test kit. The sCOD was measured in the supernatant after filtration (0.45 μm filters). HPLC (Waters e2695) incorporating a refractive index detector was used to measure VFA contents. The column used in this analysis was Aminex HPX-87H (300 mm × 7.8 mm) with a mobile phase of 0.05 M H2SO4 and a flow rate of 0.5 ml min−1 at 50 °C.A GC-2014 gas chromatograph (Shimadzu, Japan) equipped with a thermal conductivity detector and a Porapak Q column was used to determine the gas composition of (CH4, CO2 and N2). The carrier gas was Ar, and a flow rate of 20 ml min−1 was maintained for the analysis. The injection port, column and detector temperatures were 30 °C, 70 °C and 120 °C, respectively.
2.4 Calculation methods
In order to assess the acidification potential of the substrates, the VFA yield (eqn (1)) was calculated based on the total VFA production which was considered as the sum of each individual acid. The acidification extent (AE) (eqn (2)) was calculated as the ratio of the cumulative VFA and final concentration of sCOD in the broth.28| P (mg g−1 VS) = TVFA × V/VSfed | (1) |
| AE (acidification extent, %) = CODTVFA/sCOD × 100% | (2) |
The synergistic effect index (SEI)30 for a co-fermentation was calculated as shown in eqn (3).
 | (3) |
In eqn (3), Pco represents the VFA yield of a co-digestion (mg g−1 VS). X1 and X2 are the VS fractions of the HP and FVW in the co-fermentation. P1 and P2 stand for the VFA yield from the mono-fermentation of the HP and FVW (mg g−1 VS) at the same day of co-digestion.
3. Results and discussion
3.1 pH changes and gas production in the fermentation process
pH is a key factor affecting acid production during the fermentation process. The production of VFAs can change the pH of the fermentation system, which will finally influence acid production during fermentation.31 The pH change and biogas production of all conditions are shown in Fig. 1 and 2. Under neutral conditions (addition of BES), there was a strong inhibition of the methanogenesis process where the production of biogas did not take place in any of the experiments. The pH remained above 6 in the mono-fermentation of HP, while it was reduced to 5.5–5.7 in the co-fermentation (Fig. 1). Under acid conditions (pHin = 6), the production of methane recovered in the co-fermentation groups R2 and R3 after the 12th day, with a cumulative production of 450 ± 9 ml and 288 ± 14 ml, respectively, while the production of methane failed in the mono-fermentation. In the mono-fermentation of HP, pH value fluctuated between 5.1–5.4, while in the co-fermentation it slightly fell below 5 and gradually rose to above 6.0, when methane production was recovered. Under alkaline conditions (pHin = 11), although the process of methanogenesis could be inhibited at the initial stage of fermentation, the activities of methanogens were gradually recovered due to the accumulation of VFAs, which resulted in pH drop. The methane production was recovered in the 5th day, reaching a cumulative production of 1364 ± 70 ml and 907 ± 23 ml, in the groups R3 and R4, respectively. In the group R2, production was recovery on the 8th day, achieving a cumulative value of 651 ± 18 ml. On the 15th day, the pH in the mono-fermentation of HP was greater than 8.5 and the system did not recover methane production.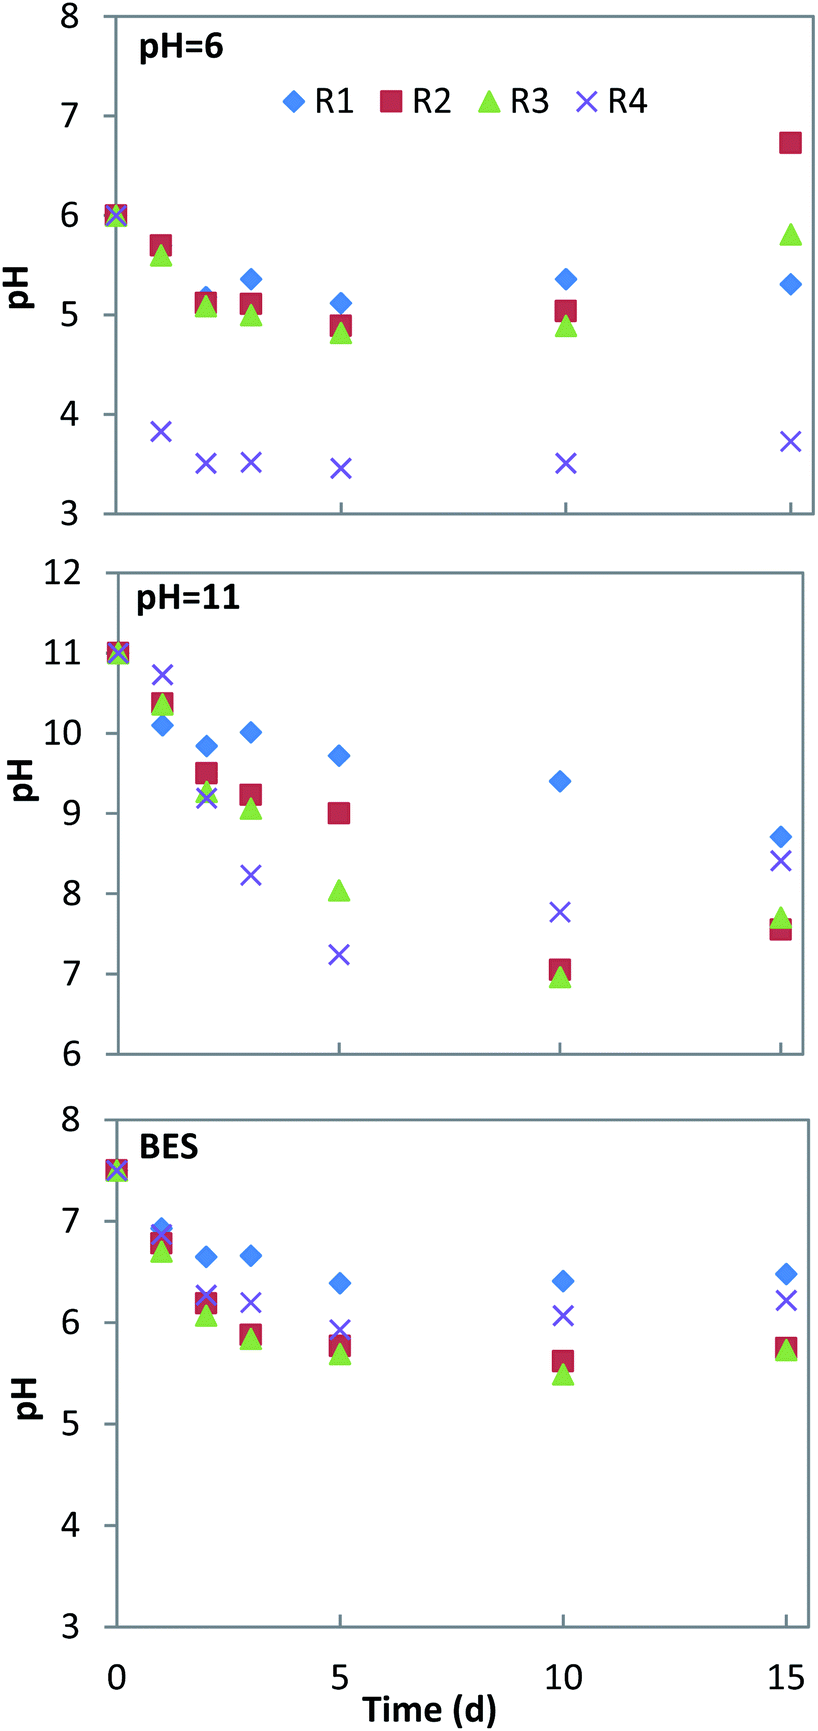 | ||
| Fig. 1 pH changes under various methanogenesis inhibition condition. | ||
 | ||
| Fig. 2 Daily methane production under various methanogenesis inhibition condition. | ||
3.2 VFAs yield and acidification extent
The accumulation of VFAs during anaerobic fermentation is achieved through a series of complex biochemical reactions, including the generation and decomposition of volatile acids.The solid organic matter is hydrolyzed to form macromolecular compounds, and then VFAs through the primary fermentative acidogenesis, syntrophic acetogenesis and homoacetogenesis. During these stages, microbial metabolism and methanogens can consume some VFAs.31,32 Fig. 3 shows the change in the concentration of acids generated from raw materials (a table of detailed data could be found in Table S1†), corresponding to different mixing ratios and under different inhibition conditions of methanogenesis.
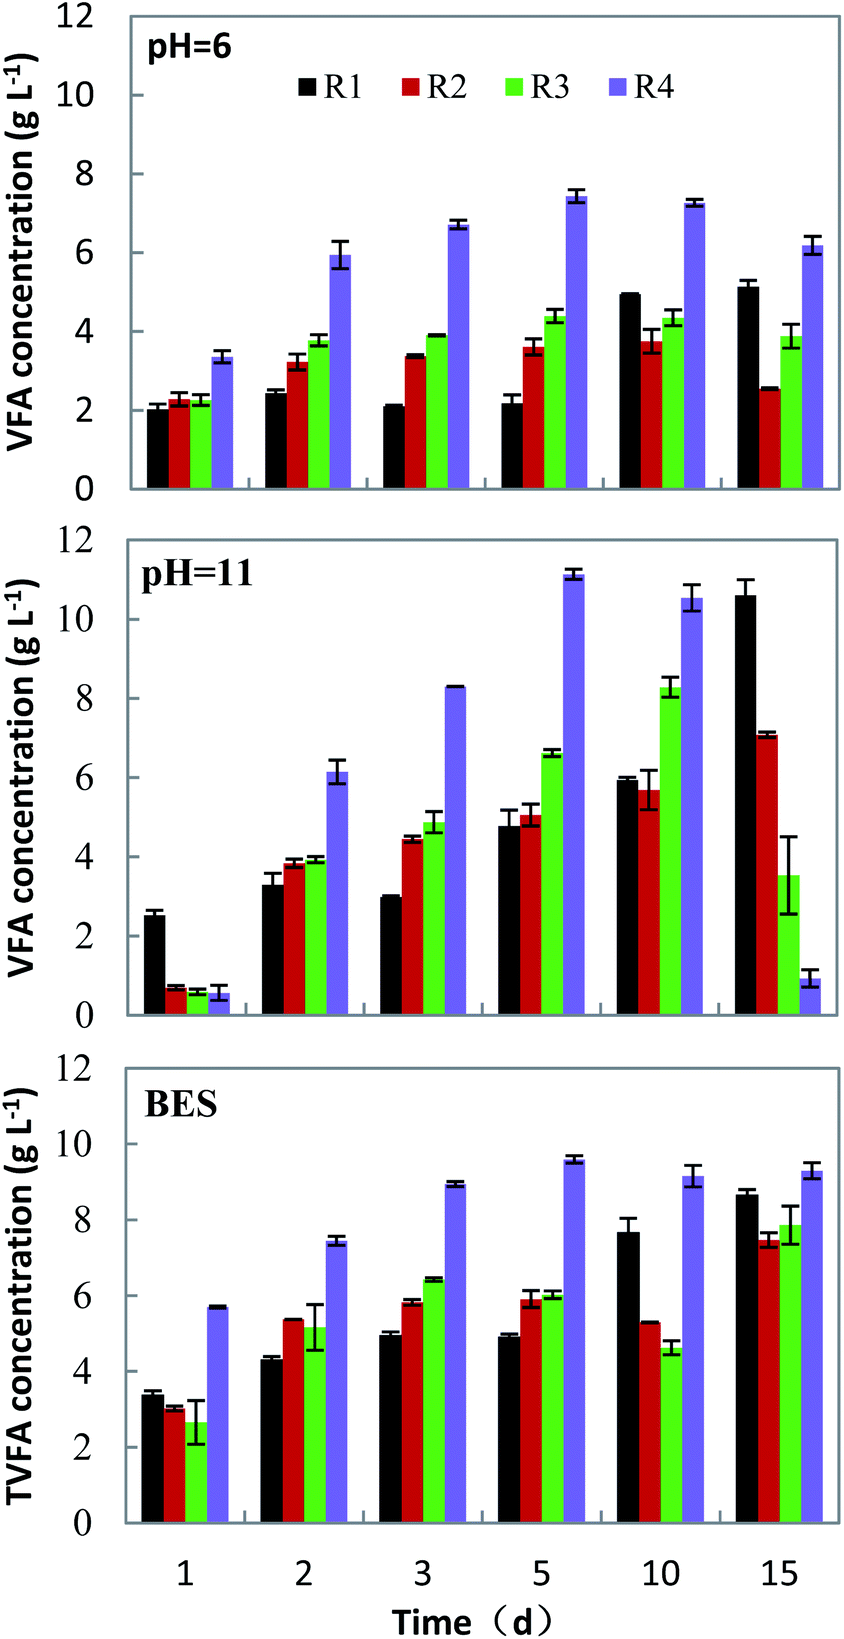 | ||
| Fig. 3 Changes of VFAs concentration under various methanogenesis inhibition conditions. | ||
Under neutral conditions obtained with the addition of BES addition, the concentration of VFAs gradually increased with time. In the fermentation of FVW, the concentration of VFAs reached its maximum on the 5th day, while in the rest, it was on the 15th day. The mono-fermentation of HP got the maximum VFAs concentration of 8.66 ± 0.14 g l−1, and it decreased by 13.8% and 9.2% for the groups R2 and R3, respectively, corresponding to a co-fermentation. Under alkaline conditions (pHin = 11.0), the concentration of VFAs gradually increased with time in the groups R1 and R2, while in groups R3 and R4, initially it had risen and then declined due to the recovery of biogas production. With a mono-fermentation of HP, the highest VFAs concentration was 10.60 ± 0.39 g l−1. In comparison with the mono-fermentation, the concentration of VFAs decreased by 33.2% (R2) and 21.9% (R3), respectively, in the co-fermentation. The decrease of VFAs concentration under alkaline conditions was much more than under both acidic and neutral conditions. Under acidic conditions (pHin = 6.0), the concentration of VFAs was low in all groups. The maximum concentration of VFAs was achieved during mono-fermentation of HP on the 10th day, and on the 5th day for the other groups. For the mono-fermentation of HP, the highest level was only 5.14 ± 0.16 g l−1, presumably because VFAs mostly existed in free state at pH < 5.5, which aggravated the inhibition of acid production from the hydrolysis of cellulose and hemicellulose.33,34 And the concentration of VFAs in the co-fermentation decreased by 26.9% (R2) and 14.5% (R3).
From the above, it is concluded that the three pathways inhibiting methanogenesis can effectively suppress methane production in the early stage of fermentation and that the VFAs yield from the substrate under various conditions was different. It was shown that highest VFAs yield is reached under alkaline conditions for mono-fermentation. And the VFAs yield of co-fermentation had little difference under alkaline and neutral conditions (Table 2). With the mono-fermentation of HP under alkaline conditions, the VFAs yield (597 ± 22 mg g−1 VS) was higher than that obtained using elephant grass (107 mg g−1 VS) using micro-aerobic way as methanogenic inhibition method, reported by Sawatdeenarunat et al.20 Park et al.35 used BES as a methanogenesis inhibitor to ferment alkali-treated rice straw and obtained a VFAs yield of 350 mg g−1 VS, lower than the results of our study. The mono-fermentation of FVW also produced the highest VFAs yield (626 ± 7 mg g−1 VS) under alkaline conditions. The alkaline pH could improve the hydrolysis of organic matter and provided substrates for the acidogenic microorganisms for the production of the VFAs.36 On the other hand VFAs mostly existed in ionic state under alkaline conditions, which has less toxic effect on microorganism.
| Maximum TVFA yield (mg g−1 VS) | Time (d) | SEI (%) | ||
|---|---|---|---|---|
| pHin = 6 | R1 | 289 ± 9 | 15 | — |
| R2 | 211 ± 17 | 10 | −31.5 | |
| R3 | 247 ± 10 | 5 | −24.6 | |
| R4 | 418 ± 9 | 5 | — | |
| pHin = 11 | R1 | 597 ± 22 | 15 | — |
| R2 | 398 ± 3 | 15 | −33.7 | |
| R3 | 466 ± 14 | 10 | −23.0 | |
| R4 | 626 ± 7 | 5 | — | |
| BES | R1 | 487 ± 8 | 15 | — |
| R2 | 420 ± 11 | 15 | −15.1 | |
| R3 | 442 ± 28 | 15 | −12.0 | |
| R4 | 540 ± 6 | 5 | — | |
To investigate the impact of co-fermentation on VFAs yield, the synergy factor (SEI) of co-fermentation with maximum VFAs yield was calculated. Table 2 shows that the values of SEI corresponding to a co-fermentation under various inhibition conditions were minus, indicating that there is no synergistic effect, but instead an antagonistic interaction. Because of hydrolysis, and VFAs yield rates of FVW were faster than HP, it was able to accelerate a pH drop and affect the accumulation rate of VFAs when the co-fermentation carried out. Although the co-fermentation could not improve the yield of VFAs, time could be shortened to reach the maximum VFAs yield under alkaline and acidic conditions. Particularly, under alkaline conditions, when the amount of FVW (VS) was 30%, the VFAs yield could reach 466 ± 14 mg g−1 VS within 10 days of fermentation.
To find out the cause of this different production of acids in each experimental group, the soluble organic matter (sCOD) and acidification extent (AE) at the maximum VFAs yield were calculated (Fig. 4). AE is the ratio that best expresses the degree conversion of sCOD into VFAs in the fermentation broth.37 Fig. 4 shows that the sCOD was much higher under alkaline and neutral conditions than under acidic conditions. It was 1.4–1.6 times greater under alkaline conditions, than under acidic conditions. This means that there was a drop in pH to a low value with VFAs production under acidic conditions, thus inhibiting the hydrolysis of the substrate to reduce VFAs productivity. For mono-fermentation of HP, the sCOD was 13.8% higher under alkaline conditions than under neutral conditions. It indicates that alkaline conditions are helpful to improve the hydrolysis of organic materials such as lignocellulose and the availability of substances for acidogens.
 | ||
| Fig. 4 Acidification extent and soluble COD under various inhibition conditions. | ||
The AE of all experimental groups were the lowest under acidic conditions and highest under neutral conditions. The AE of all groups under neutral conditions were 86% (R1), 88% (R2), 89% (R3) and 92% (R4). In comparison with neutral conditions, the AE of each experimental group decreased under alkaline conditions. The AE of mono-fermentation of HP decreased to 80%, and it declined to 79% (R2) and 74% (R3), respectively, in co-fermentation. It means although alkaline conditions conducive to the hydrolysis of lignocellulosic materials, it reduced the activity of acidogens which exhibit maximum activity at pH 5.5–6.5. In the mono-fermentation of HP, the alkaline conditions have proved to be more beneficial for the hydrolysis of substrate, while the neutral conditions could further facilitate the conversion of soluble organic matter to volatile acids. In addition, from the above conclusions, the main reasons for the decrease in VFAs yield of co-fermentation vs. mono-fermentation of HP were various for the different conditions assayed. For acidic conditions, lower pH caused weak hydrolysis capacity (sCOD) and acidification capacity (AE) for reducing acid productivity. In alkaline conditions, the recovery of methane production and the consumption of a large amount of sCOD were the main causes. Under neutral conditions, weak hydrolysis capacity led to a decrease in acid productivity.
3.3 Composition of VFAs
The composition of VFAs at maximum VFAs yield is shown in Fig. 5. The composition varied for different inhibition conditions of methanogenesis. Under acidic conditions, the mono-fermentation of FVW could obtain 84.6% lactic acid as the main metabolite. In the case of FVW, the pH dropped below 4 on the first day where the most likely metabolic pathway is lactic fermentation.38 In other experimental groups, the main metabolite was acetic acid with contents of 59.4% (R1), 55.2% (R2) and 52.7% (R3). The contents of propionic acid (18.2%) and butyric acid (17.8%) were similar in the mono-fermentation of HP. And the content of butyric acid rose with the increase of FVW ratio, reaching 33.5% (R2) and 40.1% (R3), while the content of propionic acid was reduced to below 10% in the co-fermentation group. Under alkaline conditions, the main metabolite was acetic acid which accounted for 86.0% to 93.8% of the total VFAs, while the contents of propionic acid and butyric acid were below 10.0%. There was no evidence for an impact of co-fermentation on metabolites. Jankowska et al. also found that alkaline conditions could promote a proportion of acetic acid by more than two times, in the case of the fermentation of sludge for acid production.39 Dahiya et al. reported that an improvement of alkaline conditions on the acetic acid content might be related to a phosphoroclastic reaction.40 But Omprakash Sarkar et al. found that a proportion of acetic acid only reached 60% when set initial pH as 10 and food waste as substrate.41 This difference may due to inoculum which could influence the microbiomes during fermentation. When BES was added, the composition of VFAs in each experimental group covered almost all types of acids. Acetic acid, propionic acid, and butyric acid remained as the main metabolites. The acetate content was more than 45% in all tests, while the propionate content from the mono-fermentation of HP reached 23.1% and the butyric acid contents of other groups attained about 30%. And the composition of VFAs from co-fermentation was closer to that from the mono-fermentation of FVW. All of this would indicate that the different methods for the inhibition of methanogens had a greater impact on the composition of VFAs, and could also be used as a technology for selective acid production.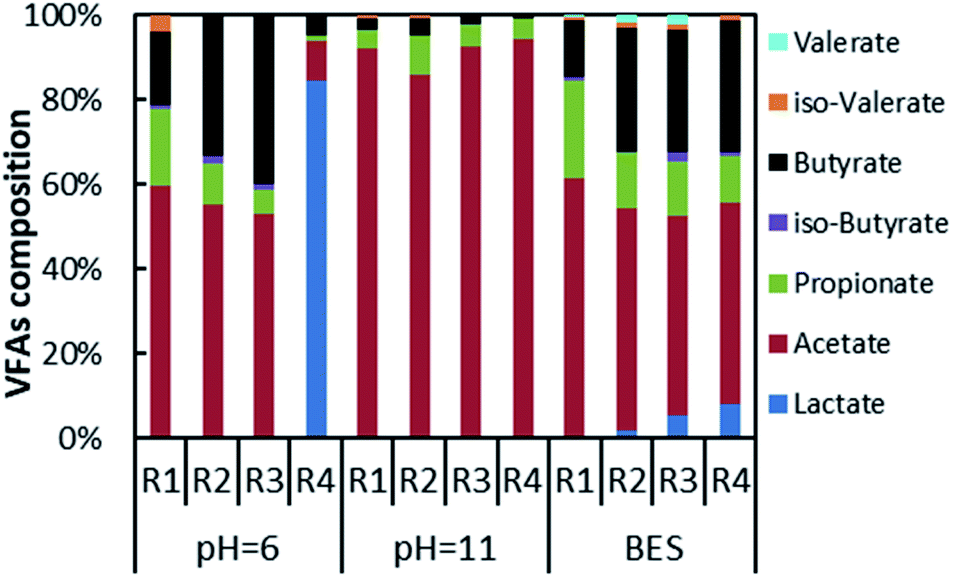 | ||
| Fig. 5 VFAs composition of different tests at various initial conditions. | ||
4. Conclusions
In this study, the influence of different ratios of HP to FVW on the production of VFAs was investigated under different methanogenic inhibition conditions. All methanogenesis inhibition methods used in this study can effectively inhibit methane generation in the early stage of fermentation. And VFAs can also be effectively accumulated, although the characteristics of VFAs production are different. The initial alkaline condition was favourable for VFAs generation from mono-fermentation of HP due to the enhanced hydrolysis. Co-fermentation with FVW can easily recover methane production under alkaline conditions, which leads to little difference in VFAs yield from neutral conditions. Although the VFAs yield of the co-fermentation is significantly decreased under all conditions, it can shorten the time to reach the maximum VFAs yield under alkaline and acidic conditions. Besides that, different initial conditions also have a greater impact on the composition of VFAs. The initial alkaline condition has better selectivity for acetate production. Better understanding of the impact of methanogenic inhibition conditions and co-fermentation on acidogenesis yields helps to develop industrially feasible volatile fatty acids production from different biomass streams.Conflicts of interest
There are no conflicts to declare.Acknowledgements
This work was supported by the National Natural Science Foundation of China (grant number 51808528), Strategic Priority Research Program of Chinese Academy of Sciences (grant number XDA21050400), National Key R&D Program of China (grant number 2018YFD0501405), Science and Technology Planning Project of Guangdong Province (grant number 2017B020238005), Science and Technology Program of Guangzhou (grant number 201803030007), Key Research and Development Project of Jiangxi Province (grant number S2017ZPYFE0339).References
- C. Sawatdeenarunat, K. C. Surendra, D. Takara, H. Oechsner and S. K. Khanal, Bioresour. Technol., 2015, 178, 178–186 CrossRef CAS.
- C. Sawatdeenarunat, D. Nguyen, K. C. Surendra, S. Shrestha, K. Rajendran, H. Oechsner, L. Xie and S. K. Khanal, Bioresour. Technol., 2016, 215, 304–313 CrossRef CAS.
- X. Ge, F. Xu and Y. Li, Bioresour. Technol., 2016, 205, 239–249 CrossRef CAS.
- S. K. Bhatia and Y.-H. Yang, Rev. Environ. Sci. Bio/Technol., 2017, 16, 327–345 CrossRef CAS.
- M. T. Agler, B. A. Wrenn, S. H. Zinder and L. T. Angenent, Trends Biotechnol., 2011, 29, 70–78 CrossRef CAS.
- N.-J. Kim, S.-J. Lim and a. N. Chang, Emerging Areas in Bioengineering, Wiley-VCH Verlag GmbH & Co. KGaA, Germany, 2018 Search PubMed.
- M.-P. Zacharof and R. W. Lovitt, Waste Biomass Valorization, 2013, 4, 557–581 CrossRef CAS.
- M. Atasoy, I. Owusu-Agyeman, E. Plaza and Z. Cetecioglu, Bioresour. Technol., 2018, 268, 773–786 CrossRef CAS.
- M. Zhou, B. Yan, J. W. C. Wong and Y. Zhang, Bioresour. Technol., 2018, 248, 68–78 CrossRef CAS.
- C. Li, J. Cao, H. Ren, Y. Li and S. Tang, Process Biochem., 2015, 50, 447–455 CrossRef CAS.
- L. T. Angenent, H. Richter, W. Buckel, C. M. Spirito, K. J. Steinbusch, C. M. Plugge, D. P. Strik, T. I. Grootscholten, C. J. Buisman and H. V. Hamelers, Environ. Sci. Technol., 2016, 50, 2796–2810 CrossRef CAS.
- L. Shen, H. Hu, H. Ji, J. Cai, N. He, Q. Li and Y. Wang, Bioresour. Technol., 2014, 166, 194–200 CrossRef CAS.
- X. Zheng, Y. Chen, X. Wang and J. Wu, Energy Procedia, 2017, 105, 1282–1288 CrossRef CAS.
- I. Baumann and P. Westermann, BioMed Res. Int., 2016, 2016, 1–15 CrossRef.
- D. Arslan, K. J. J. Steinbusch, L. Diels, H. V. M. Hamelers, D. P. B. T. B. Strik, C. J. N. Buisman and H. De Wever, Crit. Rev. Environ. Sci. Technol., 2016, 46, 592–634 CrossRef CAS.
- M. T. Holtzapple and C. B. Granda, Appl. Biochem. Biotechnol., 2009, 156, 95–106 CrossRef.
- Y. Yuan, S. Wang, Y. Liu, B. Li, B. Wang and Y. Peng, Bioresour. Technol., 2015, 197, 56–63 CrossRef CAS.
- Q. L. Wu, W. Q. Guo, S. S. Yang, H. C. Luo, S. M. Peng and N. Q. Ren, RSC Adv., 2015, 5, 103876–103883 RSC.
- W. Q. Guo, Q. L. Wu, S. S. Yang, H. C. Luo, S. M. Peng and N. Q. Ren, RSC Adv., 2014, 4, 53321–53326 RSC.
- C. Sawatdeenarunat, S. Sung and S. K. Khanal, Bioresour. Technol., 2017, 237, 139–145 CrossRef CAS.
- N.-J. Kim, G. W. Park, J. Kang, Y.-C. Kim and H. N. Chang, Biotechnol. Bioprocess Eng., 2014, 18, 1163–1168 CrossRef.
- A. Ping, T. Qihuan, X. Jiang, J. Hua, P. Jingjing and Y. Zhihao, Trans. Chin. Soc. Agric. Mach., 2018, 49, 309–316 Search PubMed.
- Y. Wang, G. Li, M. Chi, Y. Sun, J. Zhang, S. Jiang and Z. Cui, Bioresour. Technol., 2018, 250, 328–336 CrossRef CAS.
- V. Arelli, S. Begum, G. R. Anupoju, K. Kuruti and S. Shailaja, Bioresour. Technol., 2018, 253, 273–280 CrossRef CAS.
- S. H. Zinder, T. Anguish and S. C. Cardwell, Appl. Environ. Microbiol., 1984, 47, 1343–1345 CrossRef CAS.
- L. Li, X. Kong, F. Yang, D. Li, Z. Yuan and Y. Sun, Appl. Biochem. Biotechnol., 2012, 166, 1183–1191 CrossRef CAS.
- Y. Zhang, M. A. Alam, X. Kong, Z. Wang, L. Li, Y. Sun and Z. Yuan, J. Chem. Technol. Biotechnol., 2017, 92, 2392–2399 CrossRef CAS.
- J. Garcia-Aguirre, E. Aymerich, J. Gonzalez-Mtnez de Goni and M. Esteban-Gutierrez, Bioresour. Technol., 2017, 244, 1081–1088 CrossRef CAS.
- J. A. Eastman and J. F. Ferguson, J. - Water Pollut. Control Fed., 1981, 53(3), 352–366 CAS.
- W. Li, H. Khalid, Z. Zhu, R. Zhang, G. Liu, C. Chen and E. Thorin, Appl. Energy, 2018, 226, 1219–1228 CrossRef CAS.
- K. Wang, J. Yin, D. Shen and N. Li, Bioresour. Technol., 2014, 161, 395–401 CrossRef CAS.
- T. Amani, M. Nosrati and T. R. Sreekrishnan, Environ. Rev., 2010, 18, 255–278 CrossRef CAS.
- A. Romsaiyud, W. Songkasiri, A. Nopharatana and P. Chaiprasert, J. Environ. Sci., 2009, 21, 965–970 CrossRef CAS.
- I. Siegert and C. Banks, Process Biochem., 2005, 40, 3412–3418 CrossRef CAS.
- G. W. Park, I. Kim, K. Jung, C. Seo, J. I. Han, H. N. Chang and Y. C. Kim, Bioprocess Biosyst. Eng., 2015, 38, 1623–1627 CrossRef CAS.
- S. K. Park, H. M. Jang, J. H. Ha and J. M. Park, Bioresour. Technol., 2014, 162, 331–340 CrossRef CAS.
- J. Jiang, Y. Zhang, K. Li, Q. Wang, C. Gong and M. Li, Bioresour. Technol., 2013, 143, 525–530 CrossRef CAS.
- M. Zheng, M. Zheng, Y. Wu, H. Ma and K. Wang, Biotechnol. Bioprocess Eng., 2015, 20, 298–303 CrossRef CAS.
- E. Jankowska, J. Chwialkowska, M. Stodolny and P. Oleskowicz-Popiel, Bioresour. Technol., 2015, 190, 274–280 CrossRef CAS.
- S. Dahiya, O. Sarkar, Y. V. Swamy and S. Venkata Mohan, Bioresour. Technol., 2015, 182, 103–113 CrossRef CAS.
- O. Sarkar, A. N. Kumar, S. Dahiya, K. V. Krishna, D. K. Yeruva and S. V. Mohan, RSC Adv., 2016, 6, 18641–18653 RSC.
Footnote |
| † Electronic supplementary information (ESI) available. See DOI: 10.1039/d0ra04400h |
| This journal is © The Royal Society of Chemistry 2020 |