
 Open Access Article
 This Open Access Article is licensed under a Creative Commons Attribution-Non Commercial 3.0 Unported Licence
A near-infrared fluorescent probe with an improved Stokes shift achieved by tuning the donor–acceptor–donor character of the rhodamine skeleton and its applications†
Jin Gongab,
Chang Liua,
Xiaojie Jiaoa,
Song Hea,
Liancheng Zhaoab and
Xianshun Zeng *ab
*ab
aTianjin Key Laboratory for Photoelectric Materials and Devices, School of Materials Science & Engineering, Tianjin University of Technology, Tianjin, 300384, China. E-mail: xshzeng@tjut.edu.cn
bSchool of Materials Science and Engineering, Harbin Institute of Technology, Harbin, 150001, China
First published on 10th August 2020
Abstract
In this paper, we report a novel near-infrared (NIR) mitochondrion-targeted fluorescent probe, RQS, with an improved Stokes shift (96 nm) for the specific detection of mitochondrial mercury ion (Hg2+) because mitochondrion is one of the main targeted organelles of Hg2+. For the preparation of the probe, a novel asymmetrical fluorescent xanthene dye RQ was first synthesized by tuning the donor–acceptor–donor (D–A–D) character of the rhodamine skeleton, and then the probe RQS was constructed by the mechanism of mercury-promoted ring-opening reaction. As expected, RQS could be used for the specific detection of Hg2+ with high selectivity, high sensitivity, and a detection limit down to the nanomolar range (2 nM). Importantly, RQS is capable of specifically distributing in mitochondria, and thus detect Hg2+ in real-time and provided a potential tool for studying the cytotoxic mechanisms of Hg2+.
Introduction
Heavy metal pollution has received increasing attention because it can not only cause serious damage to the environment, but also cause extremely serious injuries to the human body.1 Mercury ion (Hg2+) is the most representative toxic metal of the numerous heavy metal ions, which is consumed directly and via the aggregation of the food chain.2 It has been reported that mitochondrion is one of the main targeted organelles of Hg2+,3 that causes serious physiological problems such as nervous system damage and cognitive disorder by denaturing proteins and inactivating enzymes.4 To date, although a large number of studies have been carried out by researchers,5 the mechanism of mitochondrial toxicity induced by Hg2+ has not been fully elucidated. It has been argued that the mitochondrial toxicity of Hg2+ is caused by its influence on the fluidity and permeability of the membrane, and the damage of the inner mitochondrial membrane is observed by transmission electron microscopy.5a,d However, transmission electron microscopy is not suitable for analyses in living cells.5d Therefore, the development of mitochondrion-targeted detection tools has practical significance for revealing the cytotoxic mechanism of Hg2+ in living cells.In recent years, the fluorescent probe imaging technology has been introduced for the detection of Hg2+ due to its high sensitivity, high selectivity, and non-invasive and real-time detection.6 In particular, derivatives of rhodamine have been widely designed and synthesized for the detection of Hg2+ due to their excellent water solubility, high quantum efficiency, high photo-stability, excellent water solubility and distinct photo-physical advantages of the ring-opening process.7 Upon the specific spirolactam-opening process, the non-fluorescent spirocyclic forms of rhodamine-based probes were converted irreversibly to the ring-opened high fluorescent species, resulting in highly sensitive “turn-on” detection of Hg2+.7b,f However, most of the reported rhodamine-based Hg2+ probes bear some drawbacks, for example, short emission wavelength (<600 nm) and narrow Stokes shifts (<30 nm), which limit their biological imaging applications.8 The development of probes capable of detecting Hg2+ in the near-infrared (NIR) region (>650 nm) is particularly important for imaging applications because it can avoid auto-fluorescence interference of biological backgrounds and reduce photo-damage to living samples.9 At the same time, fluorescent probes with large Stokes shifts can avoid self-quenching, excitation wavelength interference and poor signal-to-noise ratio, resulting in precise imaging and accurate sensing.10 In addition, number of Hg2+ probes suffer from high detection limit, slow response time and poor membrane permeability hampering their application in biological systems. Unfortunately, up to now, mitochondrion-targeting NIR fluorescent probes of rhodamine derivatives with large Stokes shifts were rarely described for the specific detection of Hg2+.6e Consequently, it is of great significance to develop new mitochondrion-targeted NIR fluorescent probes based on rhodamine scaffolds with large Stokes shifts, for sensing of Hg2+ at a subcellular level.
Changing the intramolecular charge transfer (ICT) properties of the π-conjugate, e.g. fine tuning the donor–acceptor–donor (D–A–D) character of the chromophore by changing the position of electron-donating groups on the chromophoric skeleton, is shown to be an efficient strategy to increase both the Stokes shifts and emission wavelengths.11 In 2013, Zhang and coworkers demonstrated that the emission wavelengths of rhodamine dyes are prominently red-shifted by using a 1,4-diethyl-1,2,3,4-tetrahydroquinoxaline unit as a strong electron-donating group to modify the xanthene moiety, increased with the Stokes shifts.12 In the past few years, we found that when the molecules were in an asymmetrical state, the Stokes shifts of them were largely increased (Scheme 1).11,13 These phenomena encouraged and inspired us to design probes with longer emission wavelengths and larger Stokes shifts by tuning the D–A–D character of rhodamine dyes. In addition, the cationic xanthene moiety normally works as a functional group for targeting mitochondria and increases the water solubility of the probe.14 Herein, a novel xanthene dye RQ with an NIR emission wavelength and a large Stokes shift was first prepared by introducing an electron-donating 1,4-diethylpiperazine moiety into the rhodamine scaffold, and then the probe RQS was constructed by the mechanism of well-known mercury-promoted ring-opening reaction.15 As expected, RQS is an outstanding “turn-on” fluorescent probe, and it can be used for the specific detection of Hg2+. Importantly, RQS is capable of specifically distributing in the mitochondria, and thus detect Hg2+ in real-time there, which provided a potential tool for studying the cytotoxic mechanisms of Hg2+. In the case of scarcity of NIR probes with large Stokes shifts for monitoring Hg2+ in mitochondria, this work is of great importance.
 | ||
| Scheme 1 Emission wavelength span, structures and absorption/emission data of examples of asymmetrical compounds and RQ. | ||
Results and discussion
Molecular synthesis
The synthetic procedures and methods for the dye RQ and the probe RQS are described in Scheme 2. The intermediate compounds 4-methoxy-1,2-phenylenediamine (1) and 1,4-diethyl-6-methoxy-1,2,3,4-tetrahydroquinoxaline (2) were synthesized according to the literature.12,15d By the reaction of 2-(4-diethylamino-2-hydroxybenzoyl)benzoic acid with 2, the dye RQ was obtained in 76% yield. With the reaction of RQ and oxalyl chloride in dry dichloromethane, followed by the treatment with excess Na2S saturated aqueous solution, the probe RQS was produced in 62% yield. The structures of the new compounds RQ and RQS were characterized by spectroscopic techniques, for example, 1H NMR, 13C NMR and HRMS, and the spectra are presented in the ESI (Fig. S1–S6†). | ||
| Scheme 2 Synthesis of RQ and RQS. Reagents and conditions: (a) CH3CN, 60 °C, 6 h; (b) NaBH4, CH3CO2H, dry toluene, 5 °C to reflux, 5 h; (c) 2-(4-diethylamino-2-hydroxybenzoyl)benzoic acid, methanesulfonic acid, 80 °C, overnight, 76%; (d) oxalyl chloride, dry dichloromethane, room temperature, 4 h; (e) saturated Na2S aqueous solution, room temperature, 10 h, 62%. | ||
Characterization of RQ
In order to verify whether RQ meets our original design intentions, a detailed evaluation of the photophysical properties of the dye RQ in distinct solvents (CH3CN, DCM, DMSO, EtOH, and H2O) was conducted. Surprisingly, the dye RQ showed the maxima absorption bands between 573 nm and 582 nm, and the maxima emission peaks of RQ range from 661 nm to 670 nm in all test solvents (Table S1 and Fig. S7†). RQ showed strong absorption but weak fluorescence in H2O, which might be due to the hydrogen-bonding interaction between water and dye molecules. Comparatively, RQ showed longer emission and a larger Stokes shift than traditional rhodamine dyes in ethanol (Table 1). The maximum fluorescence emission of the dye was remarkably red-shifted ca. 70 nm (rhodamine 101), 95 nm (rhodamine B), and 109 nm (rhodamine 6G) respectively, which may be attributed to the excited intramolecular charge transfer (ICT). Meanwhile, the Stokes shift of RQ was 88 nm in ethanol, which was significantly larger than rhodamine 101 (30 nm), rhodamine B (26 nm), and rhodamine 6G (28 nm). Importantly, the asymmetric dye RQ exhibited a longer emission wavelength and a larger Stokes shift than the dye Rh Q–H with a symmetric structure (Table 1).11 It can be rationalized that the change of the electron-donating 1,4-diethylpiperazine group in the asymmetric xanthene fluorophore can regulate the donor–acceptor–donor (D–A–D) character of the chromophore. The donor–acceptor system in plane from the electron-donating 1,4-diethylpiperazine group to the electron-withdrawing group in RQ can lead to large changes in the energy difference between the ground and the excited state, thereby producing an obviously increased Stokes shift.16 Furthermore, the quantum yields of RQ range from 7% to 33% in these solvents (Table S1†). Collectively, it proved that RQ is a novel NIR fluorescent reagent with a large Stokes shift, achieving original design intentions.| Dyes | λabs (nm) | λem (nm) | Δλ (nm) |
|---|---|---|---|
| Rhodamine 101 | 564 | 594 | 30 |
| Rhodamine B | 543 | 569 | 26 |
| Rhodamine 6G | 527 | 555 | 28 |
| Rh Q–H | 597 | 644 | 47 |
| RQ | 576 | 664 | 88 |
Fluorescence imaging of RQ in HeLa cells
The excellent optical properties, for example, NIR emission wavelength and improved Stokes shifts, encouraged us to evaluate the potential applications of RQ in living cells. As shown in Fig. S8,† the standard MTT assay confirmed that the dye RQ has extremely low cytotoxicity. Then, imaging experiments of RQ were conducted in living cells. After treatment with RQ (0.1 μM) for 30 minutes, a strong red fluorescence signal was observed, as shown in Fig. S9,† indicating that RQ is membrane permeable and can be used as an imaging reagent in living cells. Meanwhile, RQ tended to accumulate in one of the organelles. In order to investigate the localization characteristics of RQ, co-localization experiments were carried out using commercial targeting reagents Mito-Tracker Green (Mito), ER-Tracker Green (ER), Lyso-Tracker Green (Lyso), and Golgi-Tracker Green (Golgi). As shown in Fig. 1a, highlighted yellow pixels were observed on the overlapping image, and a high overlap coefficient (0.93) and Pearson's coefficient (0.93) could be calculated from the intensity correlation plot, suggesting that RQ was mainly accumulated in the mitochondria. In contrast, red fluorescence signals of RQ and green fluorescence signals of other targeting reagents (Lyso, ER, and Golgi) were obviously distributed in different organelles (Fig. 1b–d), and low overlap coefficients and Pearson's coefficients were also observed. Collectively, RQ is membrane permeable and can be used as an effective mitochondrion-targeting reagent.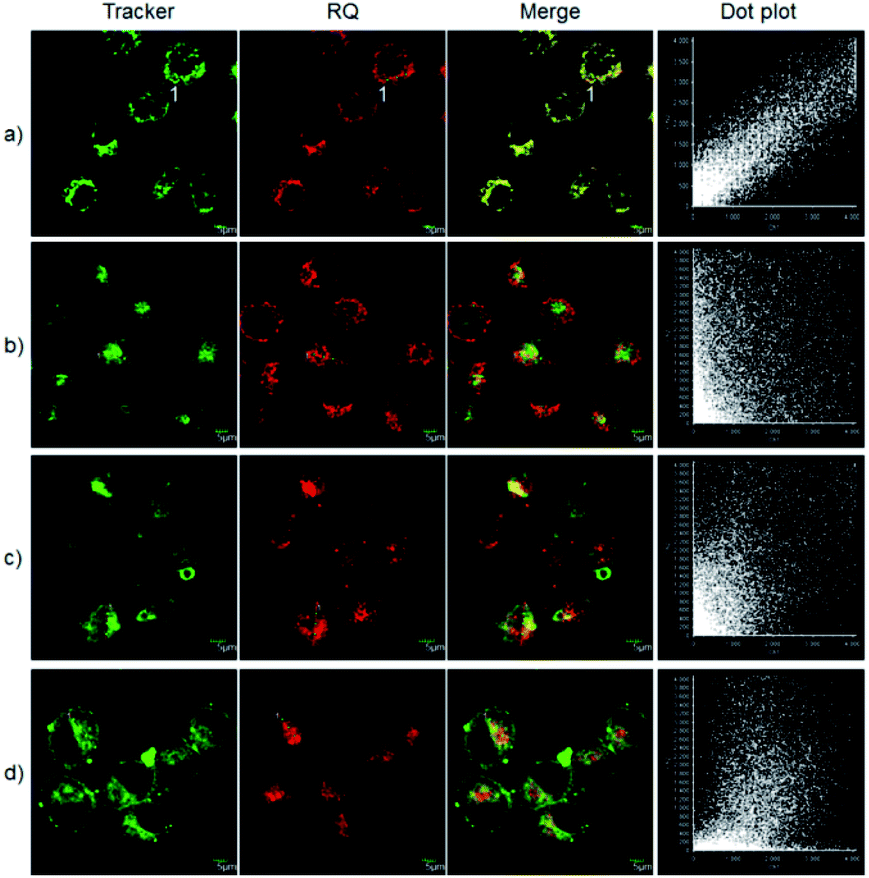 | ||
| Fig. 1 Co-localization experiments with HeLa cells stained with RQ (0.1 μM) and 200 nM targeting reagents (Lyso-Tracker Green (Lyso), Mito-Tracker Green (Mito), ER-Tracker Green (ER), and Golgi-Tracker Green (Golgi)): (a) costained with Mito; (b) costained with Lyso; (c) costained with Golgi; and (d) costained with ER. Red channel: λex = 559 nm, λem = 520–541 nm; green channel: λex = 488 nm, λem = 618–718 nm. | ||
Recognition properties of RQS
Since RQ possessed the unique spirocyclic/open-ring process of rhodamines that could be used as an effective platform in constructing fluorescent turn-on sensors, RQS was constructed by the well-known Hg2+-promoted ring-opening reaction.15 In order to assess the sensitivity of RQS towards Hg2+, we conducted continuous titration experiments by fluorescence spectroscopy. As shown in Fig. 2, upon addition of increasing concentrations of Hg2+ (0–2.0 equiv.) to the solution, the emission intensity gradually increased, and eventually reached the plateau when the amount of Hg2+ reached 2 equivalent. The emission intensity at 680 nm increased more than 87 times, and the linear fitting could be obtained between Hg2+ concentrations ranging from 0 to 16 μM and the emission intensity at 680 nm. Then, the detection limit of Hg2+ was obtained to be 2 nM based on the equation of 3σ/k, where k is the slope plotted from the fluorescence intensity at 680 nm versus the concentration of Hg2+, and σ is the relative standard deviation of 10 times fluorescence measurements of the blank solution in parallel. Compared with reported probes, the detection limit of RQS is at a low level, and the detailed data are listed in Table S2†. Simultaneously, the detection limit is far lower than the U.S. EPA's (Environmental Protection Agency) limit on drinking water (9.97 nM),17 suggesting that RQS could be used as a practical probe for the quantitative detection of Hg2+ in an aqueous environment.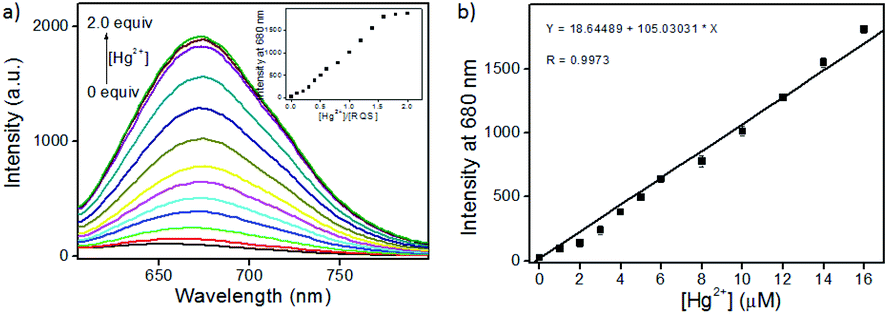 | ||
| Fig. 2 (a) Fluorescence changes of RQS (10 μM) treated with increasing concentrations of Hg2+ (0–20 μM). Inset: the plot of the fluorescence intensities at 680 nm versus the equivalents of Hg2+ and (b) the plot of the fluorescence intensities of RQS at 680 nm versus the concentrations of Hg2+ (0–16 μM). The conditions: HEPES buffer (10 mM, pH 7.4), λex = 585 nm, slit = 10/10 nm. | ||
Selectivity is also an important indicator of probe recognition ability, hence we then performed selective experiments by utilizing distinct metal ions that are generally available in surface water, such as Ag+, Al3+, Ca2+, Cd2+, Co2+, Cr3+, Cu2+, Fe2+, Fe3+, Hg2+, K+, Li+, Mg2+, Mn2+, Na+, Ni2+, Pb2+, Pd2+, and Zn2+. As shown in Fig. 3a and b, upon addition of different metal ions mentioned above, barring Hg2+, all other metal ions failed to induce significant changes in the absorption and emission spectra of RQS. For Hg2+, RQS rapidly showed a strong absorption band at 584 nm and a new enhanced emission band at 680 nm was observed, which could be attributed to the formation of a large π–π conjugated system through the Hg2+-promoted ring-opening reaction.15 Meanwhile, along with the spectral changes, the solution exhibited an obvious color change from colorless to blue in the presence of Hg2+ (Fig. S9†), which could be easily monitored by the naked eye. In contrast, insignificant changes in color were observed in the presence of other metal ions. The results revealed that RQS can function as a highly selective fluorescent probe for Hg2+.
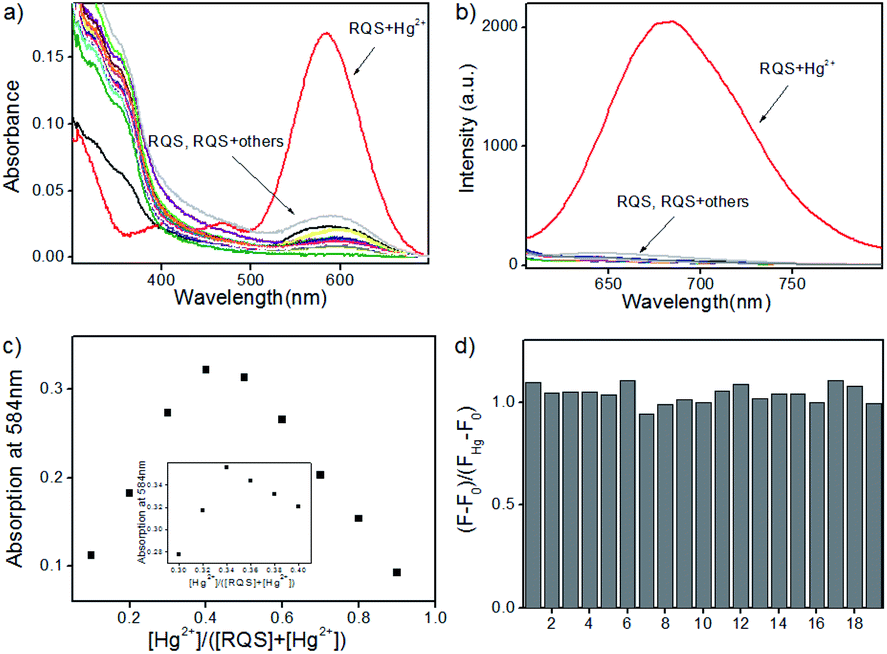 | ||
| Fig. 3 (a) Absorption and (b) fluorescence emission responses of RQS (10 μM) upon addition of different species; (c) Job's plot of RQS and Hg2+ in HEPES. The total concentration of RQS and Hg2+ was kept fixed at 30 μM. (d) Fluorescence ratio ((F − F0)/(FHg − F0)) changes of RQS in the presence of 20 μM Hg2+ and different species. Metal cations (20 μM): (1) Ag+; (2) Al3+; (3) Ca2+ (10 mM); (4) Cd2+; (5) Co2+; (6) Cr3+; (7) Cu2+; (8) Fe2+; (9) Fe3+; (10) Hg2+; (11) K+ (10 mM); (12) Li+ (10 mM); (13) Mg2+ (10 mM); (14) Mn2+; (15) Na+; (16) Ni2+; (17) Pb2+; (18) Pd2+; and (19) Zn2+. Conditions: HEPES buffer (10 mM, pH = 7.4), λex = 585 nm, slit = 10/10 nm. | ||
Subsequently, to verify the reaction mechanism, HRMS was carried out to analyze the molecular weight of the probe after the treatment with Hg2+. As shown in Fig. S11,† an intense peak at m/z 600.2150 corresponding to [RQS + Hg + RQS]2+ was observed, revealing that the open-ring process was triggered and the complex RQS-Hg-RQS was constructed between RQS and Hg2+ (Scheme 3). In addition, the stoichiometry between Hg2+ and RQS was confirmed by a Job's plot analysis, and the concentration ratio revealed a 2![[thin space (1/6-em)]](https://www.rsc.org/images/entities/char_2009.gif) :1 stoichiometric ratio between RQS and Hg2+ (Fig. 3c). Meanwhile, a mass peak at m/z 734.1644 corresponding to [RQS + HgCl]+ was clearly observed, and then the complex RQS-Hg can be further hydrolyzed to RQ (m/z 484.2600). In order to further evaluate the selectivity of RQS in the presence of interfering metal cations, competition experiments were conducted. The responses of RQS toward Hg2+ in the presence of coexistent potentially interfering metal ions (Ag+, Al3+, Ca2+, Cd2+, Co2+, Cr3+, Cu2+, Fe2+, Fe3+, K+, Li+, Mg2+, Mn2+, Na+, Ni2+, Pb2+, Pd2+, and Zn2+) were tested and recorded under the same conditions. As shown in Fig. 3d, the results of competition experiments revealed that the emission spectral change observed for RQS on binding to Hg2+ remained minor, or no interference was observed in the presence of all other metal ions, confirming the specificity of RQS toward Hg2+.
:1 stoichiometric ratio between RQS and Hg2+ (Fig. 3c). Meanwhile, a mass peak at m/z 734.1644 corresponding to [RQS + HgCl]+ was clearly observed, and then the complex RQS-Hg can be further hydrolyzed to RQ (m/z 484.2600). In order to further evaluate the selectivity of RQS in the presence of interfering metal cations, competition experiments were conducted. The responses of RQS toward Hg2+ in the presence of coexistent potentially interfering metal ions (Ag+, Al3+, Ca2+, Cd2+, Co2+, Cr3+, Cu2+, Fe2+, Fe3+, K+, Li+, Mg2+, Mn2+, Na+, Ni2+, Pb2+, Pd2+, and Zn2+) were tested and recorded under the same conditions. As shown in Fig. 3d, the results of competition experiments revealed that the emission spectral change observed for RQS on binding to Hg2+ remained minor, or no interference was observed in the presence of all other metal ions, confirming the specificity of RQS toward Hg2+.
 | ||
| Scheme 3 Proposed reaction mode between RQS and Hg2+. | ||
In order to evaluate whether RQS was suitable for detecting Hg2+ in a physiological environment, the emission spectra of RQS at different pH values were recorded. The pH-dependent fluorescence responses of RQS in the absence and presence of Hg2+ are presented in Fig. S12.† In the absence of Hg2+, RQS exhibited almost no obvious change in the fluorescence intensity at 680 nm in the pH range of 4.0–10.0, suggesting that the probe is stable in a wide pH region. However, in the presence of Hg2+, the fluorescence intensity at 680 nm was obviously enhanced in the pH range of 4.0–9.0 for the formation of a large π-conjugated system, implying that RQS could be used to detect Hg2+ under physiological conditions. At the same time, time-dependent fluorescence responses of RQS in the absence and presence of Hg2+ were analyzed at room temperature to evaluate whether the probe can be used to monitor Hg2+ in real time. The spectral data were recorded within 300 s after the addition of Hg2+. As shown in Fig. S13,† in the absence of Hg2+, the emission intensity of RQS at 680 nm remained substantially constant, suggesting that RQS owned high photo-stability. In contrast, upon addition of 10 equiv. of Hg2+, the emission intensity of RQS at 680 nm rapidly increased and reached a plateau within about 100 s, implying that RQS can be used as an effective candidate for monitoring Hg2+ in real time. The above-mentioned results indicated that RQS was able to sense trace amounts of Hg2+ in real time in physiological environments.
Fluorescence imaging of RQS in HeLa cells
The excellent spectral properties, for example, high selectivity, high sensitivity, and fast response time, encouraged us to assess the potential applications of RQS for imaging Hg2+ in living cells. To examine the feasibility of using RQS as an imaging reagent to map the cellular uptake of Hg2+, the cytotoxicity of the probe to HeLa cells was assessed by the well-established MTT assay. HeLa cells were treated with different concentrations of RQS (0, 1, 3, 5, 10, and 20 μM) for 24 h, 48 h and 72 h, respectively. As shown in Fig. S14,† more than 70% of cells survived, suggesting extremely low cytotoxicity of RQS, and thus, RQS is suitable as an imaging reagent. Subsequently, imaging experiments of RQS for monitoring Hg2+ in living cells were conducted. HeLa cells were incubated with RQS (0.1 μM) for 30 min and then washed with PBS for removing excess and surface-adhered reagents. As shown in Fig. 4a, weak red fluorescence signals in the red channel were observed, revealing the extremely low background of RQS. In contrast, an obvious enhancement in red fluorescence signals was observed after treatment with Hg2+ (0.5 μM) for 30 min (Fig. 4b). Compared with the controlled cells, the relative enhancement of fluorescence signals is about 75-fold (Fig. 4c). The results indicated that RQS was membrane permeable and could be used for imaging Hg2+ in living cells.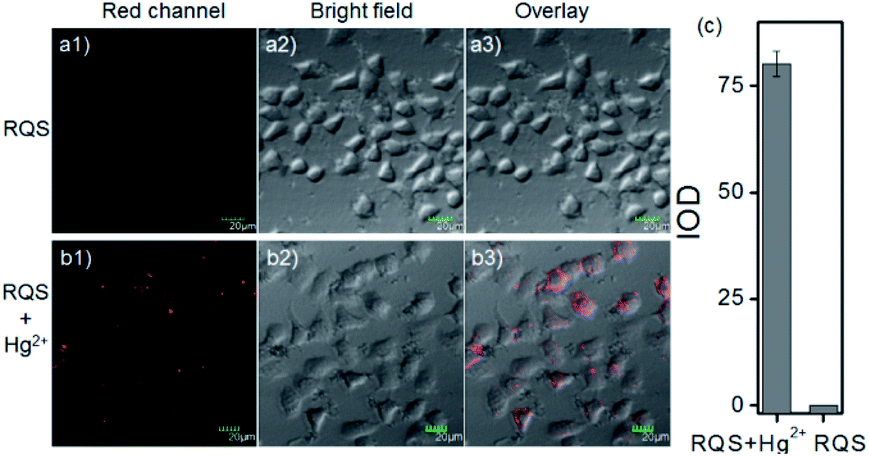 | ||
| Fig. 4 Fluorescence images of HeLa cells (a1–a3) incubated with RQS (0.1 μM) for 30 min and (b1–b3) further incubated with Hg2+ (0.5 μM) for 30 min. (c) Histogram of fluorescence enhancement. λex = 559 nm and λem = 613–713 nm. | ||
In order to verify whether RQS possesses mitochondrial localization properties, commercial targeting reagents Mito-Tracker Green (Mito) and Lyso-Tracker Green (Lyso) were utilized to study the localization characteristics of RQS. As expected, highlighted yellow pixels on overlapping images were observed in Fig. 5a, and a high overlap coefficient (0.93) and Pearson's coefficient (0.93) could be calculated from the intensity correlation plot, suggesting that RQS was mainly distributed in the mitochondria. In contrast, red fluorescence signals of RQS and green fluorescence signals of Lyso were distinctly distributed in different regions, and a low overlap coefficient (0.43) and Pearson's coefficient (0.44) were observed in Fig. 5b. Co-localization experiments confirmed that RQS can be used as an effective mitochondrion-targeting probe for imaging Hg2+ in living cells. Taken together, considering a series of excellent spectral properties and mitochondrial localization properties, RQS can potentially be used to explore the mechanism of mitochondrial toxicity of Hg2+ in the next research work. In the case of scarcity of NIR probes with large Stokes shifts for monitoring Hg2+ in mitochondria, this work is of great importance.
 | ||
| Fig. 5 Fluorescence imaging of Hg2+-pretreated HeLa cells costained with RQS (0.1 μM) and other organelle-targeting trackers (200 nM): (a) costained with Mito-Tracker Green and (b) costained with Lyso-Tracker Green. Red channel: λex = 559 nm, λem = 618–718 nm; green channel: λex = 488 nm, λem = 520–541 nm. | ||
Conclusions
In summary, we reported a novel mitochondrion-targeted NIR probe, RQS, with a large Stokes shift by tuning the D–A–D character of the rhodamine framework. As expected, RQS can be used for the specific detection of Hg2+ with multiple excellent properties such as high selectivity, high sensitivity, and a detection limit down to the nanomolar range (2 nM). Importantly, RQS showed specific distribution in mitochondrial regions, and it can potentially be utilized to explore the mechanism of mitochondrial toxicity of Hg2+ in the next research work.Experimental
Instruments and reagents
All reagents and organic solvents were commercially available and of analytical grade, and were used directly without further purification unless otherwise stated. Compound structures were characterized by NMR and HRMS spectrometry. 1H NMR (400 MHz) and 13C NMR (100 MHz) spectra were recorded using a Bruker spectrometer with tetramethylsilane (TMS) as an internal standard. An Agilent 6510 Q-TOF LC/MS instrument (Agilent Technologies, Palo Alto, CA) was used to measure the molecular mass. A F-4600 fluorescence spectrophotometer (Hitachi Japan) and a UV-2550 UV/Vis spectrophotometer (Hitachi Japan) were used to study the spectroscopic properties. The pH was measured using a FE 20/EL 20 pH meter (Mettler-Toledo Instruments (Shanghai) Co., Ltd.). Fluorescence imaging was carried out using an Olympus FV 1000-IX81 confocal laser scanning microscope.Synthesis 1 and 2. In this work, 4-methoxy-1,2-phenylenediamine (1) and 1,4-diethyl-6-methoxy-1,2,3,4-tetrahydroquinoxaline (2) were synthesized according to the method reported in the literature.12,18
Synthesis of RQ. First, 2-(4-diethylamino-2-hydroxybenzoyl)benzoic acid (688.6 mg, 2.2 mmol) and 2 (440 mg, 2 mmol) were stirred in methanesulfonic acid (6 mL) at 80 °C overnight. After cooling to room temperature, the mixture was extracted with DCM (50 mL × 3), and the collected organic layers were dried over anhydrous NaSO4. After removing solvents, the crude product was purified by column chromatography (DCM/MeOH = 15
:1 to 6:1) to afford compound RQ as a blue solid (736 mg, 76%). 1H NMR (400 MHz, CDCl3) δ 8.13 (d, J = 6.9 Hz, 1H), 7.53 (p, J = 7.1 Hz, 2H), 7.13 (d, J = 6.8 Hz, 1H), 6.81 (d, J = 9.0 Hz, 1H), 6.51–6.46 (m, 3H), 5.86 (s, 1H), 3.52–3.43 (m, 4H), 3.40 (dd, J = 14.1, 7.0 Hz, 4H), 3.17 (dd, J = 8.4, 4.4 Hz, 2H), 3.02 (td, J = 14.1, 7.0 Hz, 1H), 2.92 (td, J = 14.2, 7.1 Hz, 1H), 1.23 (t, J = 7.1 Hz, 3H), 1.18 (t, J = 7.1 Hz, 6H), 0.86 (t, J = 7.0 Hz, 3H). 13C NMR (100 MHz, CDCl3) δ 165.63, 155.98, 154.65, 153.41, 153.22, 148.15, 135.06, 134.51, 132.99, 131.14, 130.30, 130.13, 130.01, 129.54, 115.38, 113.39, 113.19, 102.42, 96.05, 94.75, 54.22, 52.50, 48.31, 47.68, 45.59, 15.52, 44.04, 12.57, 11.12, 9.16. HRMS m/z = 484.2600 calcd for C30H34N3O3+ [M]+, found: 484.2599.
Synthesis of RQS. Under stirring at room temperature, oxalyl chloride (381 mg, 3 mmol) was added dropwise to the dichloromethane (10 mL) solution of RQ (484 mg, 1 mmol). After being stirred for 4 h, the reaction mixture was concentrated under vacuum to give acid chloride. Then, 3 mL of saturated Na2S aqueous solution (25 mmol) was added to the crude acid chloride and the mixture was stirred for 10 h at room temperature. The mixture was extracted with EtOAc (50 mL × 3) and the collected organic layers were dried over anhydrous NaSO4. After removing solvents, the crude product was purified by column chromatography (DCM/petroleum ether = 1
:1 to 2:1) to afford compound RQS as a pale yellow solid (309 mg, 62%). 1H NMR (400 MHz, CDCl3) δ 7.85 (d, J = 7.6 Hz, 1H), 7.51 (t, J = 7.4 Hz, 1H), 7.43 (t, J = 7.4 Hz, 1H), 7.22 (d, J = 7.7 Hz, 1H), 6.72 (d, J = 8.4 Hz, 1H), 6.33–6.23 (m, 3H), 5.89 (s, 1H), 3.35–3.30 (m, 8H), 3.15 (s, 2H), 3.03–2.91 (m, 2H), 1.21–1.13 (m, 9H), 0.84 (t, J = 6.9 Hz, 3H). 13C NMR (100 MHz, CDCl3) δ 198.18, 158.31, 152.48, 148.30, 144.52, 136.96, 135.47, 134.16, 131.43, 130.01, 128.05, 127.35, 122.44, 109.75, 108.15, 108.15, 107.97, 97.45, 97.10, 63.81, 46.79, 45.82, 45.42, 44.38, 12.70, 12.66, 10.41, 10.37, 9.48, 9.45. HRMS m/z = 500.2372 calcd for C30H34N3O2S+ [M + H]+, found: 500.2399.
Cell culture and fluorescence imaging
The HeLa cell line (human cervical cancer cells) was obtained from Beijing Dingguo Changsheng Biotechnology Co. Ltd. Reagents and media for the experiments were purchased from Sigma-Aldrich Chemical Company and the Beyotime Institute of Biotechnology. HeLa cells for imaging were cultured in a DMEM medium supplemented with 10% (v/v) fetal bovine serum and penicillin/streptomycin (100 μg mL−1) in an atmosphere of 5% CO2 at 37 °C. The cells were seeded at a density of 1 × 10⁶ cells per mL for imaging on 24-well plates and allowed to adhere for 12 h. HeLa cells were incubated with RQ (1 μM) for 30 minutes and with RQS (0.1 μM) for 30 minutes, and then Hg2+ (0.5 μM) was added and incubated for another 30 minutes. For co-localization experiments, RQ (100 nM) was incubated with 200 nM trackers (Mito-Tracker Green (Mito), Golgi-Tracker Green (Golgi), ER-Tracker Green (ER), and Lyso-Tracker Green (Lyso)) for 30 minutes, respectively; RQS (100 nM) were incubated with 200 nM trackers (Mito and Lyso) for 30 minutes, respectively, and then treated with Hg2+ (500 nM) for another 30 min. Fluorescence imaging was performed after washing the medium three times with PBS.Conflicts of interest
There are no conflicts to declare.Acknowledgements
This work was sponsored by the Natural Science Foundation of China (NNSFC 21907075; 21272172), and the Natural Science Foundation of Tianjin City (19JCZDJC32400; 18JCQNJC75900).Notes and references
- (a) Q. Sun, B. Aguila, J. Perman, L. D. Earl, C. W. Abney, Y. Cheng, H. Wei, N. Nguyen, L. Wojtas and S. Ma, J. Am. Chem. Soc., 2017, 139, 2786 CrossRef CAS PubMed; (b) D. Banerjee, D. Kim, M. J. Schweiger, A. A. Kruger and P. K. Thallapally, Chem. Soc. Rev., 2016, 45, 2724 RSC; (c) H. N. Kim, W. X. Ren, J. S. Kim and J. Yoon, Chem. Soc. Rev., 2012, 41, 3210 RSC.
- (a) A. Renzoni, F. Zino and E. Franchi, Environ. Res., 1998, 77, 68 CrossRef CAS PubMed; (b) D. W. Boening, Chemosphere, 2000, 40, 1335 CrossRef CAS PubMed.
- (a) A. C. Santos, S. A. Uyemura, N. A. G. Santos, F. E. Mingatto and C. Curti, Mol. Cell. Biochem., 1997, 177, 53 CrossRef CAS PubMed; (b) J. M. Weinberg, P. G. Harding and H. D. Humes, J. Biol. Chem., 1982, 257, 60 CAS.
- (a) H. H. Harris, I. J. Pickering and G. N. George, Science, 2003, 301, 1203 CrossRef CAS PubMed; (b) N. Huang, L. Zhai, H. Xu and D. Jiang, J. Am. Chem. Soc., 2017, 139, 2428 CrossRef CAS PubMed; (c) T. W. Clarkson, L. Magos and G. J. N. Myers, N. Engl. J. Med., 2003, 349, 1731 CrossRef CAS PubMed.
- (a) M. Königsberg, N. E. López-Díazguerrero, L. Bucio and M. C. Gutierrez-Ruiz, J. Appl. Toxicol., 2001, 21, 323 CrossRef PubMed; (b) E. A. Belyaeva, D. Dymkowska, M. R. Wieckowski and L. Wojtczak, Toxicol. Appl. Pharmacol., 2008, 231, 34 CrossRef CAS PubMed; (c) J. H. Southard and P. Nitisewojo, Biochem. Biophys. Res. Commun., 1973, 52, 921 CrossRef CAS PubMed; (d) J. R. Brawer, G. F. McCarthy, M. Gornitsky, D. Frankel, K. Mehindate and H. M. Schipper, Neurotoxicology, 1998, 19, 767 CAS.
- (a) J. Du, M. Hu, J. Fan and X. Peng, Chem. Soc. Rev., 2012, 41, 4511 RSC; (b) X. Li, X. Gao, W. Shi and H. Ma, Chem. Rev., 2013, 114, 590 CrossRef PubMed; (c) K. P. Carter, A. M. Young and A. E. Palmer, Chem. Rev., 2014, 114, 4564 CrossRef CAS PubMed; (d) M. Taki, K. Akaoka, S. Iyoshi and Y. Yamamoto, Inorg. Chem., 2012, 51, 13075 CrossRef CAS PubMed; (e) J. Chen, W. Liu, B. Zhou, G. Niu, H. Zhang, J. Wu, Y. Wang, W. Ju and P. Wang, J. Org. Chem., 2013, 78, 6121 CrossRef CAS PubMed; (f) H. Agarwalla, P. S. Mahajan, D. Sahu, N. Taye, B. Ganguly, S. B. Mhaske, S. Chattopadhyay and A. Das, Inorg. Chem., 2016, 55, 12052 CrossRef CAS PubMed.
- (a) Y. Sun, J. Liu, X. Lv, Y. Liu, Y. Zhao and W. Guo, Angew. Chem., Int. Ed., 2012, 51, 7634 CrossRef CAS PubMed; (b) L. Yuan, W. Lin, K. Zheng, L. He and W. Huang, Chem. Soc. Rev., 2013, 42, 622 RSC; (c) J. Zhou and H. Ma, Chem. Sci., 2016, 7, 6309 RSC; (d) B. Biswal, D. Mallick and B. Bag, Org. Biomol. Chem., 2016, 14, 2241 RSC; (e) M. Zhang, X. Liu, Y. Bao and B. Yang, Tetrahedron, 2016, 72, 328 CrossRef CAS; (f) C. Liu, X. Jiao, Q. Wang, K. Huang, S. He, L. Zhao and X. Zeng, Chem. Commun., 2017, 53, 10727 RSC; (g) W. Piao, K. Hanaoka, T. Fujisawa, S. Takeuchi, T. Komatsu, T. Ueno, T. Terai, T. Tahara, T. Nagano and Y. Urano, J. Am. Chem. Soc., 2017, 139, 13713 CrossRef CAS PubMed; (h) M. Deng, D. Gong, S. Han, X. Zhu, A. Lqbal, W. Liu, W. Qin and H. Guo, Sens. Actuators, B, 2017, 243, 195 CrossRef CAS; (i) P. E. Hande, A. B. Samui and P. S. Kulkarni, Sens. Actuators, B, 2017, 246, 597 CrossRef CAS.
- (a) W. Duan, Y. Han, Q. Liu, J. Cui, S. Gong, Y. Ma, C. Zhang and Z. Sun, Tetrahedron Lett., 2017, 58, 271 CrossRef CAS; (b) J. Tao, X. Wang, X. Chen, T. Li, Q. Diao, H. Yu and T. Wang, Dyes Pigm., 2017, 137, 601 CrossRef CAS.
- (a) Z. Q. Guo, S. Park, J. Yoon and I. Shin, Chem. Soc. Rev., 2014, 43, 16 RSC; (b) R. Weissleder and V. Ntziachristos, Nat. Med., 2003, 9, 123 CrossRef CAS PubMed.
- (a) H. Zhu, J. Fan, B. Wang and X. Peng, Chem. Soc. Rev., 2015, 44, 4337 RSC; (b) B. Kaur, N. Kaur and S. Kumar, Coord. Chem. Rev., 2018, 358, 13 CrossRef CAS.
- T. Ren, W. Xu, W. Zhang, X. Zhang, Z. Wang, Z. Xiang, L. Yuan and X. Zhang, J. Am. Chem. Soc., 2018, 140, 7716 CrossRef CAS PubMed.
- Z. Tian, B. Tian and J. Zhang, Dyes Pigm., 2013, 99, 1132 CrossRef CAS.
- (a) J. Qin, H. Yao, S. He and X. Zeng, RSC Adv., 2016, 6, 75570 RSC; (b) X. Jiao, C. Liu, K. Huang, S. Zhang, S. He, L. Zhao and X. Zeng, Org. Biomol. Chem., 2015, 13, 6647 RSC; (c) P. Verwilst, J. Han, J. Lee, S. Mun, H. G. Kang and J. S. Kim, Biomaterials, 2017, 115, 104 CrossRef CAS PubMed; (d) K. Huang, S. He and X. Zeng, Tetrahedron Lett., 2017, 58, 2004 CrossRef CAS.
- Y. K. Kim, H. H. Ha, J. S. Lee, X. Bi, Y. H. Ahn, S. Hajar, J. J. Lee and Y. T. Chang, J. Am. Chem. Soc., 2010, 132, 576 CrossRef CAS PubMed.
- (a) W. Shi and H. Ma, Chem. Commun., 2008, 16, 1856 RSC; (b) J. Liu, D. Wu, X. Yan and Y. Guan, Talanta, 2013, 116, 563 CrossRef CAS PubMed; (c) X. Zhan, Z. Qian, H. Zheng, B. Su, Z. Lan and J. Xu, Chem. Commun., 2008, 16, 1859 RSC; (d) X. Q. Chen, S. W. Nam, M. J. Jou, Y. Kim, S. J. Kim, S. Park and J. Y. Yoon, Org. Lett., 2008, 10, 5235 CrossRef CAS PubMed; (e) L. Cui, W. Shi, J. Wang, Y. Song, H. Ma and L. Jiang, Anal. Methods, 2010, 2, 448 RSC.
- F. Vollmer, W. Rettig and E. Birckner, J. Fluoresc., 1994, 4, 65 CrossRef CAS PubMed.
- Mercury Update: Impact of Fish Advisories, EPA Fact Sheet EPA-823-F-01-011, EPA, Office of Water, Washington, DC, 2001 Search PubMed.
- A. R. Jagtap, V. S. Satam, R. N. Rajule and V. R. Kanetkar, Dyes Pigm., 2009, 82, 84 CrossRef CAS.
Footnote |
| † Electronic supplementary information (ESI) available. See DOI: 10.1039/d0ra04373g |
| This journal is © The Royal Society of Chemistry 2020 |