 Open Access Article
Creative Commons Attribution 3.0 Unported Licence
Multicomponent gas separation and purification using advanced 2D carbonaceous nanomaterials†
Sayyed Jalil Mahdizadeh *ab and
Elaheh K. Goharshadib
aDepartment of Chemistry and Molecular Biology, University of Gothenburg, 405 30 Göteborg, Sweden. E-mail: sayyed.jalil.mahdizadeh@gu.se
bDepartment of Chemistry, Ferdowsi University of Mashhad, Mashhad 9177948974, Iran
First published on 25th June 2020
Abstract
Multicomponent gas separation and purification is an important pre- or post-processing step in industry. Herein, we employed a multiscale computational approach to investigate the possibility of multicomponent low-weight gas (H2, O2, N2, CO2, CH4) separation and purification using novel porous 2D carbonaceous nanomaterials, namely Graphdiyne (GD), Graphenylene (GN), and Rhombic-Graphyne (RG). The dispersion-corrected plane-wave density functional theory (DFT) calculation combined with the Climbing Image Nudged Elastic Band (CI-NEB) method was employed to study the gas/membrane interaction energy and diffusion barrier of different gases passing through the geometrically optimized membranes. The results from CI-NEB calculations were then fitted to the Morse potential function to construct a bridge between quantum mechanics calculations and non-equilibrium molecular dynamics (NEMD) simulation. The selectivity of each membrane for all binary mixtures was calculated using the estimated diffusion energy barriers based on the Arrhenius equation. Finally, a series of extensive NEMD simulations were carried out to evaluate the real word and time dependent separation process. According to the results, CH4 molecules can be completely separated from the other gases using a GD membrane, O2 molecules from CH4, N2, and CO2 by a GN membrane, and H2 molecules from all other gases using a RG membrane.
Introduction
Multicomponent gas separation and purification is a vital pre- or post-processing step in many applications from large scale industrial ones to laboratorial low scale experiments.1 From the practical point of view, the efficient separation of low weight gases (H2, O2, N2, CO2, CH4) is of great significance because many of the light gases are feeds for many industrial processes.1 For instance, H2 can be separated from the other ingredients of syngas (CO and CO2) to employ it as a green energy carrier with zero environmental footprint.2 O2 separation from the air is strongly encouraged by exponentially increasing demands in medical and industrial sectors.3 CO2 is one of the most significant greenhouse gases that is emitted to the Earth's atmosphere as a consequence of the world's dependence on fossil fuels which leads to severe climate changes and global warming.2 Therefore, CO2 capture, separation, and recycling from the combustion products of fossil fuels have great advantages for environment and related industries.4 In natural gas sweetening process, CH4 molecules separate from other contaminants such as CO2 and H2S.5 N2 is an important gas which is widely used as inert atmosphere in air-sensitive chemical reactions and cooling media because of its suitably low boiling point (77.3 K).6Among various gas separation methods, membrane technique provides several advantages such as high energy efficiency, facile operation, easy maintenance, and low investment cost.7 The membrane separation is typically referred to separation technology based on a semipermeable or selective membrane.2,8 The membrane performance in a gas separation process is basically determined with two parameters, selectivity and permeability. Selectivity is the capability of a membrane to selectively separate a desired molecule from a mixture. Whereas, permeability shows the membrane's productivity per unit time.9 An ideal membrane, for gas separation purposes, should have a low diffusion barrier for a specific type of molecule (permeability) and high diffusion barrier for other components within the gas mixture (selectivity). Apparently, a membrane with high selectivity usually suffers from low permeability, and vice versa.10 Therefore, there is always an intercommunication between selectivity and permeability of a membrane.
Traditional membranes for gas separation, like polymers,11 metals,12 zeolites,13 silica,14 and metal organic frameworks15 do not possess both high permeability and selectivity. Carbonaceous materials can be considered as very promising membranes in gas separation processes, since carbon is an abundant element and its allotrope's production techniques have been widely evaluated.9 It has been proven that the membrane permeability inversely correlates with its thickness.16 Therefore, porous 2D graphene-based nanomaterials, with one-atom thickness, have fascinated a great attention as efficient membranes for gas and liquid separation and purification processes.17–21
The pristine graphene is totally impermeable to any kind of gases even tiny He molecules.22 Hence, making in-plane pores in graphene sheets is necessary to attain molecular permeability. However, carving perfect and precise nanopores at large density level on a graphene sheet is extremely tricky and needs advanced breakthroughs in nano-scale manufacturing technologies.23 Therefore, finding novel 2D membranes with intrinsic uniform nanopores with specific architecture is essential as an alternative route. Graphenylene is an interesting allotrope of graphene with all the sp2-hybridized carbon atoms which was firstly suggested by Balaban et al.24 Graphenylene has attracted a great attention because of its thermal and mechanical stability and especially periodic unique pore architecture.25–27 Recently, some research groups could successfully synthesize graphenylene.3,28 Similar to graphene and graphenylene with purely sp2-hybridized network, other advanced 2D carbonaceous nanomaterials with successive sp2- sp-hybridized carbon atoms have been hypothesized theoretically.29 For example, the graphyne family can be built by replacing 1/3 of C–C bonds in graphene with n-acetylene linkages (–C![[triple bond, length as m-dash]](https://www.rsc.org/images/entities/char_e002.gif) C–) (n = 1, 2, 3, …) which would produce graphyne, graphyne-2 (graphdiyne), graphyne-3, etc., respectively.30 Interestingly, some experimental techniques have been employed to successfully produce graphynes family.31–33 On the other hand, replacement of 2/3 of C–C bonds in graphene with acetylene linkage will produce a new 2D layered carbon allotrope called rhombic-graphyne.34
C–) (n = 1, 2, 3, …) which would produce graphyne, graphyne-2 (graphdiyne), graphyne-3, etc., respectively.30 Interestingly, some experimental techniques have been employed to successfully produce graphynes family.31–33 On the other hand, replacement of 2/3 of C–C bonds in graphene with acetylene linkage will produce a new 2D layered carbon allotrope called rhombic-graphyne.34
Due to the precise and uniform pore structure of these 2D nanomaterials, they are considered as promising ideal membrane for gas separation and purification.35 Jiao et al.36 evaluated the potential application of graphdiyne as membrane to separate H2 from syngas. According to their findings, graphdiyne shows a H2 permeability about 104 times greater than that of porous graphene. Zhao et al.37 investigated the selective separation of different light gases by H-, O-, and F-substituted graphdiyne using computational approaches. They found that O- and F-substituted graphdiyne could efficiently separate CH4 and N2 gases. Cranford et al.38 estimated the flux of H2 passing through the graphdiyne membrane to be 7–10 g cm−2 s−1 from a gas mixture containing CH4 and CO molecules. Employing the first principle calculations, Zhang35 studied the H2 separation features of graphynes family over light gas molecules (e.g. CH4, N2, CO). According to their results, graphyne was not a suitable membrane for H2 separation because of its small pore size. However, graphdiyne demonstrated a high selectivity for H2 molecules (109) over bigger molecules like CH4 but relatively low selectivity (103) over smaller molecules. In addition, they showed that rhombo-graphyne has an extremely high selectivity for H2 molecules (1016) over other light gases. Zhang et al.39 showed that some graphyne derivatives, with pore sizes of 7 × 8 Å, could effectively blocks both di-branched and mono-branched pentane isomers. Using the dispersion-corrected DFT calculations, Zhu et al.1 estimated the separation performance of light gas mixtures via strained-control graphenylene. Their results indicated that applying lateral strain has a notable impact on the separation performance and selectivity of graphenylene membrane.
Herein, using dispersion corrected DFT calculations (DFT-D3) and non-equilibrium molecular dynamics simulation (NEMD), we have evaluated the selective separation performance of Graphdiyne (GD), Graphenylene (GN), and Rhombo-Graphyne (RG) for multicomponent mixture of light gases including H2, N2, O2, CO2, and CH4 molecules.
Methods
Quantum mechanics calculations
The quantum mechanics calculations were performed using Quantum ESPRESSO package.40 All geometry optimizations were carried out based on the periodic variable-cell plane-wave DFT calculations with the generalized gradient approximation (GGA) using Perdew–Burke–Ernzerhof (PBE) functional.41 The ultrasoft pseudopotential prepared through the Rappe–Rabe–Kaxiras–Joannopoulos scheme42 was used to model the ionic cores. The kinetic cutoff for charge densities and wave functions were defined to 4000 and 400 eV, respectively. The Brillouin zone integration was performed by an 8 × 8 × 1 Monkhorst–Pack grid.43 The convergence procedure was enhanced by applying Marzari–Vanderbilt cold smearing with 0.95 eV of broadening parameter.44 A vacuum gap with 20 Å thickness was considered in z-direction to minimize the interaction between periodic images. During the structural optimization process, the positions of all atoms in the unit-cell were fully relaxed until the convergence criteria of 1 × 10⁻⁴ eV for total energies and 1 × 10⁻³ eV Å−1 for forces were met. Also, the criterion for self-consistent field calculation was set to be 1 × 10⁻⁵ eV.The Climbing Image Nudged Elastic Band (CI-NEB) method45 was used with dispersion-corrected DFT calculations (DFT-D3),46 as implemented in the Quantum ESPRESSO package, to investigate the minimum energy pathways (MEPs) of various gas molecules passing through the different membranes and to extract the interaction potential function parameters. The path threshold for CI-NEB calculations was set to 0.05 eV Å−1 and 20 points were defined to discretize the path.
NEMD simulations
For non-equilibrium molecular dynamics (NEMD) simulation, the structurally optimized membranes with area of about 158 nm2 were placed in the middle of the permeate and feed sides. The feed side of the simulation box was filled up with 2000 gas molecules from each type, while the permeate side was set to be empty. Two rigid sheets of graphene were used as pistons to apply external pressure on the permeate and feed chambers. During the NEMD simulation, all the membranes were considered as rigid body because it has been stablished that the flexibility of the membrane has insignificant effect on the outputs.47 Also, it has been demonstrated that graphyne derivatives are much more rigid than other porous 2D materials like porous graphene and porous boron nitride membranes.39 Besides, the main goal of this study is to estimate the gas permeability at low pressure using linear interpolation of discrete data, where the possible membrane's distortion is at its minimum level.All NEMD simulations were carried out by LAMMPS package.48 The velocity Verlet scheme was employed with time step of 0.5 fs to integrate the equation of atomic motions. The periodic boundary conditions were also applied in X and Y directions. The simulation box was first fully equilibrated for 2 ns in the NVT ensemble (Nose–Hoover thermostat) with a fixed 1 atm pressure exerted on both pistons along the Z direction. Afterwards, the production run was lunched in the NEMD scheme along with applying 100–700 MPa pressure on the feed's piston (Fig. 3). In NEMD scheme, exerting much higher pressure than that practically applied is utterly prevalent to elevate the signal-to-noise ratio and minimize thermal noises within a short timescale.49 To apply pressure (P), defined amount of force (F) was exerted on every individual atoms of the piston based on the equation, F = (P × A)/n, where A and n are the piston area and the number of atoms, respectively. Both pistons were free to move along the Z direction to reach the desired pressure.
The interaction energy between gas molecules and different membranes were extracted from quantum mechanics calculations and modeled using the Morse potential function as will discuss in the next section. The COMPASS force field50,51 was employed to describe both bonded and non-bonded interactions of gas molecules with 15 Å cutoff for van der Waals forces. Coulomb's law was employed for short-range coulombic interactions within a cutoff radius of 15 Å, while, PPPM technique52 was considered for long-range coulombic interaction.
Results and discussion
Quantum mechanics calculations
For the first step, the 2D structures of GD, GN, and RG were optimized by means of variable-cell DFT calculations. The optimized structures of the membranes used in the current study are shown in Fig. 1 where the dashed area confined between two lattice vectors and
and  represents the unit cells. The coordinates for optimized unit cells of different membranes are provided in the ESI.† The calculated cell lattice parameters are also presented in Table 1. As this table indicates, there is a very good agreement between lattice parameters calculated in this work and those reported in the literature. These results confirm that the calculated structures are accurate enough to provide a precise insight about the hole size and morphology of the membranes.
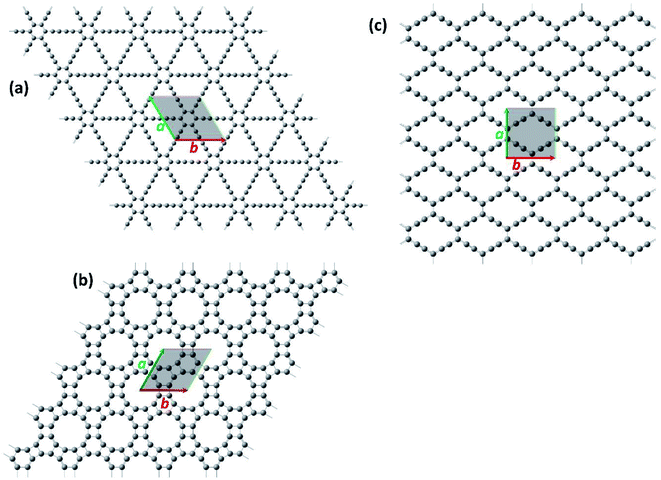 | ||
Fig. 1 The optimized structure of (a) Graphdiyne (GD), (b) Graphenylene (GN), and (c) Rhombo-Graphyne (RG). The dashed area confined between two lattice vectors  and and  represents the unit cells. represents the unit cells. | ||
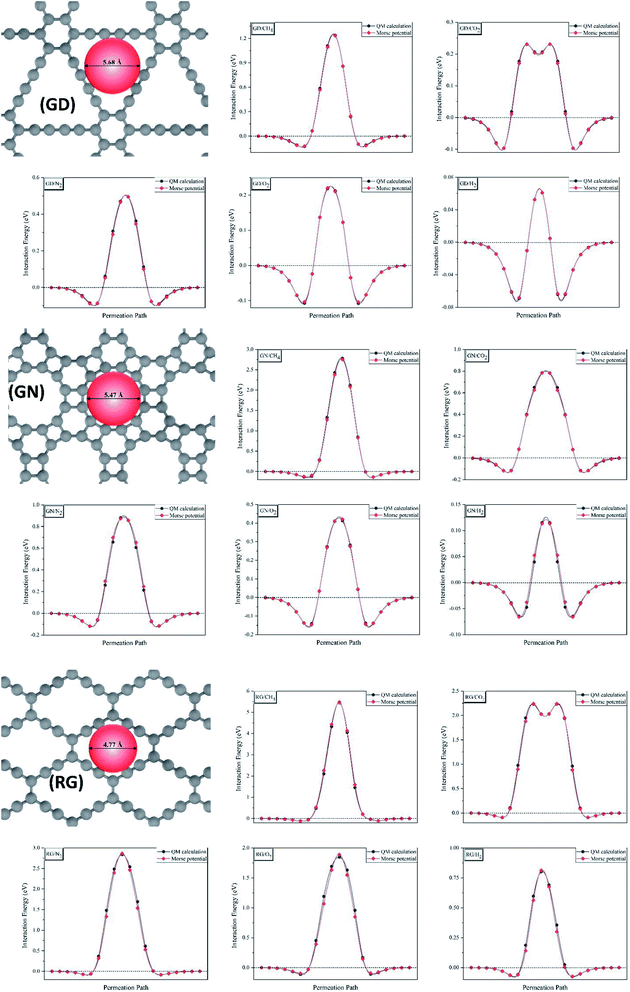
Afterwards, CI-NEB calculations were employed to investigate the MEPs of various gas molecules passing through the different membranes (Fig. 2) and to extract the interaction potential function parameters. The interaction energy between membrane surface and gas molecules, E, were calculated for 20 points which were used to discretize the MEP. Then, chi-square minimization technique was used to fit these points into the Morse potential (eqn (1)) by generalized reduced gradient algorithm.54
| E = D0[e−2α(r−r0)−2e−α(r−r0)] | (1) |
Fig. 2 shows the interaction energy of various gas molecules permeating through the different membranes calculated using CI-NEB and those fitted to the Morse potential. As this figure shows, the Morse potential fits very good at both attraction and repulsion regions. Table 2 compares the energy barriers for different gas molecules calculated using CI-NEB and those predicted from Morse potential. As one can see from Table 2, the difference between two energy barriers is less than 2% for all diffusing gas molecules. According to these results, the Morse potential could precisely reproduce the interaction energies and could be considered as a perfect bridge between quantum mechanics calculations and molecular dynamics simulation in this work. It has been approved that Morse potential can accurately describe the non-bonded interactions calculated by high level quantum mechanics techniques.55 The Morse potential parameters for interaction between various gas molecules and different membranes are shown in Table S1.†
| GD | GN | RG | |||||||
|---|---|---|---|---|---|---|---|---|---|
| Morse | QM | Rel. (%) | Morse | QM | Rel. (%) | Morse | QM | Rel. (%) | |
| CH4 | 1.240 | 1.235 | 0.4 | 2.781 | 2.754 | 1.0 | 5.475 | 5.451 | 0.4 |
| CO2 | 0.231 | 0.230 | 0.4 | 0.784 | 0.782 | 0.3 | 2.232 | 2.240 | 0.3 |
| N2 | 0.494 | 0.494 | 0.0 | 0.880 | 0.872 | 0.9 | 2.838 | 2.864 | 0.9 |
| O2 | 0.218 | 0.221 | 1.4 | 0.412 | 0.415 | 0.7 | 1.855 | 1.888 | 1.7 |
| H2 | 0.061 | 0.061 | 0.0 | 0.115 | 0.113 | 1.8 | 0.801 | 0.812 | 1.3 |
The membrane selectivity for one gas (Gas1) over other gases (Gas2) can be estimated based on the Arrhenius equation:52
 | (2) |
| GD | GN | RG | |
|---|---|---|---|
| H2/CH4 | 5 × 10¹⁹ | 2 × 1044 | 9 × 1077 |
| H2/CO2 | 7 × 10² | 2 × 10¹¹ | 1 × 1024 |
| H2/N2 | 2 × 10⁷ | 6 × 10¹² | 3 × 1034 |
| H2/O2 | 5 × 10² | 1 × 10⁵ | 1 × 10¹⁸ |
| O2/CH4 | 1 × 10¹⁷ | 2 × 1039 | 7 × 1059 |
| O2/CO2 | 1.4 | 1 × 10⁶ | 8 × 10⁵ |
| O2/N2 | 4 × 10⁴ | 5 × 10⁷ | 2 × 10¹⁶ |
| CO2/CH4 | 8 × 10¹⁶ | 1 × 1033 | 9 × 1053 |
| CO2/N2 | 3 × 10⁴ | 32.5 | 3 × 10¹⁰ |
| N2/CH4 | 3 × 10¹² | 4 × 1031 | 3 × 1043 |
Non-equilibrium MD simulation
To gain realistic insight about selectivity and gas permeability of different membranes, a series of NEMD simulation were performed as describes in computational details section. Fig. 3 shows a snapshot of the simulation box after 2 ns equilibration, where two pistons (graphene sheets) and membrane (GD) is illustrated in grey and blue respectively. The NEMD simulation results approved that none of the membranes are permeable for CH4 molecules. On the other hand, GN and RG are impermeable for N2 and CO2 molecules, while they can pass through the GD membrane.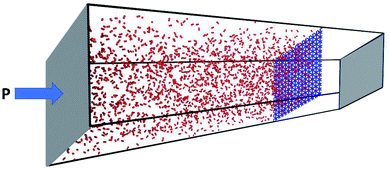 | ||
| Fig. 3 Snapshot of the simulation box after the initial 2 ns equilibrium stage. Two pistons and membrane are illustrated in grey and blue, respectively. | ||
Fig. 4 shows the number of gas molecules (Ngas, gas = N2 and CO2) passing through the GD as a function of applied pressure (P) and time (t). While both NN2 and NCO2 increase almost linearly with time, the rates of increase, at constant pressure, is much higher for CO2 gas. For example, at 500 MPa, NN2 and NCO2 reach to 200 after 26 and 5.5 ns, respectively. In addition, Fig. 4 illustrates the gas flux (Fgas, gas = N2 and CO2) as a function of applied pressure. As one can see, there is also a linear correlation between gas flux and applied pressure. Hence, the gas permeability can be estimated from the slope of the linear plot Fgas vs. P. The gas permeability values of GD membrane for CO2 and N2 gases were calculated to be 25.1 and 5.5 L h−1 cm−2 MPa−1 (at STP), respectively.
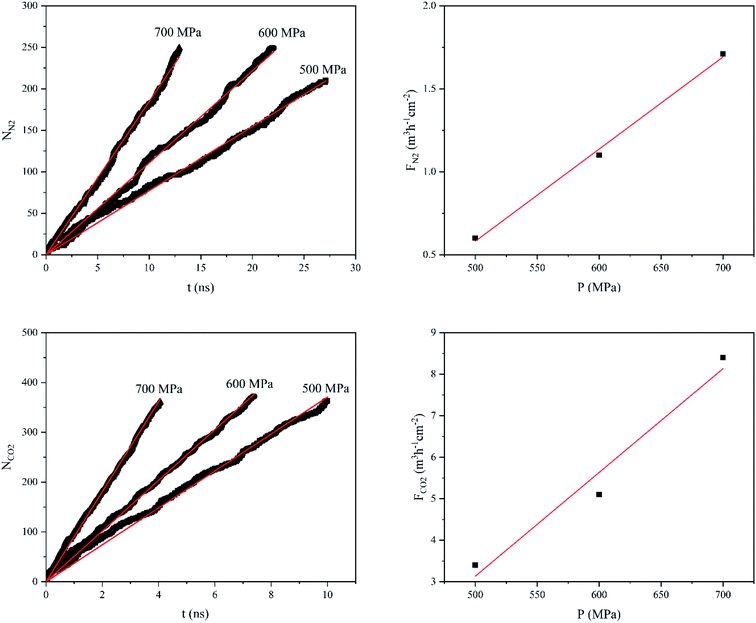 | ||
| Fig. 4 Number of N2 and CO2 molecules (Ngas) passing through the GD a function of time (t), and gas flux (Fgas) as a function of exerted pressure (P). | ||
According to the NEMD simulation results, oxygen molecules are able to diffuse through the GD and GN membranes but not RG. Fig. 5 shows the NO2 and FO2 values of GD and GN membranes as a function of applied pressure and time. The number of oxygen molecules passing through both GD and GN membranes increases almost linearly with time. However, at the constant pressure, NO2 for GD is much higher than that of GN. For instance, at 500 MPa, NO2 reaches to 300 after 5.4 and 25 ns for GD and GN membranes, respectively. The O2 gas permeability values were estimated to 29.3 and 9.8 L h−1 cm−2 MPa−1 (at STP) for GD and GN membranes, respectively.
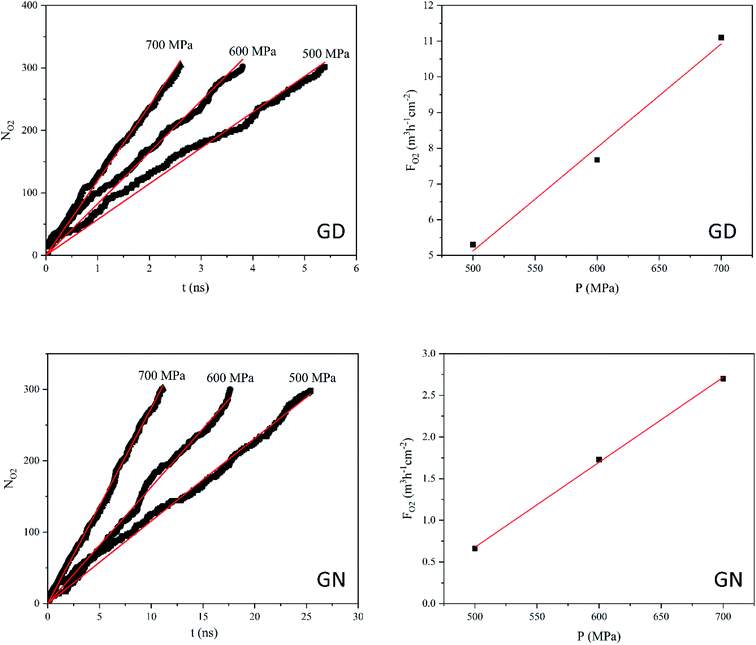 | ||
| Fig. 5 Number of O2 molecules (NO2) passing through the GD and GN membranes as a function of time (t) and, and O2 flux (FO2) as a function of exerted pressure (P). | ||
Hydrogen molecules, due to the smallest size, can pass through all different types of membranes. Fig. 6 shows the NH2 and FH2 values of GD, GN, and RG membranes. NEMD simulations show that, at the constant applied pressure, the number of H2 molecules diffusing through the RG is significantly lower than those of GD and GN membranes. For example, at 300 MPa, the time elapsed for NH2 to reach 1000 was 0.15, 0.26, and 2.0 ns for GD, GN, and RG membranes respectively. The calculated H2 gas permeability values were calculated to be 2180.1, 1070.5, and 160.2 L h−1 cm−2 MPa−1 (at STP) for GD, GN, and RG membranes, respectively.
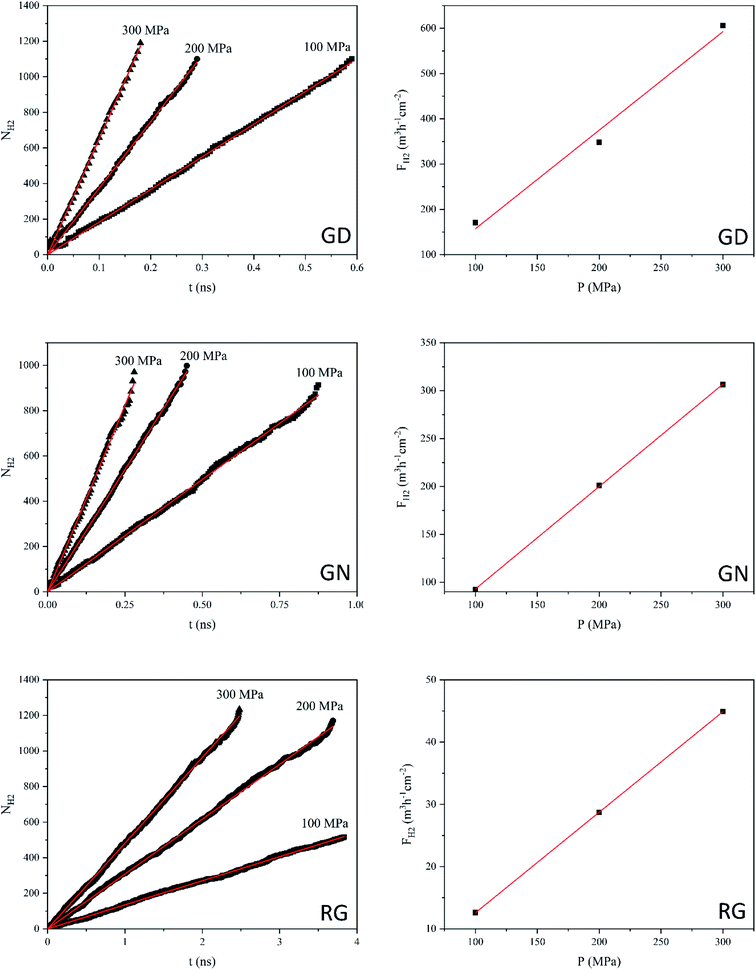 | ||
| Fig. 6 Number of H2 molecules (NH2) passing through the GD, GN, and RG membranes as a function of time, and H2 flux (FH2) as a function of exerted pressure (P). | ||
The NEMD simulation results gave us the following insights: (1) methane molecules can be separated from the other gases (i.e. H2, O2, CO2, N2) using the GD as membrane (2) none of the membranes can completely separate CO2 and N2 molecules. However, the permeability of CO2 molecules through the GD membrane is ∼5 times greater than that of N2 molecules. (3) O2 and H2 can be separated from other gases by means of GN membrane. (4) H2 and O2 molecules can be separated perfectly using RG membrane. (5) the NEMD simulation results are generally consistent with the selectivity data calculated from Arrhenius equation. However, after analyzing the NEMD data and comparing the results with Arrhenius selectivity values, the limitation of the Arrhenius equation for prediction of the true selectivity was clearly revealed. For example, RG membrane is totally impermeable for all gases except H2, but Arrhenius predicts a very high selectivity for O2/CH4 (∼1060), CO2/CH4 (∼1054), and N2/CH4 (∼1043). It is because the selectivity value based on the Arrhenius equation depends on the difference between the diffusion barrier energies of each gas and not the absolute values. Therefore, a membrane can be impermeable for both gases (with very different barrier energies) while the Arrhenius shows a very high selectivity.
Conclusions
Herein, we employed multiscale computational approach, combining plane-wave DFT calculations and extensive NEMD simulation, to investigate the possibility of multicomponent low weight gas (H2, O2, N2, CO2, CH4) separation and purification using novel porous 2D carbonaceous nanomaterials, namely Graphdiyne (GD), Graphenylene (GN), and Rhombic-Graphyne (RG). The results indicated that CH4 molecules are not able to pass through any of these membranes while CO2 and N2 molecules can just pass through DG membrane. The calculated permeability values of GD membrane for CO2 and N2 molecules are 25.1 and 5.5 L h−1 cm−2 MPa−1 (at STP), respectively. O2 molecules can pass through GD and GN membranes with the corresponding permeability values of 29.3 and 9.8 L h−1 cm−2 MPa−1 (at STP), respectively. On the other hand, H2 molecule can diffuse through all membranes with estimated permeability values of 2180.1, 1070.5, and 160.2 L h−1 cm−2 MPa−1 (at STP) for GD, GN, and RG membranes, respectively. This study shows that CH4 molecules can be completely separated from the other gases using GD membrane, O2 molecules from CH4, N2, and CO2 by GN membrane, and H2 molecules from all other gases using RG membrane. However, it seems complete separation of CO2 and N2 molecules is not possible with three membranes studied here. According to the results, graphdiyne, graphenylene, and rhombic-graphyne nanomaterials are promising membranes for multicomponent gas separation and purification.Conflicts of interest
There are no conflicts to declare.Acknowledgements
Authors acknowledge financial support from Iran Science Elites Federation (ISEF). Exclusive support from Prof. Leif A. Eriksson (University of Gothenburg) is greatly appreciated.References
- L. Zhu, Y. Jin, Q. Xue, X. Li, H. Zheng, T. Wu and C. Ling, J. Mater. Chem. A, 2016, 4, 15015–15021 RSC.
- S. J. Mahdizadeh and E. K. Goharshadi, Int. J. Hydrogen Energy, 2019, 44, 8325–8340 CrossRef CAS.
- R. Totani, C. Grazioli, T. Zhang, I. Bidermane, J. Lüder, M. de Simone, M. Coreno, B. Brena, L. Lozzi and C. Puglia, J. Chem. Phys., 2017, 146, 054705 CrossRef CAS PubMed.
- J. G. Vitillo, B. Smit and L. Gagliardi, Chem. Rev., 2017, 117, 9521–9523 CrossRef CAS PubMed.
- M. Shan, B. Seoane, E. Rozhko, A. Dikhtiarenko, G. Clet, F. Kapteijn and J. Gascon, Chem.–Eur. J., 2016, 22, 14467–14470 CrossRef CAS PubMed.
- N. F. Himma, A. K. Wardani, N. Prasetya, P. T. Aryanti and I. G. Wenten, Rev. Chem. Eng., 2019, 35, 591–625 CAS.
- Y. Jiao, A. Du, S. C. Smith, Z. Zhu and S. Z. Qiao, J. Mater. Chem. A, 2015, 3, 6767–6771 RSC.
- H. Ye, D. Li, X. Ye, Y. Zheng, Z. Zhang, H. Zhang and Z. Chen, Sci. Rep., 2019, 9, 7380 CrossRef PubMed.
- Y. Jiao, A. Du, M. Hankel and S. C. Smith, Phys. Chem. Chem. Phys., 2013, 15, 4832–4843 RSC.
- L. M. Robeson, J. Membr. Sci., 2008, 320, 390–400 CrossRef CAS.
- Y. Yampolskii, Macromolecules, 2012, 45, 3298–3311 CrossRef CAS.
- S. Yun and S. T. Oyama, J. Membr. Sci., 2011, 375, 28–45 CrossRef CAS.
- N. Kosinov, J. Gascon, F. Kapteijn and E. J. Hensen, J. Membr. Sci., 2016, 499, 65–79 CrossRef CAS.
- H. L. Castricum, H. F. Qureshi, A. Nijmeijer and L. Winnubst, J. Membr. Sci., 2015, 488, 121–128 CrossRef CAS.
- M. S. Denny Jr, J. C. Moreton, L. Benz and S. M. Cohen, Nat. Rev. Mater., 2016, 1, 16078 CrossRef.
- S. Oyama, D. Lee, P. Hacarlioglu and R. Saraf, J. Membr. Sci., 2004, 244, 45–53 CrossRef CAS.
- L. Huang, M. Zhang, C. Li and G. Shi, J. Phys. Chem. Lett., 2015, 6, 2806–2815 CrossRef CAS PubMed.
- D.-e. Jiang, V. R. Cooper and S. Dai, Nano Lett., 2009, 9, 4019–4024 CrossRef CAS PubMed.
- Q. Xu, H. Xu, J. Chen, Y. Lv, C. Dong and T. S. Sreeprasad, Inorg. Chem. Front., 2015, 2, 417–424 RSC.
- K. Celebi, J. Buchheim, R. M. Wyss, A. Droudian, P. Gasser, I. Shorubalko, J.-I. Kye, C. Lee and H. G. Park, Science, 2014, 344, 289–292 CrossRef CAS PubMed.
- K. Huang, G. Liu, Y. Lou, Z. Dong, J. Shen and W. Jin, Angew. Chem., Int. Ed., 2014, 53, 6929–6932 CrossRef CAS PubMed.
- J. S. Bunch, S. S. Verbridge, J. S. Alden, A. M. Van Der Zande, J. M. Parpia, H. G. Craighead and P. L. McEuen, Nano Lett., 2008, 8, 2458–2462 CrossRef CAS PubMed.
- S. J. Mahdizadeh, E. K. Goharshadi and G. Akhlamadi, Phys. Chem. Chem. Phys., 2018, 20, 22241–22248 RSC.
- A. Balaban, C. C. Rentia and E. Ciupitu, Rev. Roum. Chim., 1968, 13, 231–247 CAS.
- M. Hankel and D. J. Searles, Phys. Chem. Chem. Phys., 2016, 18, 14205–14215 RSC.
- Y.-X. Yu, J. Mater. Chem. A, 2013, 1, 13559–13566 RSC.
- Q. Song, B. Wang, K. Deng, X. Feng, M. Wagner, J. D. Gale, K. Müllen and L. Zhi, J. Mater. Chem. C, 2013, 1, 38–41 RSC.
- Q.-S. Du, P.-D. Tang, H.-L. Huang, F.-L. Du, K. Huang, N.-Z. Xie, S.-Y. Long, Y.-M. Li, J.-S. Qiu and R.-B. Huang, Sci. Rep., 2017, 7, 40796 CrossRef CAS PubMed.
- R. Baughman, H. Eckhardt and M. Kertesz, J. Chem. Phys., 1987, 87, 6687–6699 CrossRef CAS.
- L. Pan, L. Zhang, B. Song, S. Du and H.-J. Gao, Appl. Phys. Lett., 2011, 98, 173102 CrossRef.
- Q. Li, Y. Li, Y. Chen, L. Wu, C. Yang and X. Cui, Carbon, 2018, 136, 248–254 CrossRef CAS.
- Y. Li, L. Xu, H. Liu and Y. Li, Chem. Soc. Rev., 2014, 43, 2572–2586 RSC.
- X. Gao, H. Liu, D. Wang and J. Zhang, Chem. Soc. Rev., 2019, 48, 908–936 RSC.
- A. N. Enyashin and A. L. Ivanovskii, Phys. Status Solidi B, 2011, 248, 1879–1883 CrossRef CAS.
- H. Zhang, X. He, M. Zhao, M. Zhang, L. Zhao, X. Feng and Y. Luo, J. Phys. Chem. C, 2012, 116, 16634–16638 CrossRef CAS.
- Y. Jiao, A. Du, M. Hankel, Z. Zhu, V. Rudolph and S. C. Smith, Chem. Commun., 2011, 47, 11843–11845 RSC.
- L. Zhao, P. Sang, S. Guo, X. Liu, J. Li, H. Zhu and W. Guo, Appl. Surf. Sci., 2017, 405, 455–464 CrossRef CAS.
- S. W. Cranford and M. J. Buehler, Nanoscale, 2012, 4, 4587–4593 RSC.
- L. Zhang, C. Wu, X. Ding, Y. Fang and J. Sun, Phys. Chem. Chem. Phys., 2018, 20, 18192–18199 RSC.
- P. Giannozzi, S. Baroni, N. Bonini, M. Calandra, R. Car, C. Cavazzoni, D. Ceresoli, G. L. Chiarotti, M. Cococcioni and I. Dabo, J. Phys.: Condens. Matter, 2009, 21, 395502 CrossRef PubMed.
- L. Wang, T. Maxisch and G. Ceder, Phys. Rev. B: Condens. Matter Mater. Phys., 2006, 73, 195107 CrossRef.
- A. M. Rappe, K. M. Rabe, E. Kaxiras and J. Joannopoulos, Phys. Rev. B: Condens. Matter Mater. Phys., 1990, 41, 1227 CrossRef PubMed.
- H. J. Monkhorst and J. D. Pack, Phys. Rev. B: Solid State, 1976, 13, 5188 CrossRef.
- N. Marzari, D. Vanderbilt, A. De Vita and M. Payne, Phys. Rev. Lett., 1999, 82, 3296 CrossRef CAS.
- G. Henkelman, B. P. Uberuaga and H. Jónsson, J. Chem. Phys., 2000, 113, 9901–9904 CrossRef CAS.
- S. Grimme, J. Antony, S. Ehrlich and H. Krieg, J. Chem. Phys., 2010, 132, 154104 CrossRef PubMed.
- H. Daglar and S. Keskin, J. Phys. Chem. C, 2018, 122, 17347–17357 CrossRef CAS PubMed.
- S. Plimpton, J. Comput. Phys., 1995, 117, 1–19 CrossRef CAS.
- Z. Hu, Y. Chen and J. Jiang, J. Chem. Phys., 2011, 134, 134705 CrossRef PubMed.
- H. Sun, J. Phys. Chem. B, 1998, 102, 7338–7364 CrossRef CAS.
- J. Yang, Y. Ren, A.-m. Tian and H. Sun, J. Phys. Chem. B, 2000, 104, 4951–4957 CrossRef CAS.
- B. A. Luty and W. F. van Gunsteren, J. Phys. Chem., 1996, 100, 2581–2587 CrossRef CAS.
- M. Long, L. Tang, D. Wang, Y. Li and Z. Shuai, ACS Nano, 2011, 5, 2593–2600 CrossRef CAS PubMed.
- L. S. Lasdon, A. D. Waren, A. Jain and M. Ratner, Design and testing of a generalized reduced gradient code for nonlinear programming, Stanford Univ Ca Systems Optimization Lab, 1976 Search PubMed.
- L. Yang, L. Sun and W.-Q. Deng, J. Phys. Chem. A, 2018, 122, 1672–1677 CrossRef CAS PubMed.
Footnote |
| † Electronic supplementary information (ESI) available: The Morse potential parameters for interaction between various gas molecules and different membranes, optimized unit cell of different membranes, and .xyz file format of graphdiyne, graphenylene, and rhombic-graphyne membranes. See DOI: 10.1039/d0ra04286b |
| This journal is © The Royal Society of Chemistry 2020 |

