 Open Access Article
Protective effects of selenium-enriched peptides from Cardamine violifolia against high-fat diet induced obesity and its associated metabolic disorders in mice†
Tian Yu‡
ae,
Jia Guo‡b,
Song Zhuc,
Meng Lid,
Zhenzhou Zhue,
Shuiyuan Chenge,
Shiwei Wangf,
Yanmei Sun*f and
Xin Cong *ae
*ae
aEnshi Se-Run Health Tech Development Co., Ltd., Enshi 445000, China. E-mail: 21108037@qq.com
bInstitute of Biomedical Engineering and Health Sciences, Changzhou University, Changzhou 213164, China
cState Key Laboratory of Food Science and Technology, Jiangnan University, Wuxi 214122, China
dBeijing Key Lab of Plant Resource Research and Development, Beijing Technology and Business University, Beijing 100048, China
eNational R&D Center for Se-rich Agricultural Products Processing, College of Food Science and Engineering, Wuhan Polytechnic University, Wuhan 430023, China
fKey Laboratory of Resources Biology and Biotechnology in Western China, Ministry of Education, College of Life Sciences, Northwest University, Xi'an, 710069, China. E-mail: sunyanmei2001@126.com
First published on 26th August 2020
Abstract
Selenium-enriched peptides from Cardamine violifolia (CSP) have excellent antioxidant functions but little is known about their effects on obesity and associated metabolic disorders in mice fed with a high-fat diet (HFD). In this study, C57BL/6 mice were fed a HFD with or without CSP supplementation (CSPL: 26 μg Se per kg bw per d; CSPH: 104 μg per kg bw per d) for 10 weeks. The results showed that both CSPL and CSPH could ameliorate overweight gain, excess fat accumulation, serum lipid metabolism, and insulin resistance. The potential mechanism might be associated with the increase in thermogenesis, reduced oxidative stress, and inflammation, which regulated the gene expression in lipid and cholesterol metabolism. In addition, CSPL and CSPH also maintained the intestinal integrity and modulated the gut microbiota. Increased Blautia in CSP may be involved in the protective effect against obesity. Furthermore, a distinct increase in Lactobacillus was exclusively found in CSPH, suggesting that a more effective function of CSPH on metabolic disorders might be through the synergism of Blautia and Lactobacillus. Spearman's correlation analysis revealed that these specific genera were significantly correlated with the metabolic improvements. Taken together, CSP supplementation prevented HFD-induced obesity and metabolic disorders, probably by ameliorating oxidative stress and inflammation, regulating metabolic genes, and modulating the gut microbiota compositions.
1. Introduction
With rapid economic development and lifestyle changes, obesity has progressively become one of the most important public health problems in the world. According to the WHO global status report in 2014, obesity prevalence has reached epidemic levels wherein more than 1.9 billion adults are overweight and over 600 million adults are obese.1 Moreover, evidence indicates that obesity has become a high-risk factor for many chronic diseases including type 2 diabetes, non-alcoholic fatty liver disease, cardiovascular disease, and many types of cancer, which cause low-quality life and serious economic burden globally.2,3 Therefore, it makes great sense to find more effective approaches to prevent obesity and its co-morbidities.Obesity has clinical characteristics not only with the deposition of excessive fat but also high oxidative stress, hyperlipidemia, insulin resistance, and chronic inflammation.4,5 Excessive high-fat exposure can cause organ dysfunction and activate the immune system, which increases oxidative stress, infiltration of immune cells, and production of pro-inflammatory cytokines such as TNF-α and IL-6,6 consequently generating serious metabolic disturbance in the crucial signaling pathways of lipid, glucose, and even amino acid, together contributing to the development of obesity-associated diseases.7,8
Selenium (Se) is an essential trace element for humans and animals. It has various beneficial effects, such as serving as an antioxidant, providing cardiovascular protection, helping in cancer prevention, and improving the metabolic syndrome. The role of Se in physiology is mainly derived from its presence in selenocysteine (SeCys), which has been termed as the 21st amino acid and can compose to the active site of a wide range of selenoproteins. Some of them have a variety of important functions involved in scavenging free radicals, redox state regulation, thyroid hormone metabolism, preventing cancer, and immune function.9 It was reported that Se may also inhibit adipocyte hypertrophy and adipogenesis. Furthermore, Se nutrition status as well as the activity of the important selenoprotein, glutathione peroxidase (GPx), may be associated with obesity.10 However, approximately 1 billion people still lack sufficient Se worldwide, which results in many health problems.11
Similar to other micronutrients, Se bioavailability strongly depends on its chemical forms. Scientists generally believe that organic Se species have lower toxicity, higher bioavailability, and better antioxidant properties than its inorganic forms.12
Se-enriched plants obtained by biofortification have been considered as one of the dominant sources for Se supplementation due to the safety and bioavailability, which can assimilate and transform inorganic Se to the organic forms. According to the capacity to accumulate Se, plants can be categorized into three main groups: Se non-accumulators [<100 mg Se per kg dry weight (DW)], secondary Se accumulators (100–1000 mg Se per kg DW), and hyperaccumulators (>1000 mg Se per kg DW).13 In recent years, Se hyperaccumulator plants have become a new research hotspot due to their potential roles in developing new Se supplementations.
Cardamine violifolia (C. violifolia) is a novel hyperaccumulator Brassicaceae plant found in Enshi, China. It has an edible history of several hundred years and is enriched in various nutrients, especially abundant proteins, vitamin C, sulfo-compounds, and minerals. It can accumulate Se in excess of 1400 mg per kg DW in its leaves. The main form is organic Se, which mainly exists in the form of Se-enriched proteins.14 The edibility and Se accumulation ability of C. violifolia displays a great potential to develop it as a new generation of Se supplementation in healthy food. However, few studied have reported the specific biological function of the Se-enriched proteins and their derivatives in C. violifolia.
In our previous work, we obtained the Se-enriched peptides from C. violifolia (CSP) by compound protease hydrolysis and found that CSP has great antioxidant activity for scavenging free radical in vitro.15 Therefore, we speculated that CSP might improve the oxidative stress in obesity and reduce inflammation. The aim of the present study was to evaluate (1) whether CSP supplementation prevented or attenuated obesity and the associated metabolic disorders by regulating the antioxidative status and inflammation level in mice fed a high-fat diet, and (2) whether CSP impacted the related gene expression in lipid metabolism and modulated the gut microbiota composition.
2. Materials and methods
2.1 Preparation of CSP
Se-enriched C. violifolia were obtained by root application of selenite. After three months of growth, the shoots were harvested and dried to a powder for further processing. CSP were collected by the digestion of the protease compound, as previously reported.15 The total Se content of the pilot CSP was 1177 ppm and the proportion of the peptides accounted for 10%.2.2 Animals and diets
Forty male C57BL/6J mice (6 weeks old) were purchased from Vital River Laboratories (Beijing, China) and maintained under the conditions (23 ± 2 °C, 55 ± 5% relative humidity, a 12 h light/dark cycle) with food and water ad libitum. After one week of acclimatization, the mice were randomly divided into 4 groups with four cages in each group (2–3 mice per cage, n = 10) and fed with the following diets by oral gavage for 10 weeks: (A) NCD (normal chow diet, Nantong Trophic Animal Feed High-tech Co., China); (B) HFD (D23300, Nantong Trophic Animal Feed High-tech Co., China); (C) HFD + low Se content of CSP (CSPL, 22 mg per kg bw per d, containing 26 μg Se per kg bw per d); and (D) HFD + high Se concentration of CSP (CSPH, 88 mg per kg bw per day, containing 104 μg Se per kg bw per d). The dose was calculated based on transforming an adult's daily intake (i.e., 1.0 g) to the daily consumption of one mouse (i.e., 0.0026 g), according to the method in Methodology of Pharmacological Experiment.16 Finally, the mouse with 20 g body weight taking CSPL (26 μg Se per kg bw per d) is equal to 200 μg Se per day for the adult, while the Se dose of CSPH is equal to 800 μg day−1 for the adult. The compositions of the diets are shown in ESI Table S1.† During the experiments, the mice body weights and food intakes were recorded weekly. Energy intake (kcal) was calculated by multiplying the grams of food consumed by the energy (kcal g−1) in each diet. Fresh stool samples were collected once a week and immediately stored at −80 °C for subsequent analysis. After 10 weeks, the mice were fasted for 12 h, blood samples were collected from the orbital vascular plexus, and then the mice were euthanized. The livers, intestines, interscapular brown adipose tissue (BAT), and epididymal white adipose tissue (eWAT) were carefully collected and weighed immediately. Then all the samples were frozen in liquid nitrogen immediately and stored at −80 °C until further analysis. All the experimental procedures were approved by the Ethics and Animal Welfare Committee of Beijing Laboratory Animal Research Centre (BLARC-2017-E012).2.3 Glucose homeostasis analysis
At week 9, an oral glucose tolerance test (OGTT) was performed. Mice were administered orally with glucose (2 g kg−1) after overnight fasting and the blood glucose levels were determined at 0, 30, 60, 90, 150, and 180 min using a portable glucometer (Sinocare Inc, Shenzhen, China). At week 10, the serum samples were collected after fasting overnight. Fasting serum insulin was measured using a commercial ELISA kit (Zecen Biotech, Wuxi, China) and fasting serum glucose concentration was determined by a commercially available kit (Nanjing Jiancheng, Nanjing, China).The homeostasis model assessment-insulin resistance (HOMA-IR) was calculated using the following formula: HOMA-IR = fasting serum glucose (mmol L−1) × fasting serum insulin (μM mL−1)/22.5.
2.4 Biochemical analysis and cytokine measurements
The serum samples were isolated by centrifugation (4 °C, 12![[thin space (1/6-em)]](https://www.rsc.org/images/entities/char_2009.gif) 000g, 10 min). Serum triglycerides (TG), total cholesterol (TC), high-density lipoprotein cholesterol (HDL-C), and low-density lipoprotein cholesterol (LDL-C) were measured using commercial kits (Nanjing Jiancheng Bioengineering Institute, Nanjing, China) based on the manufacturer's instructions. Serum malondialdehyde (MDA), total antioxidant capacity (TAOC), glutathione peroxidase (GPx), total superoxide dismutase (SOD), and catalase (CAT) were determined using the assay kits (Nanjing Jiancheng Bioengineering Institute, Nanjing, China). Serum leptin, adiponectin, MCP-1, TNF-α, IL-6, and IL-1β protein levels were quantified using commercial ELISA kits (Nanjing Jiancheng Bioengineering Institute, Nanjing, China).
000g, 10 min). Serum triglycerides (TG), total cholesterol (TC), high-density lipoprotein cholesterol (HDL-C), and low-density lipoprotein cholesterol (LDL-C) were measured using commercial kits (Nanjing Jiancheng Bioengineering Institute, Nanjing, China) based on the manufacturer's instructions. Serum malondialdehyde (MDA), total antioxidant capacity (TAOC), glutathione peroxidase (GPx), total superoxide dismutase (SOD), and catalase (CAT) were determined using the assay kits (Nanjing Jiancheng Bioengineering Institute, Nanjing, China). Serum leptin, adiponectin, MCP-1, TNF-α, IL-6, and IL-1β protein levels were quantified using commercial ELISA kits (Nanjing Jiancheng Bioengineering Institute, Nanjing, China).
2.5 Histological analysis
Freshly isolated liver, epididymal white adipose, and ileum were fixed in 10% neutral buffered formalin, then embedded in paraffin and sliced at 5 μm. After this, the sections were stained with hematoxylin and eosin (H&E). For oil red O staining, the frozen sections from the embedded liver tissues were used and sliced at 6 μm. The size of the white adipocytes, the morphological adaptation of the ileum, and the hepatic lipid accumulation were examined using a light microscope (Tokyo Olympus Corporation, Japan).2.6 RNA extraction and quantitative real-time PCR (qRT-PCR)
Total RNA was extracted from the liver and ileum using TRIzol reagent (Invitrogen, USA). cDNA was synthesized using the reverse transcription kit (Promega, USA), and then qRT-PCR was performed. All the primers used in qRT-PCR are listed in ESI Table S2.† Relative quantification was calculated based on the 2−ΔΔCT method normalized to the control β-actin.2.7 Western blot assay
Liver tissue was homogenized in the lysis buffer containing complete protease inhibitor and treated with ultrasonication using three 10 s bursts at high intensity. Then, the samples were centrifuged at 12![[thin space (1/6-em)]](https://www.rsc.org/images/entities/char_2009.gif) 000g for 15 min at 4 °C. The protein concentrations were measured by BCA assay. After that, the protein samples were separated by 12% SDS-polyacrylamide gel electrophoresis and transferred to the PVDF membranes. Primary antibodies including GPX4 (affinity, 1:500) and β-actin (1:2000) were incubated at 4 °C overnight. Subsequently, they were washed three times, followed by incubation with a horseradish peroxidase-conjugated secondary antibody (dilution: 1:1000). Finally, an enhanced chemiluminescence reagent (ELC) was used to color the bands, which were detected with GelDoc-It310 ChemiDoc MP (Bio-rad, USA).
000g for 15 min at 4 °C. The protein concentrations were measured by BCA assay. After that, the protein samples were separated by 12% SDS-polyacrylamide gel electrophoresis and transferred to the PVDF membranes. Primary antibodies including GPX4 (affinity, 1:500) and β-actin (1:2000) were incubated at 4 °C overnight. Subsequently, they were washed three times, followed by incubation with a horseradish peroxidase-conjugated secondary antibody (dilution: 1:1000). Finally, an enhanced chemiluminescence reagent (ELC) was used to color the bands, which were detected with GelDoc-It310 ChemiDoc MP (Bio-rad, USA).
2.8 16S rRNA sequencing and analysis
Bacterial DNA was extracted from the fecal samples, which were collected at week 10 using a QIAamp DNA Stool Mini Kit (Qiagen, Germany) and qualified on 1% agarose gel to control the DNA quality. After that, the V3–V4 region of the 16S rRNA genes was PCR-amplified using the universal primers 341F (5′-CCTACGGGRSGCAGCAG-3′) and 806R (5′-GGACTACVSGGGTATCTAAT-3′), followed by the generation of the sequencing libraries using TruSeq DNA PCR-free sample preparation kit (Illumina, San Diego, CA, USA). Then, the 16S rDNA high-throughput sequencing was performed by Majorbio Bio-pharm Technology (Shanghai, China) using an Illumina MiSeq platform with 250 bp paired-end reads. Subsequently, the paired-end reads were merged using FLASH V1.2.7 and quality-controlled under specific filtering conditions according to QIIME V1.7.0 to obtain high-quality clean tags. Chimeric sequences were detected and removed using the UCHIME algorithm according to the Gold reference database. Finally, the sequences with 97% similarity were clustered into operational taxonomic units (OTUs) using UPARSE (V7.0.1001). α-Diversity (Chao1, Ace index, Shannon index, and Simpson index) and Venn diagrams were conducted with QIIME (V1.7.0), and displayed with R software (V2.15.3). Principal component analysis (PCA) and principal coordinate analysis (PCoA) based on Bray–Curtis dissimilarity on OTU level were applied to quantify the compositional differences between the microbial communities.The different relative abundance of the bacteria within the groups were calculated by the Wilcoxon rank-sum test. The linear discriminant analysis (LDA) effect size (LEfSe) analysis was used for identifying the significant differences in the biomarker species in different groups (LDA > 4.0).The Spearman's rho non-parametric correlations between the gut microbiota and obesity-related indexes were determined using R packages heatmap. All the data were analyzed on the free online platform Majorbio I-Sanger Cloud Platform (http://www.i-sanger.com).
2.9 Statistical analysis
All the data were expressed as the mean ± SEM. Statistical analysis was performed using GraphPad Prism 5.0 (GraphPad Software Inc., San Diego, CA, USA) and SPSS 22.0 (SPSS Inc., Chicago, IL, USA). The differences between the groups were determined using one-way ANOVA with Tukey's multiple comparison test or Student's t test. The results were considered as statistically significant at P < 0.05.3. Results
3.1 CSP alleviates HFD-induced obesity in mice
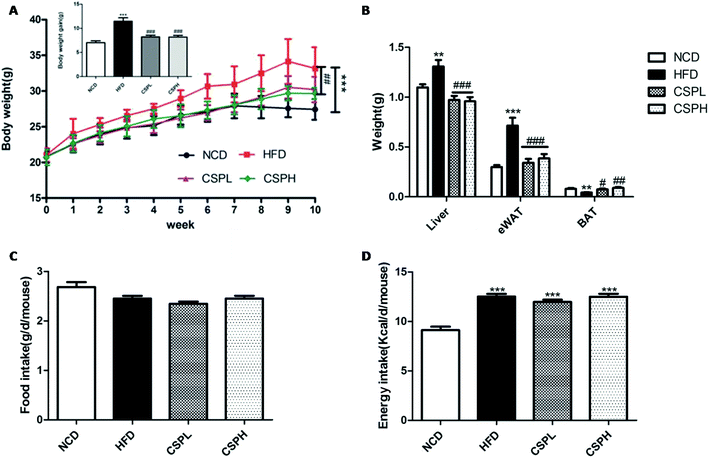
Over the 10 week administration of HFD diet, the body weight and body weight gain in the HFD groups were significantly increased compared to the NCD groups. The average weight gain in the HFD groups was 11.99 g, while CSPL and CSPH supplementation both markedly decreased the body weight and weight gain compared to the HFD groups, and the final weight gain was just 9.61 g and 9.11 g, respectively (Fig. 1A). In order to assess whether CSP can affect the fat accumulation, the weight of the liver, epididymal white adipose tissue (eWAT), and brown adipose tissue (BAT) was determined. Consistent with the body weight results, mice fed with HFD showed a significant increase in the weight of the liver (p < 0.01) and eWAT (P < 0.001), and a marked decrease in the weight of BAT (p < 0.01). In the contrast, CSPL and CSPH supplementation significantly ameliorated the weight gain in the liver and the eWAT (P < 0.001), and noticeably increased the weight of BAT (CSPL p < 0.05, CSPH p < 0.01). However, there were no significant differences in the food intake and energy intake among the HFD and CSP groups, suggesting that the effects of CSPL and CSPH on the body weight and fat accumulation were not related to the change in the food consumption. Since CSP did not show alteration in food intake, a higher energy expenditure may exist. To further explore it, the gene expression of UCP1 in BAT and eWAT was determined (Fig. S1†). In both BAT and eWAT, no significant difference was observed between NCD and HFD. On the other hand, compared to the HFD groups, both CSPL and CSPH significantly enhanced the expression of UCP1, suggesting that increased thermogenesis had occurred.3.2 CSP attenuated the hypertrophy of HFD-induced adipose and hepatic tissues in mice
Since CSP supplementation could reduce the weight gain of the body, eWAT, and liver, we wanted to know whether CSP could attenuate the hypertrophy of fat and liver. As shown in Fig. 2A, H&E staining of the eWAT sections revealed that the white adipose tissue in the NCD group showed a normal size, while in the HFD group, serious adipocyte hypertrophy and a large number of single bubble adipocyte were observed. In addition, the abnormal histopathological change was ameliorated by CSP supplementation. Similar results were also observed in the liver tissue by oil red O staining (Fig. 2B). The positive oil red O stained area was substantially increased in the HFD group. CSPL exhibited mild attenuation of fat accumulation compared with the HFD group, whereas a remarkable amelioration was found in the CSPH group, thus indicating the great protective effect of CSP against HFD-induced hepatic steatosis.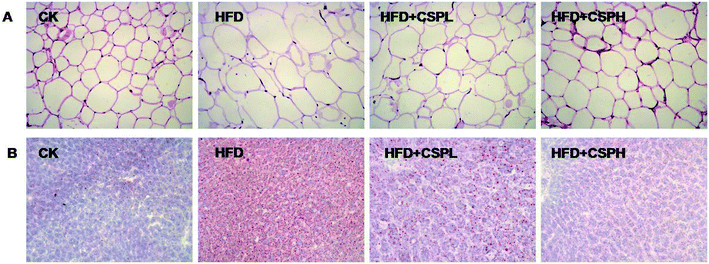 | ||
| Fig. 2 CSP supplementation attenuates the hypertrophy of adipose and hepatic tissues in HFD-fed mice. (A) H&E staining of eWAT sections (200×); (B) oil red O staining of liver sections (200×). | ||
3.3 CSP ameliorated serum lipid disorder and glucose metabolism in HFD-induced mice
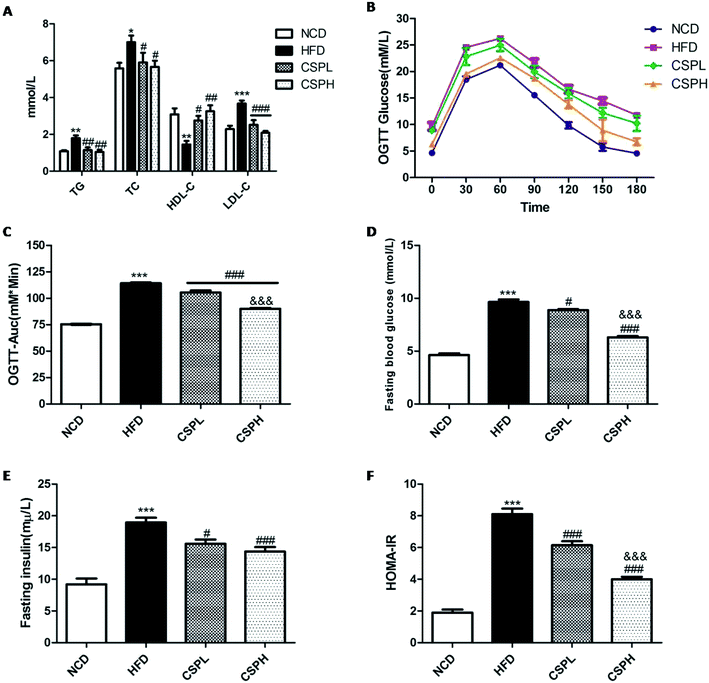
Generally, obesity is strongly associated with dyslipidemia and dysglycemia. To investigate whether CSP supplementation can affect the lipid and glucose metabolism in mice with HFD-fed diet, the serum lipid profile, oral glucose tolerance test, fasting blood glucose, and fasting blood insulin were determined. As shown in Fig. 3A, HFD-fed mice exhibited dyslipidemia symptom, which was reflected in the significantly increased levels of total triglyceride (TG), total cholesterol (TC), and low-density lipoprotein (LDL-C), and a marked decrease in the high-density lipoprotein (HDL-C). However, both CSPL and CSPH supplementation noticeably decreased the TG, TC, and LDL levels but increased the HDL-C level. No obvious difference was observed between them. On glucose metabolism, CSPL and CSPH could significantly improve the HFD-induced glucose tolerance and showed a dose-dependent effect (Fig. 3B and C, P < 0.001). Compared with the HFD group, CSP supplementation dramatically suppressed and reversed the glucose and insulin levels in the fasting serum with a lower homeostatic model assessment for insulin resistance (HOMA-IR), (Fig. 3D–F). Taken together, these results indicated that CSP supplementation could effectively improve HFD-induced lipid and glucose metabolic disorders, thus suppressing insulin resistance.3.4 CSP alleviated HFD-induced oxidative stress and systematic inflammation in mice
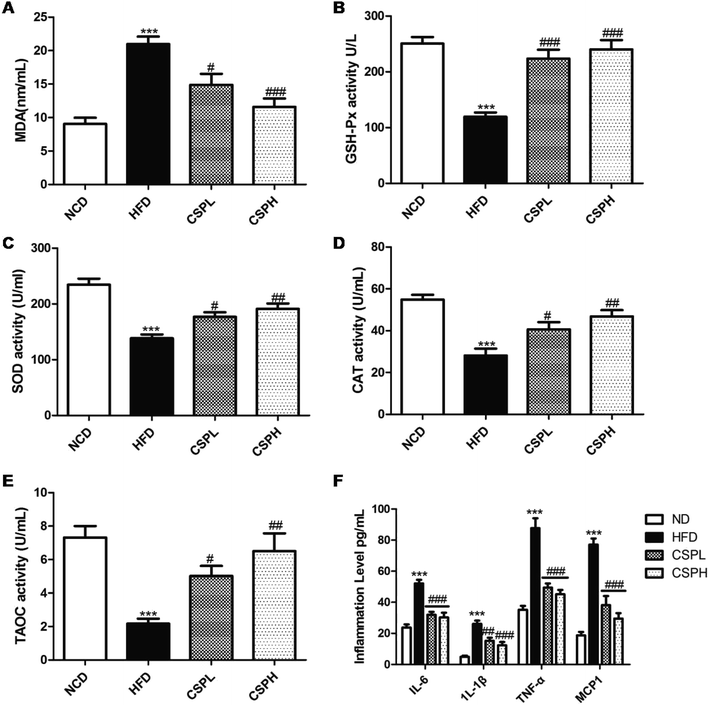
Obesity is always accompanied by the formation of oxygen free radicals, which can cause oxidative stress, and is linked to a low-grade chronic inflammatory hormonal change. Thus, to identify the potential mechanism of CSP on obesity, the antioxidant status, inflammation level, as well as the hormonal change were detected. Compared to the NCD group, the HFD-fed group displayed a significant increase in the MDA and down-regulation of the antioxidant enzyme activities of GSH-Px, SOD, CAT, and TAOC. On the other hand, the administration of CSPL and CSPH reversed the trends and significantly improved these antioxidant enzyme activities, which caused an obvious decline in MDA. No obvious dose-dependent effect was observed (Fig. 4A–E). Meanwhile, 10 weeks HFD led to a significant increase in the systematic inflammation cytokines, including IL-6, TNF-α, IL-1β, and MCP-1. In contrast, both the dietary CSPL and CSPH could dramatically reduce the levels of these inflammations (Fig. 4F). Furthermore, a prominent elevation in leptin and decline in adiponectin (ADPN) were observed in the serum of HFD-fed mice, which was significantly ameliorated by CSPL and CSPH supplementation (Fig. S2†).3.5 CSP regulated the gene expressions involved in lipid and cholesterol metabolism and enhanced the level of GPX4
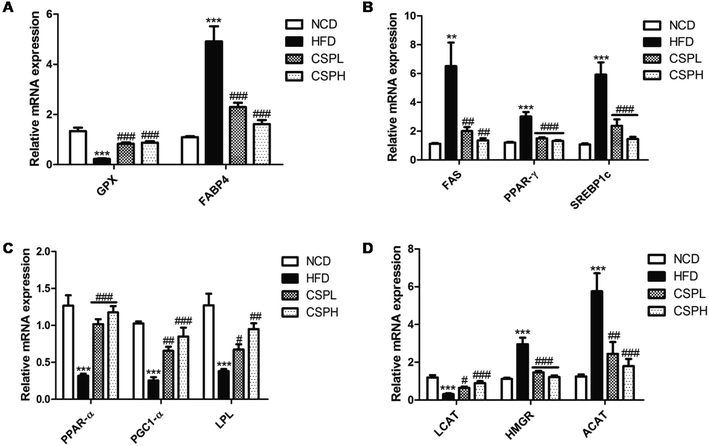
To investigate the molecular mechanisms of CSP that ameliorated HFD-induced lipid metabolic disorders, the mRNA expression levels of several genes related to lipid and cholesterol metabolism were quantified by RT-qPCR. Compared to the NCD groups, the lipid transport gene (FABP4), the lipogenesis genes (FAS, PPAR-γ, and SREBP1C), and the cholesterol metabolism genes (HMGR and ACAT) were significantly upregulated in the liver tissues of HFD-fed groups, whereas the selenium-containing antioxidant enzyme gene (GPX), the lipolysis genes (PPAR-α, PGC1-α, and LPL), and cholesterol acyltransferase gene (LCAT) were dramatically downregulated in the HFD-fed groups. Corresponding to the decrease in fat accumulation, CSP supplementation significantly suppressed the gene expression of FAB4, FAS, PPAR-γ, SREBP1C, HMGR, and ACAT compared to the HFD groups. More interestingly, CSP supplementation distinctly increased the expression of GPX, PPAR-α, PGC1-α, LPL, and LCAT (Fig. 5A–D). Collectively, these data indicated that CSP supplementation ameliorated the lipid accumulation and cholesterol metabolism via the suppression of lipid synthesis, thus promoting lipid lysis and affecting cholesterol synthesis. No significant dose-dependent difference in CSP was observed. Moreover, to determine whether CSP supplementation can enhance the level of selenoproteins, the key selenoprotein GPX4 was analyzed. The results of western blotting showed that compared to the NCD group, the protein expression of GPX4 was significantly decreased in the HFD groups, while CSP reversed the situation and exhibited a dose-dependent effect (Fig. S3†).3.6 CSP restored HFD-induced intestinal barrier permeability in mice
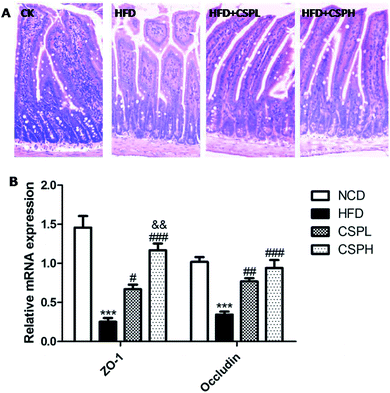
Intestinal barrier integrity has been demonstrated to be of vital importance for human health, which can be destroyed by the HFD-induced gut microbiota dysbiosis. As shown in Fig. 6A, the histological morphology of ileum was detected by H&E staining. Compared to the NCD groups, the HFD-fed mice exhibited decreased villus height, more fracture, and increased crypt depth. Obviously, CSPL and CSPH significantly ameliorated the intestinal impairment caused by HFD. Furthermore, the relative gene expression of tight junction proteins ZO-1 and occludin were determined, which were considered as important biomarkers for the integrity and barrier function of the intestinal. Consistent with the morphology, the HFD-fed mice displayed a significant suppression of the expression of ZO-1 and occludin. On the other hand, compared to the HFD groups, CSPL and CSPH supplementation remarkably upregulated ZO-1 and occludin. A dose-dependent effect of CSP on ZO-1 was observed (Fig. 6B).3.7 CSP modulated the composition of gut microbiota in HFD-induced mice
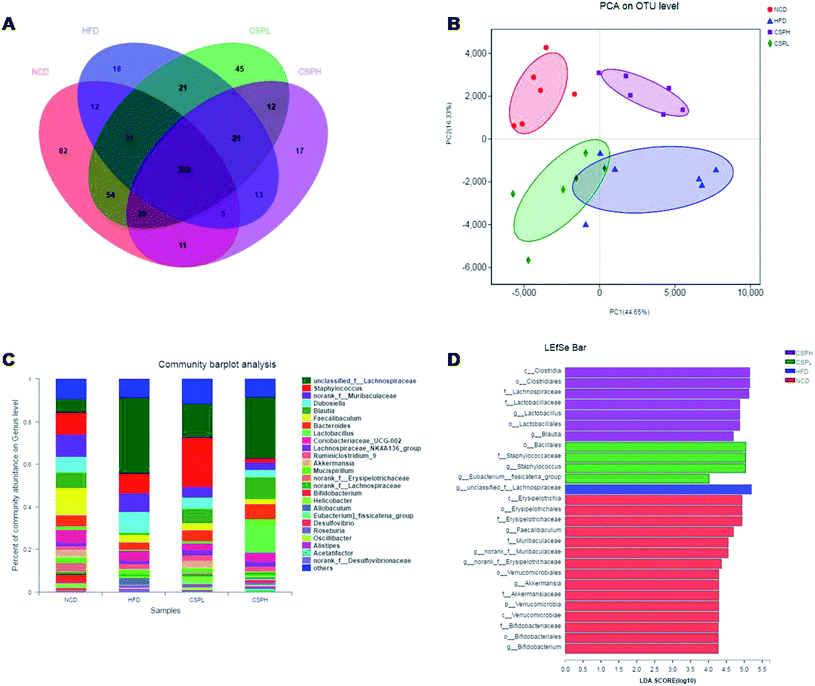
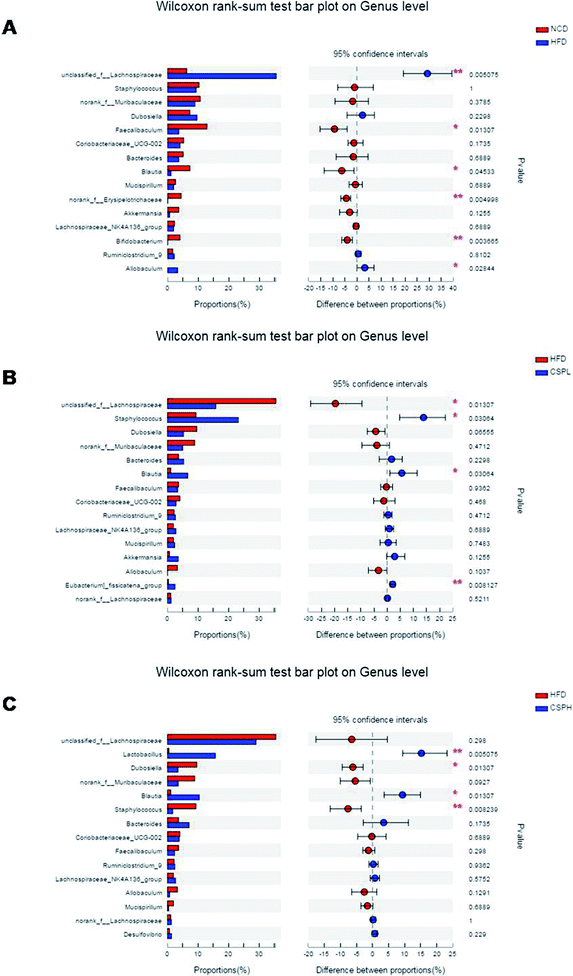
A great deal of evidence indicates that the gut microbiota plays a significant role in the development of obesity and its associated diseases. To investigate whether CSP supplementation could directly impact the composition of gut microbiota, the V3–V4 regions of 16S rDNA were amplified and sequenced on an Illumina MiSeq platform. In all the detected OTUs, 352 were shared by all the groups. The unique OTUs were 82, 18, 45, and 17 in NCD, HFD, CSPL, and CSPH, respectively (Fig. 7A).The effects of CSP on the alpha diversity of the gut microbiota are presented in Fig. S4.† Compared to the NCD group, the HFD-fed mice exhibited a lower richness and diversity of the gut microbiota, as evidenced by the significant decrease in the Chao, Shannon, Ace, and Simpson indexes, some of which were partly restored by the CSPL supplementation such as Chao and Shannon. However, no significant difference was observed in the CSPH mice (Fig. S4†). Principal analysis and principal coordinates analysis (PCoA) based on Bray–Curtis distances showed a distinct clustering of the microbiota composition for each treatment group, indicating significantly different β-diversity in response to HFD feeding and CSP supplementation (Fig. 7B and S5†).Taxon-based analysis revealed changes in the microbiota composition after CSP supplementation. At the phylum level, Firmicutes, Bacteroidetes, and Actinobacteria were the dominant phyla in all the groups. The abundance of Firmicutes was significantly increased in the HFD-fed mice compared to the NCD group (Fig. S6†). CSP supplementation did not reverse the increase in the Firmicutes induced by HFD and showed no significant change in the other phyla. However, at the genus level, all the four groups were distinct from each other (Fig. 7C). A heatmap with hierarchical clustering of the top 35 different bacterial abundances is shown in Fig. S7.† Furthermore, LEfSe analysis explored the key phylotypes that were significantly altered in response to HFD-feeding and CSP supplementation (Fig. 7D and S8†). Compared to the NCD groups, the HFD-fed mice showed a significant increase in unclassified_f__Lachnospiraceae and Allobaculum but a marked reduction in Faecalibaculum, Blautia, norank_f__Erysipelotrichaceae, and Bifidobacterium. Such changes were partially reversed by CSPL supplementation by changing the level of Blautia and unclassified_f__Lachnospiraceae. However, a significant upregulation of Staphylococcus and [Eubacterium]_fissicatena_group was also observed in the CPSL group. On the other hand, CSPH supplementation not only distinctly boosted the abundance of SCFA-producing Blautia but also dramatically increased Lactobacillus and decreased Staphylococcus and Dubosiella compared to the HFD group (Fig. 8A–C). The significant difference between CSPL and CSPH in the change of microbiota composition indicated a dose-dependent effect. Collectively, these results demonstrated that CSP supplementation could modulate the gut microbiota composition in HFD-fed mice.
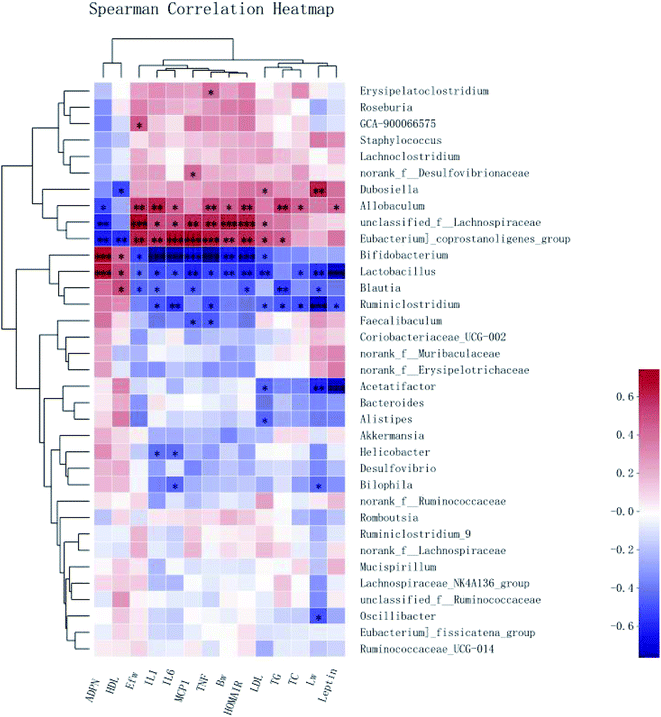
To demonstrate the potential associations between the changes in the gut microbiota composition and the obesity-related metabolic parameters, Spearman correlation analysis was performed at the genus level. Significant correlations between the obesity-related metabolic parameters (the weight of the body, liver, and epididymal fat; HOMA-IR value; the hormone levels of Leptin and ADPN; serum levels of TG, TC, HDL, LDL, MCP-1, IL-1β, TNF-α, and IL-6) and the abundance of a variety of bacteria were revealed by the heat map (Fig. 9).The HFD-enriched unclassified_f__Lachnospiraceae showed strong positive correlations with the weight of the body and epididymal fat, HOMA-IR value, and serum levels of MCP-1, IL-1β, TNF-α, and IL-6. Another enriched Allobaculum had positive correlations with almost all the indices except the liver weight, LDL, and MCP-1. Besides, both unclassified_f__Lachnospiraceae and Allobaculum had a negative correlation with the production of ADPN. However, Blautia enriched in the CSPL and CSPH groups had significant negative correlations with the liver weight and serum levels of TG, TC, LDL, IL-1β, TNF-α, and IL-6, as well as the leptin level. On the other hand, the high upregulation of Lactobacillus exhibited a significant negative association not only with the increased weight of the body, liver, and epididymal fat, serum levels of TC, MCP-1, IL-1β, TNF-α, and IL-6 but also with the insulin resistance (HOMA-IR value) and leptin level. In addition, a positive association with the serum levels of HDL and ADPN was also observed. Altogether, the results indicated that Blautia and Lactobacillus might play an important role in the prevention of obesity and related metabolic disorders.
4. Discussion
Obesity is becoming one of the major prevailing health-care problems worldwide, which is associated with a wide spectrum of metabolic disorders. Excessive fat accumulation and insulin resistance are the two main pathological phenotypes of obesity, which increase the risk of hyperglycemia, dyslipidemia, and hypertension, leading to type 2 diabetes mellitus and cardiovascular diseases.17–19 The mechanism that links obesity to related chronic diseases has not been fully elucidated. However, a lot of evidence indicates that chronic inflammation and oxidative stress produced by the excessive expansion of the adipose tissue, especially the visceral fat, play a crucial role in the development of insulin resistance and obesity-related metabolic complications.20–22 Hence, target inflammation and oxidative stress may be potential effective methods to ameliorate this problem.In the present study, the protective effects of Se-enriched peptides digested from a novel Se hyperaccumulation plant, C. violifolia, on obesity and its related metabolic disorders were systematically assessed. To the best of our knowledge, this research is the first to demonstrate that the supplementation of the new Se source-CSP could ameliorate overweight gain, excess fat accumulation, lipid metabolism disorders, obesity-induced insulin sensitivity, as well as liver steatosis. A low Se treatment CSPL (containing 26 μg Se per kg bw per d) equal to 200 μg d−1 for the adult and a high Se treatment (containing 104 μg Se per kg bw per d) CSPH equal to 800 μg d−1 for the adult were performed. Both the treatments exhibited the protective effect, especially CSPH, which was reflected in the better capacity to improve the glucose metabolism and insulin resistance. Interestingly, the food consumption and energy intake were similar in the HFD and HFD + CSP groups, thus suggesting that the beneficial effects of CSP on obesity were not related to a reduction in energy utilization. But the upregulation of UCP1 by CSP, which is the key biomarker that plays a vital role in BAT activation and WAT browning, implied a high energy expenditure that indicated the increasing evidence for the prevention and treatment of obesity through the induction of the UCP1 expression.23,24 Another reason was probably because CSP enhanced the antioxidant enzyme activity including GSH-Px, SOD, CAT, and TAOC, decreased the MDA level, and consequently, led to a reduction in the oxidative stress, which was also associated with the production of inflammation. As expected, compared to the HFD groups, CSP supplementation significantly decreased the inflammation aggravation of MCP-1, IL-1β, TNF-α, and IL-6, which could contribute to the development of insulin resistance.25,26
More intriguingly, supplementation with CSP dramatically reduced the gene expression involved in the transportation and biosynthesis of lipid and cholesterol such as FABP4, FAS, SREBP1c, PPAR-γ, HMGR, and ACAT in the liver. SREBP1c is a membrane-bound transcriptional factor, which plays a key role in lipid metabolism. The activation of SREBP-1c up-regulates the key enzymes in sterol biosynthesis,27 while PPAR-γ as a nuclear hormone receptor is mainly present in adipose tissue and the liver, which regulates triglyceride homeostasis and lipid biosynthesis.28 Another key enzyme is HMGR, which is a rate-limiting reductase for cholesterol synthesis, and the downregulation of its activity contributes to the reduction of cholesterol synthesis.29 Meanwhile, an obvious upregulation of PPAR-α, PGC1-α, LPL, and LCAT, which are involved in lipolysis, free fatty acid oxidation, and cholesterol esterification, was observed. PPAR-α is another predominant transcriptional factor, which plays a fundamental role in the control of lipid homeostasis by directly regulating the genes involved in lipolysis, free fatty acid oxidation, and cholesterol metabolism.30 Besides, as a new Se source, CSP supplementation also increased the expression of the key antioxidant selenoenzyme GPX4, which can protect the cell from lipid peroxidation and further fat deposition, thus exhibiting a good role of contributing to the synthesis of selenoproteins. Collectively, these results were consistent with the data of serum lipid profile and liver fat accumulation, indicating that the modulation of hepatic steatosis by CSP could be attributed to the inhibition of lipogenesis, and the promotion of lipid oxidation and lysis.
Another key point is that a growing body of evidence indicates that obesity and related metabolic disorders are also strongly associated with the dysbiosis of the gut microbiota, which can be induced by HFD diet that disturbs the energy homeostasis and glucose metabolism of the host.31 Several studies have reported that Se could reduce the gut inflammation and modulate the gut microbiota.32,33 However, few reports have focused on the effect of Se on the regulation of gut microbiota in the HFD-induced obesity model. The present study demonstrated that CSP supplementation could effectively modulate the HFD-induced dysbiosis of gut microbiota. The results showed that supplementation with CSPL significantly increased the α-diversity in the HFD-fed mice, while no obvious change was observed with CSPH. However, both CSPL and CSPH supplementation exhibited distinct β-diversity from the HFD groups, suggesting different changes in the gut microbiota composition in response to HFD and CSP. An increase in the abundance of Firmicutes in all the HFD-fed mice and no significant change in the Bacteroides after CSP supplementation were also observed. It has been reported that in obese humans and animals, the gut microbiota is characterized by an increased ratio of Firmicutes/Bacteroidetes (F/B), indicating that the two major phyla might play important roles in the development of obesity.3 However, controversially, some studies have also indicated that the prevention of obesity was not associated with the change in the F/B ratio.34,35
Despite no significant difference at the phylum level, a series of specific species at the genus level positively correlated with obesity and obesity-related physiological parameters were found. Unclassified_f__Lachnospiraceae and Allobaculum were enriched in the HFD-fed groups, whereas Blautia and Bifidobacterium were markedly decreased. Interestingly, CSP supplementation restored Blautia, which is a SCFAs-producing genus. There are many evidences that prove that Blautia is positively correlated with metabolic homeostasis. It could be improved by the intervention of prebiotic and some plant compounds, which contributed to the alleviation of inflammation, insulin resistance, and obesity.34,36 Consistent with the previous studies, the protective effect of CSP on diet-induced obesity might be via the promotion of this beneficial gut bacteria. Moreover, a distinct increase in Lactobacillus, which is also positively correlated with obesity, was independently discovered in the CSPH groups. Lactobacillus can convert sugars to lactic acid, which is generally believed to be a beneficial bacterium. Accumulating evidence indicates that Lactobacillus could improve host physiology and lipid metabolism, which is associated with reduced levels of serum cholesterol and decreased body fat.37 Some studies have also proved that an increase in Lactobacillus could reduce intestinal endotoxin, alleviate metabolic syndrome, and suppress obesity-related inflammation.35,38 Therefore, the relatively better effects of CSPH on metabolic disorders might be through the synergism of Blautia and Lactobacillus. In line with the change in the gut microbiota composition, CSP supplementation also exhibited a better intestinal integrity than the HFD groups, and significantly increased the expression of epithelial tight junction proteins ZO-1 and occludin to protect the intestinal permeability. Extensive research has indicated that HFD-induced obesity could increase the intestinal permeability, while SCFAs produced by some beneficial bacteria might suppress inflammation and improve barrier function.17,39 Thus, the increased Blautia by CSP might be involved in the maintenance of intestinal integrity.
As discussed above, it seemed that CSPL and CSPH had similar anti-obesity effects without dose dependence. The reason might be due to the oversaturation of the relative Se, which did not increase the activities of the antioxidant enzymes any more. However, it should be noted that CSPH was more effective at preventing insulin resistance and fat accumulation than CSPL. There were also some phylotypes that showed significant differences between CSPL and CSPH, and among them, Lactobacillus might have a potential capacity to improve the insulin resistance, which increases the striking application of CSPH. Besides, it has always been known that the safety range of Se is very narrow; chronic toxicity occurs when the Se intake is more than 400 μg per day,40 while the dose of CSPH was equal to 800 μg per day per person, which showed no obvious toxicity (data not shown). Another controversial point is that high Se content may cause increased risk of type 2 diabetes;41 however, in our study, CSPH significantly improved the glucose metabolism. These might be attributed to the different Se forms in CSP and the different metabolic pathway. Nevertheless, further study should be performed to compare the anti-obesity effects of CSP with normal peptides from CSP and other different Se forms, which could be helpful in understanding the underlying mechanisms and for choosing the optimal dose for the development of a new Se supplement.
In conclusion, both CSPL and CSPH supplementation could effectively prevent HFD-induced body weight gain, excess fat accumulation, lipid metabolism disorders, obesity-induced insulin sensitivity, as well as liver steatosis. The underlying mechanism is likely associated with increased thermogenesis, reduced oxidative stress, and inflammation by CSP, which regulated the gene expression in lipid and cholesterol metabolism. Along with this process, the modulation of gut microbiota composition was observed. The SCFAs-produced Blautia enriched in the CSP groups might be involved in the metabolic improvement and the gut integrity maintenance. A remarkable increase in Lactobacillus in the CSPH group might have a synergistic effect with Blautia, which enhanced the capacity of CSP to ameliorate fat accumulation and insulin resistance.
These findings offer new evidences of the anti-obesity effect of dietary CSP, which can be developed as a new functional Se supplement in the future. However, further investigations are necessary to define the precise mechanism of the specific functional ingredients in CSP.
Abbreviations
| ACAT | Acetyl-CoA acetyltransferase |
| ADPN | Adiponectin |
| ANOVA | Analysis of variance |
| BAT | Brown adipose tissue |
| CAT | Catalase |
| CSPL | Low concentration of selenium-enriched peptides from Cardamine violifolia |
| CSPH | High concentration of selenium-enriched peptides from Cardamine violifolia |
| eWAT | Epididymal white adipose tissue |
| FAB4 | Fatty acid binding protein 4 |
| FAS | Fatty acid synthase |
| GSH-Px | Glutathione peroxidase |
| HDL | High-density lipoprotein |
| H&E | Hematoxylin and eosin |
| HFD | High-fat diet |
| HMGR | 3-Hydroxy-3-methylglutaryl coenzyme A reductase |
| HOMA-IR | Homeostasis model assessment of insulin resistance |
| LCAT | Lecithin-cholesterol acyltransferase |
| LDA | Linear discriminant analysis |
| LDL | Low-density lipoprotein |
| LEfSe | LDA effect size |
| LPL | Lipo-protein lipase |
| MCP-1 | Monocyte chemoattractant protein-1 |
| MDA | Malondialdehyde |
| NCD | Normal control diet |
| OTUs | Operational taxonomic units |
| OGTT | Oral glucose tolerance test |
| PCA | Principal component analysis |
| PCoA | Principal coordinate analyses |
| PGC1 | PPAR-γ coactivator 1 |
| PPAR-α | Peroxisome proliferator activated receptor alpha |
| PPAR-γ | Peroxisome proliferator activated receptor gamma |
| SCFAs | Short-chain fatty acids |
| SOD | Superoxide dismutase |
| SREBP-1c | Sterol regulatory element binding protein-1c |
| TAOC | Total antioxidant capacity |
| TC | Total cholesterol |
| TG | Triglyceride |
| ZO-1 | Zonula occludens-1 |
Author contributions
T. Y. and J. G carried out the experiments and wrote the paper. S. Z., M. L., Z. Z., S. W., and S. C, did some data analysis work and edited the paper. Y. S. and X. C. designed the study and interpreted the results. All authors read and approved the final version of this manuscript.Conflicts of interest
The authors declare that there are no conflicts of interest.Acknowledgements
This research was supported in part by the Enshi Major Special Project of Science and Technology Support (D20190016); Academician and Expert Workstation Project of Enshi Se-Run Health Tech Development Co., Ltd; The Open Research Fund Program of Beijing Key Lab of Plant Resource Research and Development, Beijing Technology and Business University, PRRD-2019-YB6; and Natural Science Foundation of the Jiangsu Higher Education Institutions of China (18KJB180001).References
- J. L. Sonnenburg and F. Backhed, Nature, 2016, 535, 56–64 CrossRef PubMed.
- M. J. Khandekar, P. Cohen and B. M. Spiegelman, Nat. Rev. Cancer, 2011, 11, 886–895 CrossRef CAS PubMed.
- P. J. Turnbaugh, R. E. Ley, M. A. Mahowald, V. Magrini, E. R. Mardis and J. I. Gordon, Nature, 2006, 444, 1027–1031 CrossRef.
- S. Furukawa, T. Fujita, M. Shimabukuro, M. Iwaki, Y. Yamada, Y. Nakajima, O. Nakayama, M. Makishima, M. Matsuda and I. Shimomura, J. Clin. Invest., 2004, 114, 1752–1761 CrossRef CAS PubMed.
- S. Gesta, Y. H. Tseng and C. R. Kahn, Cell, 2007, 131, 242–256 CrossRef CAS PubMed.
- D. E. Lackey and J. M. Olefsky, Nat. Rev. Endocrinol., 2016, 12, 15–28 CrossRef CAS PubMed.
- A. R. Saltiel and C. R. Kahn, Nature, 2001, 414, 799–806 CrossRef CAS PubMed.
- S. E. Shoelson, L. Herrero and A. Naaz, Gastroenterology, 2007, 132, 2169–2180 CrossRef CAS.
- M. P. Rayman, Lancet, 2012, 379, 1256–1268 CrossRef CAS.
- Y. Wang, X. Gao, P. Pedram, M. Shahidi, J. Du, Y. Yi, W. Gulliver, H. Zhang and G. Sun, Nutrients, 2016, 8(1), 24 CrossRef.
- J. Gao, Y. Liu, Y. Huang, Z. Q. Lin, G. S. Bañuelos, M. H. Lam and X. Yin, Food Chem., 2011, 126(3), 1088–1093 CrossRef CAS.
- X. Zhao, Q. Zhao, H. Chen and H. Xiong, Food Chem., 2019, 272, 201–209 CrossRef CAS PubMed.
- M. Schiavon and E. A. Pilon-Smits, New Phytol., 2017, 213, 1582–1596 CrossRef CAS PubMed.
- L. Yuan, Y. Zhu, Z. Q. Lin, G. Banuelos, W. Li and X. Yin, PLoS One, 2013, 8, e65615 CrossRef CAS PubMed.
- S. Zhu, C. Du, T. Yu, X. Cong, Y. Liu, S. Chen and Y. Li, J. Food Sci., 2019, 84, 3504–3511 CrossRef CAS PubMed.
- X. M. W. W. Wei and Y. J. Li, Methodology of pharmacological experiment, People's Medical Publishing House, China, 2016 Search PubMed.
- E. E. Canfora, J. W. Jocken and E. E. Blaak, Nat. Rev. Endocrinol., 2015, 11, 577–591 CrossRef CAS.
- S. E. Kahn, R. L. Hull and K. M. Utzschneider, Nature, 2006, 444, 840–846 CrossRef CAS.
- G. I. Shulman, N. Engl. J. Med., 2014, 371, 2237–2238 CrossRef.
- A. Carrier, Antioxid. Redox Signaling, 2017, 26, 429–431 CrossRef CAS.
- C. N. Lumeng and A. R. Saltiel, J. Clin. Invest., 2011, 121, 2111–2117 CrossRef CAS PubMed.
- F. McMurray, D. A. Patten and M. E. Harper, Obesity, 2016, 24, 2301–2310 CrossRef CAS.
- F. Zhou, J. Guo, X. Han, Y. Gao, Q. Chen, W. Huang, J. Zhan, D. Huang and Y. You, J. Nutr., 2020, 150(8), 2131–2138 CrossRef PubMed.
- B. Guo, B. Liu, H. Wei, K. W. Cheng and F. Chen, Mol. Nutr. Food Res., 2019, 63, e1800808 CrossRef.
- P. V. Dludla, B. B. Nkambule, B. Jack, Z. Mkandla, T. Mutize, S. Silvestri, P. Orlando, L. Tiano, J. Louw and S. E. Mazibuko-Mbeje, Nutrients, 2018, 11(1), 23 CrossRef.
- J. M. Olefsky and C. K. Glass, Annu. Rev. Physiol., 2010, 72, 219–246 CrossRef CAS PubMed.
- X. Wang, R. Sato, M. S. Brown, X. Hua and J. L. Goldstein, Cell, 1994, 77, 53–62 CrossRef CAS.
- R. M. Evans, G. D. Barish and Y. X. Wang, Nat. Med., 2004, 10, 355–361 CrossRef CAS PubMed.
- I. Garcia, Y. Fall and G. Gomez, Curr. Top. Med. Chem., 2012, 12, 895–919 CrossRef CAS.
- C. Duval, M. Muller and S. Kersten, Biochim. Biophys. Acta, 2007, 1771, 961–971 CrossRef CAS.
- C. Sanmiguel, A. Gupta and E. A. Mayer, Curr. Obes. Rep., 2015, 4, 250–261 CrossRef PubMed.
- M. V. Kasaikina, M. A. Kravtsova, B. C. Lee, J. Seravalli, D. A. Peterson, J. Walter, R. Legge, A. K. Benson, D. L. Hatfield and V. N. Gladyshev, FASEB J., 2011, 25, 2492–2499 CrossRef CAS.
- S. C. Qixiao Zhai, Li Peng, F. Tian, J. Zhao, H. Zhang and W. Chen, Environ. Sci. Technol. Lett., 2018, 5(12), 724–730 CrossRef.
- L. Zhang, M. Shi, J. Ji, X. Hu and F. Chen, FASEB J., 2019, 33, 10339–10352 CrossRef CAS PubMed.
- M. Zhao, H. Cai, Z. Jiang, Y. Li, H. Zhong, H. Zhang and F. Feng, Mol. Nutr. Food Res., 2019, 63, e1801417 CrossRef PubMed.
- Y. Li, Y. Cui, X. Hu, X. Liao and Y. Zhang, Mol. Nutr. Food Res., 2019, 63, e1801219 CrossRef PubMed.
- O. l. Le Zhao, Q. Zhang, W. Ma, F. Tian, H. Shenc and M. Zhou, Food Funct., 2017, 8, 4644–4656 RSC.
- C.-N. Shi-Yu Cao, X.-Y. Xu, G.-Y. Tang, H. Corke, R.-Y. Gan and H.-B. Li, Trends Food Sci. Technol., 2019, 92, 194–204 CrossRef.
- D. A. Winer, H. Luck, S. Tsai and S. Winer, Cell Metab., 2016, 23, 413–426 CrossRef CAS PubMed.
- N. Solovyev, E. Drobyshev, G. Bjorklund, Y. Dubrovskii, R. Lysiuk and M. P. Rayman, Free Radical Biol. Med., 2018, 127, 124–133 CrossRef CAS PubMed.
- M. P. Rayman and S. Stranges, Free Radical Biol. Med., 2013, 65, 1557–1564 CrossRef CAS PubMed.
Footnotes |
| † Electronic supplementary information (ESI) available. See DOI: 10.1039/d0ra04209a |
| ‡ The authors contributed equally to this study. |
| This journal is © The Royal Society of Chemistry 2020 |

