 Open Access Article
Creative Commons Attribution 3.0 Unported Licence
Synthesis of BaTiO3 nanoparticles as shape modified filler for high dielectric constant ceramic–polymer composite†
Taehee Kim ab,
Hanwhuy Limac,
Youngkwan Lee
 *b and
Baek-Jin Kim
 *a
*a
aKorea Institute of Industrial Technology (KITECH), Cheonan, South Korea. E-mail: bjkim@kitech.re.kr
bDepartment of Chemical Engineering, Sungkyunkwan University, Suwon, South Korea
cDepartment of Chemical and Biomolecular Engineering, Yonsei University, Seoul, South Korea
First published on 7th August 2020
Abstract
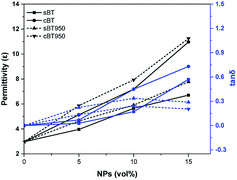
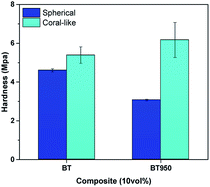
Coral-like structured barium titanate (BaTiO3) nanoparticles were synthesized as filler for a high dielectric elastomer. The nanoparticle size, and shape, and the reactivity of the synthesis were modified according to temperature, time, pH, and precursor materials. Dielectric properties of poly(dimethylsiloxane) (PDMS) composites were estimated by volume fractions of BaTiO3 of 5, 10, and 15 vol% for both sphere and coral-like shapes. As a result, coral-like BaTiO3–PDMS composites had the highest dielectric constant of 10.97, which was 64% higher than the spherical BaTiO3–PDMS composites for the 15 vol% fraction. Furthermore, the phase transition process and surface modification were applied to increase the dielectric properties through calcination and improved particle dispersion in the elastomer using polyvinylpyrrolidone (PVP). The dispersion of the PVP coated BaTiO3–PDMS composite was improved compared to pristine BaTiO3 as shown by SEM imaging. The coral-like BaTiO3 embedded composite could be used for electronic devices such as piezoelectric devices or electro-adhesive grippers, which require flexible and high dielectric materials.
1. Introduction
Robotic arm grippers use various energy sources including motors, electrical power, and vacuum adsorption. However, there is a limitation in the application on flat surfaces or atypical objects.1 On the other hand, the use of adhesive force could allow atypical objects and flat films to be lifted.2 An electro-adhesive force occurs when a voltage is applied to an electrode pattern, which forms an interdigitated pattern, generating an electric force to lift an object.3 Basically the force of electro-adhesion was calculated though the following equations.where ε is the dielectric permittivity of insulated layer, A is the area of the electrode, and V, d are the applied voltage difference and the equivalent gap between the electrodes. These parameters are related to each other. For example, the limitation of applied voltage (V) are depending on d and ε, and A and d are inversely related to each other within a certain area. Most of recent studies about electro-adhesive gripper were mainly related to A, V, and d except ε.1–5 To increase dielectric permittivity, many people use dielectric materials such as TiO2, ZrO2, and BaTiO3, amongst others.6 BaTiO3 (BT) is of particular interest due to its perovskite structure and high dielectric constant of more than 1000, which is significantly higher than other ceramics, for example, 3.9 for SiO2.7,8 BT is used in fields requiring high piezoelectricity and high dielectric constants because of its polarization inversion and high dielectric constant.9 However, the material for the insulating layer needs to be flexible and stretchable in order to grab the various shaped objects. In many studies of high dielectric constant composites, polyvinylidene fluoride (PVDF) with a relatively high dielectric constant has been used among polymer materials,10,11 however, it is not suitable to apply on grippers used for atypical objects because of its poor elasticity. PDMS is one of the suitable polymers which has a low elastic modulus E of approximately 0.002 Gpa and is easy to fabricate as a composite.12 Therefore, in this research, BT nanoparticles (NPs) and PDMS were compounded as a material for an insulating layer on an electric pattern. Moreover, when BT is formed as a tetragonal structure, spontaneous polarization is formed along the c-axis. It has been shown that this structure has a higher dielectric constant than a cubic structure where spontaneous polarization does not appear.13 One of the methods to obtain a phase transition is via calcination which changes the lattice structure by applying high heat over a critical point.14 Calcination is a heat treatment process in which the phase transition is obtained by heating below the melting point. In order to have a high dielectric constant, this study aimed to increase the dielectric constant by phase transition of BT from the cubic to the tetragonal structure. However, when compounding BT and PDMS, the two materials do not mix uniformly and NPs sink or agglomerate due to low interfacial adhesion between NPs and PDMS.15,16 To solve this problem, NPs were modified by polyvinylpyrrolidone (PVP) which is often used as a stabilizer.17–20 BT was synthesized by the hydrothermal method, which allows for synthesis in various particle forms, for example, spherical shape, coral-like shape and rod-like shape.21–23 In particular, spherical BT have been used in many studies for composites with high dielectric constants, and in the case of rod-like shape BT, many studies have investigated the aspect ratio which affects the dielectric constant.24,25 On the other hand, few studies have investigated composites of BT in the coral-like form,26 and the dielectric properties of BT dispersed in PDMS elastomer have rarely been reported. A coral-like morphology is expected to have a larger surface area than spherical NPs, and the shape is expected to affect the reaction with the polymer matrix, the dielectric properties, and the dispersion. Therefore, in this study, BT were synthesized with a coral-like shape, and a phase transition and surface modification was used to improve the properties of BT–PDMS composites for use as dielectric elastomers. Previous research used spherical and rod-shape NPs as dielectric composite fillers, but this study focused on newly shaped filler, coral-like BT, which were rarely studied in the dielectric field. The coral-like BT composite showed better dielectric properties than the spherical BT composite and it could be considered as the effect of large surface area. It is important to have high dielectric properties and stretchability of dielectric composite for the applications such as soft-robotic gripper for lifting atypical objects. Thus, the PDMS elastomer was used instead of PVDF which was widely used as a dielectric matrix. In order to solve the NPs aggregation and agglomeration in polymer, which can be a fatal defect in the ceramic–polymer composite, a chemical treatment of surface modification was performed to obtain a composite in which NPs were uniformly dispersed in the matrix. The dispersion of NPs and the dielectric constant were measured precisely according to the shape and synthesis conditions of the BT.
2. Experimental
2.1 Materials
Titanium(IV) butoxide (Ti(C4H9O)4, reagent grade, 97%), barium chloride dihydrate (BaCl2·2H2O, ACS reagent, ≥99%), barium nitrate (Ba(NO3)2, ACS reagent, ≥99%), polyvinylpyrrolidone ((C6H9NO)n, Mw = 10![[thin space (1/6-em)]](https://www.rsc.org/images/entities/char_2009.gif) 000), acetic acid (CH3COOH, glacial, ACS reagent, ≥99.7%) was purchased from Sigma-Aldrich (Saint Louis, USA). Barium hydroxide monohydrate (Ba(OH)2·H2O, 95%) was purchased from Alfa Aesar (Massachusetts, USA), sodium hydroxide, bead (NaOH, >98.0%), hydrogen peroxide (H2O2, 34.5%), ethyl alcohol (EtOH, C2H5OH, 94.5%) and isopropyl alcohol (C3H7OH, 99.5%) were purchased from Samchun Chemicals (Pyeongtaek-si, South Korea). Poly(dimethylsiloxane) (PDMS, (C2H6OSi)n, Sylgard™ 182 Silicone Elastomer) was purchased from Dow Silicones Corporation (Midland, MI USA), barium titanate (Spherical BT, 99.9%, 100 nm, Cubic) was purchased from US Research Nanomaterials, Inc. (Houston, TX USA). Deionized water (DI water) was used.
000), acetic acid (CH3COOH, glacial, ACS reagent, ≥99.7%) was purchased from Sigma-Aldrich (Saint Louis, USA). Barium hydroxide monohydrate (Ba(OH)2·H2O, 95%) was purchased from Alfa Aesar (Massachusetts, USA), sodium hydroxide, bead (NaOH, >98.0%), hydrogen peroxide (H2O2, 34.5%), ethyl alcohol (EtOH, C2H5OH, 94.5%) and isopropyl alcohol (C3H7OH, 99.5%) were purchased from Samchun Chemicals (Pyeongtaek-si, South Korea). Poly(dimethylsiloxane) (PDMS, (C2H6OSi)n, Sylgard™ 182 Silicone Elastomer) was purchased from Dow Silicones Corporation (Midland, MI USA), barium titanate (Spherical BT, 99.9%, 100 nm, Cubic) was purchased from US Research Nanomaterials, Inc. (Houston, TX USA). Deionized water (DI water) was used.
2.2 Synthesis of coral-like BT precursors
Coral-like BT were synthesized by a hydrothermal method. First, DI water (56 ml) was added to a 100 ml volume PPL (poly-para-phenol) liner followed by NaOH with concentrations of 0.1 M (0.006 mol, 0.24 g), 0.3 M (0.018 mol, 0.72 g), 0.6 M (0.036 mol, 1.44 g), 0.9 M (0.054 mol, 2.16 g), and 1.2 M (0.072 mol, 2.88 g). When NaOH well dissolved, Ti(C4H9O)4 (0.009 mol, 3.06 ml) was added dropwise and stirred at 1200 rpm for 10 minutes. In order to obtain a molar ratio of Ti![[thin space (1/6-em)]](https://www.rsc.org/images/entities/char_2009.gif) :
:![[thin space (1/6-em)]](https://www.rsc.org/images/entities/char_2009.gif) Ba of 1
Ba of 1![[thin space (1/6-em)]](https://www.rsc.org/images/entities/char_2009.gif) :
:![[thin space (1/6-em)]](https://www.rsc.org/images/entities/char_2009.gif) 1, Ba(NO3)2 (0.009 mol, 2.35 g) was added and mixed for additional 20 minutes. Other Ba precursor materials, BaCl2·2H2O (0.009 mol, 2.20 g) and Ba(OH)2·H2O (0.009 mol, 1.70 g) were used for other Ba source conditions. After mixing, the PPL liner was placed in the hydrothermal reactor and put into an oven. The oven was set according to the reaction temperature (150–210 °C) and reaction time (6–24 h). After the reaction was completed, the reactor was cooled to room temperature and the solution was washed twice with acetic acid aqueous solution (5 vol%), to remove impurities remaining in the solution, and BaCO3 which is a side product during the hydrothermal reaction.27 The NPs were then washed with DI water and twice with EtOH. The washed NPs were then dried in a vacuum oven at 60 °C for 24 hours.
1, Ba(NO3)2 (0.009 mol, 2.35 g) was added and mixed for additional 20 minutes. Other Ba precursor materials, BaCl2·2H2O (0.009 mol, 2.20 g) and Ba(OH)2·H2O (0.009 mol, 1.70 g) were used for other Ba source conditions. After mixing, the PPL liner was placed in the hydrothermal reactor and put into an oven. The oven was set according to the reaction temperature (150–210 °C) and reaction time (6–24 h). After the reaction was completed, the reactor was cooled to room temperature and the solution was washed twice with acetic acid aqueous solution (5 vol%), to remove impurities remaining in the solution, and BaCO3 which is a side product during the hydrothermal reaction.27 The NPs were then washed with DI water and twice with EtOH. The washed NPs were then dried in a vacuum oven at 60 °C for 24 hours.
2.3 Phase transition of BT
Calcination was used as the method for the phase transition of the BT with different shape of NPs, the pristine spherical BT (sBT) and pristine coral-like BT (cBT), respectively. sBT were used by purchasing a cubic structure of 100 nm size. Calcination of pristine BT was carried out in a tube furnace (model TF830, LAB HOUSE) at reaction temperatures 750–950 °C and reaction times 6–15 h in an air atmosphere. Calcination of the cBT was carried out in a N2 atmosphere for 9 hours at 950 °C, and slowly cooled to room temperature after the reaction was completed. After cooling the NPs, they were stored in a desiccator to prevent the absorption of moisture from the air.2.4 Hydroxylation of calcined BT
Calcined BT are difficult to react with PVP due to the absence of OH functional groups on the surface which are mostly removed from the surface and lattice during calcination.28 Therefore, hydroxylation was performed to form OH groups on the NPs surface. The reaction sequence was carried out in a 3 neck round flask (250 ml) with H2O2 (aqueous solution, 34.5%) (3.29 mol, 100 ml), BT (0.018 mol, 4.29 g). A sonicator (model Power sonic 410, Hwashin Tech) was used for 30 minutes to disperse the NPs. The dispersed solution was refluxed for 6 hours at 106 °C. After the reaction was completed, the mixture was cooled to room temperature and centrifuged for 5 minutes at 5000 rpm using a centrifuge (model Supra 22K, Hanil Scientific Inc.) to obtain the extracted NPs. The NPs were then washed twice with DI water to remove impurities. Finally, they were dried for 12 hours at 80 °C in a vacuum oven.2.5 Surface modification of BT
After OH hydroxylation, the surface of the BT was modified with PVP. The molecular weight of PVP used in modification was 10![[thin space (1/6-em)]](https://www.rsc.org/images/entities/char_2009.gif) 000 g per mole (Scheme 1). Calcined BT was modified by PVP with BT
000 g per mole (Scheme 1). Calcined BT was modified by PVP with BT![[thin space (1/6-em)]](https://www.rsc.org/images/entities/char_2009.gif) :
:![[thin space (1/6-em)]](https://www.rsc.org/images/entities/char_2009.gif) PVP molar ratios of 10
PVP molar ratios of 10![[thin space (1/6-em)]](https://www.rsc.org/images/entities/char_2009.gif) :
:![[thin space (1/6-em)]](https://www.rsc.org/images/entities/char_2009.gif) 0.1, 10
0.1, 10![[thin space (1/6-em)]](https://www.rsc.org/images/entities/char_2009.gif) :
:![[thin space (1/6-em)]](https://www.rsc.org/images/entities/char_2009.gif) 0.5, 10
0.5, 10![[thin space (1/6-em)]](https://www.rsc.org/images/entities/char_2009.gif) :
:![[thin space (1/6-em)]](https://www.rsc.org/images/entities/char_2009.gif) 1 and 10
1 and 10![[thin space (1/6-em)]](https://www.rsc.org/images/entities/char_2009.gif) :
:![[thin space (1/6-em)]](https://www.rsc.org/images/entities/char_2009.gif) 2 in reaction. The reaction process is as follows. EtOH (99.5 ml) was placed in a round flask (250 ml) and BT (0.005 mol, 1.20 g) were added in a volume ratio of EtOH
2 in reaction. The reaction process is as follows. EtOH (99.5 ml) was placed in a round flask (250 ml) and BT (0.005 mol, 1.20 g) were added in a volume ratio of EtOH![[thin space (1/6-em)]](https://www.rsc.org/images/entities/char_2009.gif) :
:![[thin space (1/6-em)]](https://www.rsc.org/images/entities/char_2009.gif) BT (500
BT (500![[thin space (1/6-em)]](https://www.rsc.org/images/entities/char_2009.gif) :
:![[thin space (1/6-em)]](https://www.rsc.org/images/entities/char_2009.gif) 1). The NPs were then dispersed by sonication for 1 hour. Once the NPs were well dispersed in the solvent, the PVP was put into the sonicator at the desired molar ratio and sonicated for 1 hour. After the dispersion was completed, the reaction was performed for 24 hours at 540 rpm using a magnetic bar. The solution was then centrifuged at 5000 rpm for 20 minutes. To remove untreated NPs and impurities, the solution was washed twice with EtOH. After washing, the filtered NPs were dried at 80 °C for 24 hours in a vacuum oven. The dried NPs were slowly crushed with a mortar and pestle to separate the aggregated NPs.
1). The NPs were then dispersed by sonication for 1 hour. Once the NPs were well dispersed in the solvent, the PVP was put into the sonicator at the desired molar ratio and sonicated for 1 hour. After the dispersion was completed, the reaction was performed for 24 hours at 540 rpm using a magnetic bar. The solution was then centrifuged at 5000 rpm for 20 minutes. To remove untreated NPs and impurities, the solution was washed twice with EtOH. After washing, the filtered NPs were dried at 80 °C for 24 hours in a vacuum oven. The dried NPs were slowly crushed with a mortar and pestle to separate the aggregated NPs.
2.6 Preparation of BT–PDMS composites
For PDMS, the resin and curing agent were mixed at a recommended ratio of 10![[thin space (1/6-em)]](https://www.rsc.org/images/entities/char_2009.gif) :
:![[thin space (1/6-em)]](https://www.rsc.org/images/entities/char_2009.gif) 1. The procedure for making composites is as follows. First, PDMS resin and BT were mixed with a spatula to separate agglomerated NPs. BT was then mixed with PDMS elastomer until a practicable maximum volume value of 15 vol%. It was difficult to operate at higher than 15 vol% due to the high viscosity. After that, a planetary mixer (model ARE-310, THINKY Corporation) was used for 2 minutes at 2000 rpm to physically disperse the NPs in the PDMS elastomer. This was repeated after it had cooled down. Bubbles were generated by mixing process, and so it was located in a vacuum oven for 1 hour to remove these bubbles before adding the curing agent. After the addition of the curing agent, it was further mixed with a planetary mixer for 2 minutes at 2000 rpm and put into the vacuum oven for another 1 hour. Finally, the sample was poured into a mould, which was prepared to measure the dielectric constant, and the composite was cured in an oven at 80 °C for 1 hour.
1. The procedure for making composites is as follows. First, PDMS resin and BT were mixed with a spatula to separate agglomerated NPs. BT was then mixed with PDMS elastomer until a practicable maximum volume value of 15 vol%. It was difficult to operate at higher than 15 vol% due to the high viscosity. After that, a planetary mixer (model ARE-310, THINKY Corporation) was used for 2 minutes at 2000 rpm to physically disperse the NPs in the PDMS elastomer. This was repeated after it had cooled down. Bubbles were generated by mixing process, and so it was located in a vacuum oven for 1 hour to remove these bubbles before adding the curing agent. After the addition of the curing agent, it was further mixed with a planetary mixer for 2 minutes at 2000 rpm and put into the vacuum oven for another 1 hour. Finally, the sample was poured into a mould, which was prepared to measure the dielectric constant, and the composite was cured in an oven at 80 °C for 1 hour.
2.7 Characterization
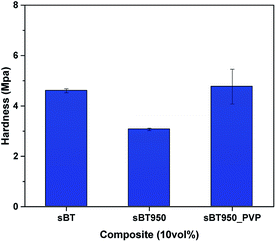
X-ray diffractometer (XRD, model MiniFlex600, Rigaku) was used to confirm the lattice structures under the conditions of X-ray generator (Cu Kα, 40 kV, 15 mA), step size (0.02°) and step speed (5° min−1). A pH meter (model Starter3100, OHAUS) was used as an analyzer for measuring the pH of the solution in the hydrothermal synthesis. Fourier-transform infrared spectroscopy (FT-IR, model Nicolet 6700, Thermo Fisher Scientific) was used to analyse the IR spectrum of the reaction products. To determine the weight loss of PVP on the modified BT surface, the analysis was performed using a Thermogravimetric Analyzer (TGA, model Pyris1 TGA, PerkinElmer). After OH hydroxylation, X-ray photoelectron spectroscopy (XPS, model K-Alpha+, Thermo Fisher Scientific) was used to confirm the elements of the synthesized BT surface. The shape of the NPs and dispersion in PDMS elastomer composites were observed in SEI mode with an acceleration voltage of 5 kV using a Field Emission Scanning Electron Microscope (FE-SEM, model JSM-6701F, JEOL), and a Pt coating was processed for 180 seconds before analysis. Ultramicrotome (model CR-X, RMC) was used on cryo mode to prepare a uniform thin TEM sample under 100 nm thickness prior to TEM image measurement using FE-TEM (model Tecnai G2 F20 X-Twin, FEI). An impedance measurement system (model 4294A, Agilent) was used to evaluate the dielectric properties of the PDMS elastomer composites in a frequency range of 40 Hz to 30 MHz at room temperature. To analyze surface hardness according to the experimental condition, nanoindentation was performed by nanoindenter (model ZHN, Zwick Roell). It was performed under strain = 0.1 s−1, maximum depth = 9 μm conditions and the average value was obtained from the average value of 5 different points. To analyze the specific surface area of sBT and cBT, a surface area analyzer (BET, model Autosorb-iQ/MP, Quantachrome Inst.) was used in conditions of pre-treatment at 300 °C for 3 hours in N2 gas. The specific surface area was calculated by the Brunauer–Emmett–Teller (BET) equation during the measurement.3. Results and discussion
3.1 cBT synthesis by hydrothermal reaction
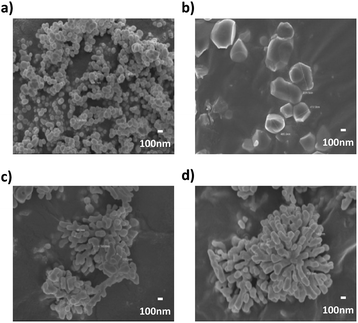
The morphology of BT was varied according to the NaOH concentration as shown in Fig. 2. In the case of 0 M and 0.1 M NaOH concentrations, the NPs are not clearly observed. However, coral-like NPs were observed at 0.3 M, and both the coral-like NPs and the spherical NPs were observed at 0.6 M. Eventually, only spherical NPs were observed at 0.9 M and 1.2 M. This suggests that the pH value during the reaction determines not only the synthesis of BT but also plays an important role in the shape of the NPs. It is predicted that the nuclei of unstable NPs are bonded to each other as they grow like coral, and as the NaOH concentration increases, the growth is promoted to form spherical stable NPs at each nucleus.30 Because coral-like NPs were obtained from 0.3 M NaOH concentration, the coral-like NPs were synthesized at 0.3 M condition.
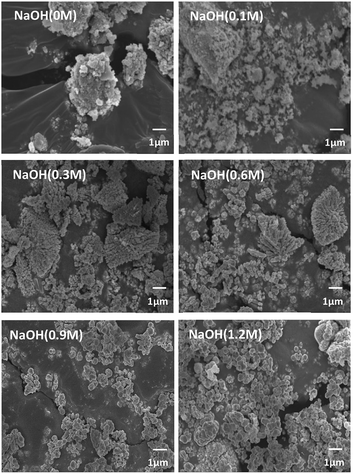 | ||
| Fig. 2 FE-SEM images of particles after hydrothermal synthesis by NaOH concentration condition (×5000). | ||
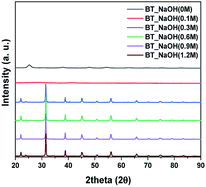
Next, we observed the difference associated with the reaction temperature. Other conditions were set as follows: a time of 15 hours and barium nitrate (Ba(NO3)2) as the Ba source. As a result, all the NPs synthesized at 150 °C, 170 °C, 190 °C and 210 °C were identified as BT (ICDD No. 01-075-0212) in the XRD pattern Fig. 3a. Although the BaCO3 lattice structure peak still remained at a reaction temperature of 210 °C, it was removed after washing the NPs with 5 vol% acetic acid aqueous solution. The NPs shape was also observed according to reaction temperature by FE-SEM, showing coral-like shapes (Fig. S1†). It showed that NPs are transformed into the coral shape when the reaction temperature is over 190 °C. The reaction time was varied from 6 hours to 24 hours, and the other conditions were fixed as follows: 0.3 M, 190 °C and barium nitrate (Ba(NO3)2) as the Ba source. And all results were synthesized as BT as shown in Fig. 3b, and the morphology was observed to be coral-like in the FE-SEM images (Fig. S2†). Coral-like NPs were synthesized clearly after 15 hours, and the size of the coral-like NPs grew up 2 times bigger after 24 hours. Finally, the cBT synthesis conditions were optimized at 0.3 M (NaOH concentration), 190 °C and 15 hours. In order to compare the effect of the Ba source, two kinds of Ba sources were investigated; BaCl2·2H2O and Ba(OH)2·H2O. In Fig. 4, XRD patterns showed that BT was synthesized in all three starting materials conditions.
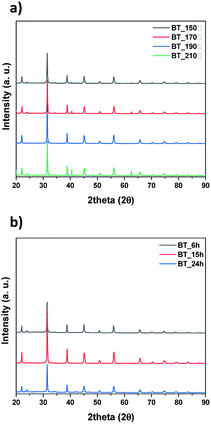 | ||
| Fig. 3 XRD data of synthesized particles by conditions, (a) reaction temperature and (b) reaction time. | ||
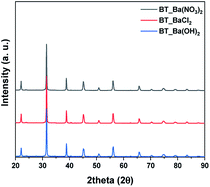 | ||
| Fig. 4 XRD patterns after hydrothermal synthesis by Ba sources condition, Ba(NO3)2, Ba(OH)2 and BaCl2. | ||
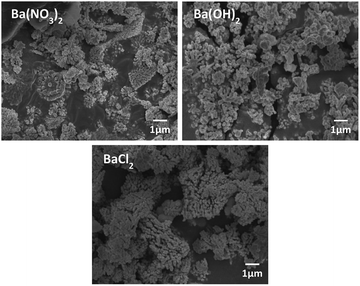
The morphology of BT was varied according to the Ba source as shown in Fig. 5. In the case of Ba(OH)2·H2O, NPs have a mixture of coral-like and spherical shapes. However, for Ba(NO3)2, coral-like shapes were dominant, and the NPs from the BaCl2·2H2O conditions as also showed a coral-like shape. This means that the type of anion in the Ba source is an important factor for adjusting the shapes of the NPs. Especially, when the BaCl2 source is used as precursor, it has weak interaction with each other. Therefore, anions have only a few active sites around the particles. Lack of active site make BT particles from coral-like shape.31 Finally, the BT synthesis for coral-like NPs carried with a NaOH concentration of 0.3 M, reaction temperature 190 °C, reaction time 15 hours and BaCl2·2H2O as the Ba source.
3.2 Phase transition of cBT and sBT
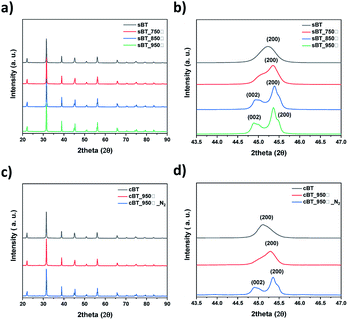 | ||
| Fig. 7 XRD patterns of BT by calcination temperature (a) sBT, (b) sBT in range of 2θ = 43.5°–47° and (c) cBT, (d) cBT in range of 2θ = 43.5°–47°. | ||
3.3 Hydroxylation of cBT950 and sBT950
Attaching the OH functional group to NPs surface through hydroxylation was carried out for surface modification of BT950. In order to graft PVP to BT950 surface, OH groups are required on the NPs surface to enable hydrogen bonding with C![[double bond, length as m-dash]](https://www.rsc.org/images/entities/char_e001.gif) O groups of PVP.38 Hydroxylation is required because the OH groups in BT were removed during calcination. XPS data of BT950 and hydroxylated BT950 (BT950-OH) is compared in Fig. S3 and S4.† In photoelectron spectra of O 1 s, the O ion corresponds to the binding energy range of 532–531.1 (eV), representing H2O and the oxygen ion on the oxide surface, and the peaks appearing at 531.1–530.6 (eV) are OH− ions in alkali and peroxide, and O2− ions of oxide ions appeared in the range of 530.6–527.7 (eV).39 The integrated area of the OH− peak was compared after hydroxylation, showing that the area of cBT950 increased 3 times after hydroxylation. In Fig. S4,† the OH− integrated peak area of sBT950 at 530.87 (eV) was increased 3.35 times after hydroxylation (Table S2†). When NPs were chemically treated by H2O2, OH functional group was generated on Ba ions and it leads NPs to become a Brönsted-basic sites. It help to solve in EtOH and facilitate the PVP surface modification reaction.40 The photoelectron spectra of C 1 s demonstrated the peaks for C–C, C–H, C–O, and C
O groups of PVP.38 Hydroxylation is required because the OH groups in BT were removed during calcination. XPS data of BT950 and hydroxylated BT950 (BT950-OH) is compared in Fig. S3 and S4.† In photoelectron spectra of O 1 s, the O ion corresponds to the binding energy range of 532–531.1 (eV), representing H2O and the oxygen ion on the oxide surface, and the peaks appearing at 531.1–530.6 (eV) are OH− ions in alkali and peroxide, and O2− ions of oxide ions appeared in the range of 530.6–527.7 (eV).39 The integrated area of the OH− peak was compared after hydroxylation, showing that the area of cBT950 increased 3 times after hydroxylation. In Fig. S4,† the OH− integrated peak area of sBT950 at 530.87 (eV) was increased 3.35 times after hydroxylation (Table S2†). When NPs were chemically treated by H2O2, OH functional group was generated on Ba ions and it leads NPs to become a Brönsted-basic sites. It help to solve in EtOH and facilitate the PVP surface modification reaction.40 The photoelectron spectra of C 1 s demonstrated the peaks for C–C, C–H, C–O, and C![[double bond, length as m-dash]](https://www.rsc.org/images/entities/char_e001.gif) O from the BT. The element ratio of BT was also confirmed by XPS analysis of Ba ions and Ti ions after the synthesis of the coral-like NPs. As a result, the Ba
O from the BT. The element ratio of BT was also confirmed by XPS analysis of Ba ions and Ti ions after the synthesis of the coral-like NPs. As a result, the Ba![[thin space (1/6-em)]](https://www.rsc.org/images/entities/char_2009.gif) :
:![[thin space (1/6-em)]](https://www.rsc.org/images/entities/char_2009.gif) Ti ratio was measured as 12.08
Ti ratio was measured as 12.08![[thin space (1/6-em)]](https://www.rsc.org/images/entities/char_2009.gif) :
:![[thin space (1/6-em)]](https://www.rsc.org/images/entities/char_2009.gif) 12.45 atomic%, indicating that the synthesis was performed in an almost 1
12.45 atomic%, indicating that the synthesis was performed in an almost 1![[thin space (1/6-em)]](https://www.rsc.org/images/entities/char_2009.gif) :
:![[thin space (1/6-em)]](https://www.rsc.org/images/entities/char_2009.gif) 1 ratio. The elemental ratios of O and C ions were measured to be 46.59%, 29.87%, respectively. The O ions of BT measured higher value than stoichiometric ratio due to OH groups and impurities from XPS equipment.
1 ratio. The elemental ratios of O and C ions were measured to be 46.59%, 29.87%, respectively. The O ions of BT measured higher value than stoichiometric ratio due to OH groups and impurities from XPS equipment.
3.4 Surface modification of cBT950 and sBT950
The surface modification of NPs was identified by particle size analysis (PSA). The PSA measurement showed that the particle sizes increased after PVP modification as shown in Fig. S5 and S6.† The average particle size of sBT950 increased from 500 nm to 658 nm after PVP modification compared to the cBT950 from 532 nm to 600 nm according to the amount of PVP. When the amount of PVP is low, partially coated PVP acts as a bridge among the NPs. On the other hands, excess PVP covered multiple NPs forming agglomeration NPs.41 I order to find the optimal conditions, we processed various range of chemical treatment depending on the NPs![[thin space (1/6-em)]](https://www.rsc.org/images/entities/char_2009.gif) :
:![[thin space (1/6-em)]](https://www.rsc.org/images/entities/char_2009.gif) PVP molar ratio as 1
PVP molar ratio as 1![[thin space (1/6-em)]](https://www.rsc.org/images/entities/char_2009.gif) :
:![[thin space (1/6-em)]](https://www.rsc.org/images/entities/char_2009.gif) 0.1, 1
0.1, 1![[thin space (1/6-em)]](https://www.rsc.org/images/entities/char_2009.gif) :
:![[thin space (1/6-em)]](https://www.rsc.org/images/entities/char_2009.gif) 0.5, 1
0.5, 1![[thin space (1/6-em)]](https://www.rsc.org/images/entities/char_2009.gif) :
:![[thin space (1/6-em)]](https://www.rsc.org/images/entities/char_2009.gif) 1.0 and 1
1.0 and 1![[thin space (1/6-em)]](https://www.rsc.org/images/entities/char_2009.gif) :
:![[thin space (1/6-em)]](https://www.rsc.org/images/entities/char_2009.gif) 2.0. This PVP modification allows NPs to disperse uniformly in the composite without agglomeration of NPs. The optimized condition is 1
2.0. This PVP modification allows NPs to disperse uniformly in the composite without agglomeration of NPs. The optimized condition is 1![[thin space (1/6-em)]](https://www.rsc.org/images/entities/char_2009.gif) :
:![[thin space (1/6-em)]](https://www.rsc.org/images/entities/char_2009.gif) 0.5 molar ratio for having narrow particle size distribution in PSA.
0.5 molar ratio for having narrow particle size distribution in PSA.
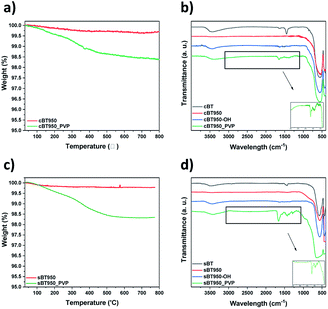
![[double bond, length as m-dash]](https://www.rsc.org/images/entities/char_e001.gif) O functional group of surface modified BT950 (BT950_PVP) were measured by TGA and FT-IR analysis, respectively. The weight loss in Fig. 11a and c are similar at 350 °C with 1.5 wt%. The FT-IR spectrum of PVP was also identified as shown in Fig. 11b and d; 1652 cm−1 (C
O functional group of surface modified BT950 (BT950_PVP) were measured by TGA and FT-IR analysis, respectively. The weight loss in Fig. 11a and c are similar at 350 °C with 1.5 wt%. The FT-IR spectrum of PVP was also identified as shown in Fig. 11b and d; 1652 cm−1 (C![[double bond, length as m-dash]](https://www.rsc.org/images/entities/char_e001.gif) O), 1460 cm−1 (CH2, CH3) and 1294 cm−1 (CN). The surface of the NPs was also observed before and after surface modification using FE-SEM. The particle size of sBT950_PVP and cBT950_PVP is increased slightly compared to unmodified BT950 as shown in Fig. S7.†
O), 1460 cm−1 (CH2, CH3) and 1294 cm−1 (CN). The surface of the NPs was also observed before and after surface modification using FE-SEM. The particle size of sBT950_PVP and cBT950_PVP is increased slightly compared to unmodified BT950 as shown in Fig. S7.†
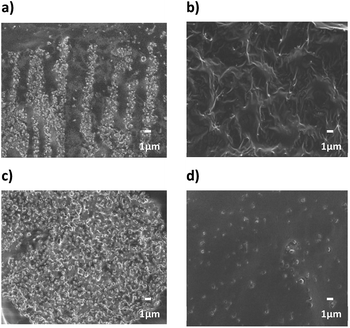 | ||
| Fig. 14 FE-SEM cross-section images of 10 vol% NPs composites (a) cBT950, (b) cBT950_PVP composite, (c) sBT950 and (d) sBT950_PVP composite (×5000). | ||
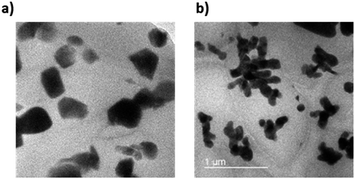
FE-TEM images were measured to confirm the dispersion of the NPs in composite. As shown in Fig. 15, TEM images showed fine NPs dispersion in PDMS composite regardless of the shape. The size of NPs are also matched the result of PSA in Fig. S5 and S6.† It also demonstrated that the particle shape of coral reef still maintained even after PVP modification.
4. Conclusions
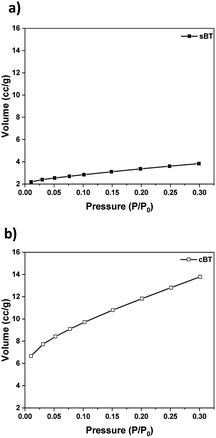
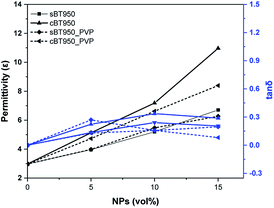
We have investigated the effect of cBT on the dielectric properties and dispersion in PDMS elastomer. Compared with the sBT, the PDMS composites with the cBT showed enhanced dielectric properties. In particular, the composites with 15 vol% of the cBT had a 64% higher permittivity than the sBT. This influences the dielectric characteristics depending on the morphology, because the specific surface area of the coral-like shape is approximately 4 times higher than the specific surface area of the spherical shape. Phase transition and surface modification were also employed to increase the permittivity and dispersion of the BT in the PDMS composite. As a result, in 15 vol% composites, the permittivity of cBT950_PVP composite was increased 25.4% to 8.4 higher than the sBT composite, 6.7. Finally, the cBT950_PVP–PDMS composite was applied to obtain a high dielectric elastomer which is flexible and has a uniform NPs dispersion. This could be used in electric devices such as robotic grippers, pyroelectric devices, and piezoelectric devices which need elasticity and high permittivity.Conflicts of interest
There are no conflicts to declare.Acknowledgements
This work was financially supported by “Establishment of the Rapid Manufacturing Platform for Ceramic Additive Manufacturing” from Korea Institute of Industrial Technology, Republic of Korea (EO200014). I would like to thank Biopolymer laboratory researchers from Korea Institute of Industrial Technology (KITECH).References
- J. Shintake, V. Cacucciolo, D. Floreano and H. Shea, Adv. Mater., 2018, 30, 1707035 CrossRef PubMed.
- J. Shintake, S. Rosset, B. Schubert, D. Floreano and H. Shea, Adv. Mater., 2016, 28, 231–238 CrossRef CAS PubMed.
- K.-S. Chou and C.-H. Lee, Adv. Mater. Sci. Eng., 2014, 2014, 514508 Search PubMed.
- T. Nakamura and A. Yamamoto, ROBOMECH J., 2017, 4, 18 CrossRef.
- C. Cao, X. Sun, Y. Fang, Q.-H. Qin, A. Yu and X.-Q. Feng, Mater. Des., 2016, 89, 485–491 CrossRef.
- J. Azadmanjiri, C. C. Berndt, J. Wang, A. Kapoor, V. K. Srivastava and C. Wen, J. Mater. Chem. A, 2014, 2, 3695–3708 RSC.
- T. Sebastian, A. Michalek, M. Hedayati, T. Lusiola and F. Clemens, J. Eur. Ceram. Soc., 2019, 39, 3716–3721 CrossRef CAS.
- S.-D. Cho, J.-Y. Lee, J.-G. Hyun and K.-W. Paik, Mater. Sci. Eng. B, 2004, 110, 233–239 CrossRef.
- S. Liu and J. Zhai, J. Mater. Chem. A, 2015, 3, 1511–1517 RSC.
- K. Yu, Y. Niu, Y. Zhou, Y. Bai and H. Wang, J. Am. Ceram. Soc., 2013, 96, 2519–2524 CrossRef CAS.
- T. Zhou, J.-W. Zha, R.-Y. Cui, B.-H. Fan, J.-K. Yuan and Z.-M. Dang, ACS Appl. Mater. Interfaces, 2011, 3, 2184–2188 CrossRef CAS PubMed.
- R. F. Brady Jr, Prog. Org. Coat., 2001, 43, 188–192 CrossRef.
- A. Thanki and R. Goyal, Mater. Chem. Phys., 2016, 183, 447–456 CrossRef CAS.
- L. Zhang, J. Wen, Z. Zhang, J. Yang, H. Huang, Q. Hu, H. Zhuang and H. Yu, Phys. B, 2019, 560, 155–161 CrossRef CAS.
- D. Khastgir and K. Adachi, Polymer, 2000, 41, 6403–6413 CrossRef CAS.
- S. Kango, S. Kalia, A. Celli, J. Njuguna, Y. Habibi and R. Kumar, Prog. Polym. Sci., 2013, 38, 1232–1261 CrossRef CAS.
- X. Liu, W. Tong, Z. Wu and W. Jiang, RSC Adv., 2013, 3, 4716–4722 RSC.
- J. Li, K. Inukai, Y. Takahashi and W. Shin, J. Asian Ceram. Soc., 2016, 4, 394–402 CrossRef.
- J. Nam, Y. Kim, K. Kim, S. H. Baeck, D. W. Park and S. E. Shim, Polymer, 2016, 40, 109–116 CAS.
- K. M. Koczkur, S. Mourdikoudis, L. Polavarapu and S. E. Skrabalak, Dalton Trans., 2015, 44, 17883–17905 RSC.
- Y. Wang, G. Xu, L. Yang, Z. Ren, X. Wei, W. Weng, P. Du, G. Shen and G. Han, Mater. Lett., 2009, 63, 239–241 CrossRef CAS.
- Y. Cao, K. Zhu, Q. Wu, Q. Gu and J. Qiu, Mater. Res. Bull., 2014, 57, 162–169 CrossRef CAS.
- M. M. Kržmanc, D. Klement, B. Jančar and D. Suvorov, Ceram. Int., 2015, 41, 15128–15137 CrossRef.
- Z. Wang, J. K. Nelson, J. Miao, R. J. Linhardt, L. S. Schadler, H. Hillborg and S. Zhao, IEEE Trans. Dielectr. Electr. Insul., 2012, 19, 960–967 CAS.
- J. Fu, Y. Hou, M. Zheng and M. Zhu, J. Mater. Sci., 2018, 53, 7233–7248 CrossRef CAS.
- F. Maxim, P. M. Vilarinho, P. Ferreira, I. M. Reaney and I. Levin, Cryst. Growth Des., 2011, 11, 3358–3365 CrossRef CAS.
- W. Lu, M. Quilitz and H. Schmidt, J. Eur. Ceram. Soc., 2007, 27, 3149–3159 CrossRef CAS.
- P. Badheka, L. Qi and B. I. Lee, J. Eur. Ceram. Soc., 2006, 26, 1393–1400 CrossRef CAS.
- P. Bendale, S. Venigalla, J. R. Ambrose, E. D. Verink Jr and J. H. Adair, J. Am. Ceram. Soc., 1993, 76, 2619–2627 CrossRef CAS.
- C.-J. Huang, K.-L. Chen, P.-H. Chiu, P.-W. Sze and Y.-H. Wang, J. Nanomater., 2014, 2014, 718918 Search PubMed.
- Y. Ni, H. Zheng, N. Xiang, K. Yuan and J. Hong, RSC Adv., 2015, 5, 7245–7252 RSC.
- S. Singha and M. J. Thomas, IEEE Trans. Dielectr. Electr. Insul., 2008, 15, 12–23 CAS.
- G. Tsagaropoulos and A. Eisenberg, Macromolecules, 1995, 28, 6067–6077 CrossRef CAS.
- H. Xu and L. Gao, J. Am. Ceram. Soc., 2003, 86, 203–205 CrossRef CAS.
- G. I. Waterhouse, G. A. Bowmaker and J. B. Metson, Phys. Chem. Chem. Phys., 2001, 3, 3838–3845 RSC.
- D. Zhang, X. Zhou, J. Roscow, K. Zhou, L. Wang, H. Luo and C. R. Bowen, Sci. Rep., 2017, 7, 45179 CrossRef CAS PubMed.
- B. Briscoe, L. Fiori and E. Pelillo, J. Phys. D: Appl. Phys., 1998, 31, 2395 CrossRef CAS.
- M. G. Hernández, F. d. J. C. Romo, A. G. Murillo, D. J. Vigueras, M. M. Nava, P. B. Pérez and G. Chadeyron, J. Sol-Gel Sci. Technol., 2010, 53, 246–254 CrossRef.
- E. McCafferty and J. Wightman, Surf. Interface Anal., 1998, 26, 549–564 CrossRef CAS.
- C.-C. Li, S.-J. Chang, J.-T. Lee and W.-S. Liao, Colloids Surf., A, 2010, 361, 143–149 CrossRef CAS.
- M. Hosokawa, K. Nogi, M. Naito and T. Yokoyama, Nanoparticle Technology Handbook, Elsevier, Oxford, 1st edn, 2007 Search PubMed.
Footnote |
| † Electronic supplementary information (ESI) available. See DOI: 10.1039/d0ra04196c |
| This journal is © The Royal Society of Chemistry 2020 |


