DOI:
10.1039/D0RA04124F
(Paper)
RSC Adv., 2020,
10, 28680-28694
Synthetic scheme to improve the solid content of biodegradable waterborne polyurethane by changing the association relationships of hydrophilic fragments
Received
8th May 2020
, Accepted 24th July 2020
First published on 4th August 2020
Abstract
A synthetic method was developed to prepare biodegradable waterborne polyurethanes (BHPUs) with a high solid content by introducing different molecular weights of poly(ethylene glycol) (PEG) into poly(ε-caprolactone) (PCL)-based polyurethanes. PCL is a semi-crystalline polymer that can be degraded in lipase to prepare biodegradable waterborne polyurethanes. The biodegradability of BHPUs was evaluated, and the results showed that BHPU samples could be degraded in a solution of phosphate-buffered saline (PBS)/lipase but not in PBS. Two different synthesis routes were used to prepare the BHPUs, which resulted in different association relationships between the ionic hydrophilic polymer dimethylol propionic acid (DMPA) and a nonionic hydrophilic polymer (PEG). The influence of the association relationship between DMPA and PEG on the solid content and other BHPU properties was investigated. The results showed that the method of associating all PEG molecules with DMPA increased the crystallization, tensile properties, and water and soil repellency of the BHPU samples. The solid content of the BHPU samples increased from 41% to 52.7%. In addition, PEG with molecular weights of 400 g mol−1 and 1000 g mol−1 had the best effect on the dispersibility and stability of BHPU samples when incorporated into a polyurethane backbone.
Introduction
Polyurethanes (PUs) have been widely used in adhesives, coatings, sealants, and elastomers due to their elasticity, abrasion resistance, gloss, toughness, low-temperature flexibility, and excellent film formation ability.1–3 Due to increasingly stringent global environmental legislation, solvent-based PUs have steadily been abandoned. Waterborne polyurethanes (WPUs) are environmentally-friendly materials used in adhesive and coating industries, where organic solvents are replaced with water.4–6 Furthermore, the lack of available landfills has become a major problem for polymer waste, which raises concerns regarding biodegradation and environmental pollution.7 Although WPUs use water as a dispersion medium, which minimizes their pollution and toxicity, once no longer useful, they must be buried or incinerated.8 Therefore, it is important to increase the use of biodegradable WPU materials. Polyols are important constituents of WPUs, and their type and content directly affect the biodegradability of WPUs.9 Poly(ε-caprolactone) (PCL) is a semicrystalline and fully biodegradable polyol that is often employed as the soft segment in WPU backbones. It possesses excellent chemical resistance to various solvents, has a low melting point, low viscosity, good processability, and a short degradation time.10 PCL biodegrades in the presence of many microorganisms found in landfills and sewer sludge, in household compost waste, and in natural waters.11–14
WPUs with high solid content and low viscosities have been desired to both academic study and commerce because a high solid content results in a rapid drying rate and easy transport, which reduces energy consumption and lowers costs. Therefore, the preparation of WPUs with high solid contents has been investigated.15–17 The viscosity of WPU latexes is one of the most important factors affecting the solid content of WPU dispersions. The viscosity of WPU latexes increases rapidly upon increasing the solid content, especially above an upper limit.18,19 Moreover, the higher the viscosity of the WPU prepolymer, the more difficult its dispersal in water, which reduces the solid content.20 Thus, decreasing the latex viscosity can be used to obtain WPU emulsions with high solid contents. In general, latex particle swelling due to the formation of an electric double layer via interactions between hydrophilic ionic polymers and neutralizing agents leads to a high latex viscosity. Therefore, an effective method for reducing the latex viscosity is to decrease the dosage of hydrophilic ionic polymers used in WPUs.21 However, due to the hydrophobicity of PU, it requires a minimum dosage of hydrophilic ionic polymers to obtain stable dispersions during WPUs preparation.22 Lee and Kim23 synthesized a series of WPUs containing ionic groups in the hard and soft segments, as well as at the termini of the WPU chains. They found that stable WPU dispersion with 45% solid content and only 2% ionic content can be obtained through the incorporation of ionic groups at the termini of the WPU flexible chains. Although they acquired 45% solid content of dispersion, the lack of hydrophilic ionic polymers may lead to poor emulsion dispersion and stability. Saw et al.24 studied the relationship between phase inversion and dimethylol propionic acid (DMPA) content. The study indicated that when the carboxyl group (–COOH) content in WPU is greater than 0.2 mmol g−1 (2.7% DMPA), the dispersion is stable. However, at low –COOH content, below 0.2 mmol g−1, the latex formed a mixed structure (PU/W, W/PU/W and PU/W/PU/W) and required additional water to achieve phase inversion, while the emulsion becomes unstable. Therefore, the utilization of hydrophilic ionic polymers alone as hydrophilic groups to develop WPU with high solid content is rather limited. Li and co-workers21 developed a high solid content WPU via the introduction of cationic groups in the soft segment and at the chain terminus. They discovered that an appropriate latex particle diameter ratio improves the packing efficiency while reducing the viscosity, which increases the upper limit of the solid content. Hence, control of particle size and distribution are key factors for the generation of WPUs with high solid content and low viscosity. Nevertheless, to date, cationic dispersions are not widely applied. Anionic WPUs are used commercially due to their good film-forming properties, good thermal stability, and adhesive properties.25–27 However, the majority are sensitive to pH and electrolytes, which can be overcome through the introduction of nonionic hydrophilic polymers into the WPU backbone. Compared with those containing only hydrophilic ionic polymers, WPUs possessing both ionic and nonionic hydrophilic polymers produce finer particle sizes and greater emulsion stability. Furthermore, the overall hydrophilicity of the WPU emulsion can be minimized to attain good frost and electrolyte resistance.28 In addition, the incorporation of nonionic hydrophilic polymers can reduce the amount of ionic hydrophilic groups used in WPUs, which increases the solid content of emulsion.
Previous studies have shown that WPUs solid content usually ranges from 20 to 40 wt%, and only few reports describe solid contents above 50%.21 Moreover, these studies did not investigate the WPUs potential biodegradability. In this study, biodegradable waterborne polyurethane (BHPU) with high solid content was prepared via the introduction of nonionic hydrophilic polymer (PEG) with different molecular weights into the PCL-based WPU. Then the prepared BHPUs biodegradability was evaluated. The association relationship of the ionic hydrophilic polymers and nonionic hydrophilic polymers, as well as the position of the hydrophilic groups on the molecular chains, can influence the solid content, dispersion and stability properties of WPU emulsion. To determine the optimal influence of PEG on the BHPUs properties, two different synthetic methods were developed for BHPUs preparation, which resulted in different association relationships between the hydrophilic polymers (DMPA) and nonionic hydrophilic polymers (PEG). Furthermore, the influence of various association relationships on BHPUs solid content and other properties was investigated. This study gives a greater understanding of the combination of ionic hydrophilic polymers and nonionic hydrophilic polymers in the preparation of BHPUs, and to create a synthetic method that employs the least amount of hydrophilic polymers by directly associating all PEG molecules with DMPA to generate biodegradable WPU with high emulsion stability, high solid content, good tensile properties, and fine water resistance.
Materials
PCL (Mw = 2000 g mol−1, Wanhua, China) and PEG (Mw = 200 g mol−1, 400 g mol−1, 1000 g mol−1, 2000 g mol−1, Wanhua, China) were dried at 85 °C under vacuum for 10 h before use. 1,4-Butanediol (BDO, Guangfu, China) was dried at 80 °C under vacuum for 2 h before use. Isophorone diisocyanate (IPDI, 98% purity, Aladdin), dimethylol propionic acid (DMPA, 99% purity, China), triethylamine (TEA, AR grade, Lingfeng, China), phosphate-buffered saline (PBS, pH = 7, Qingdao, China), and lipase (20 U ml−1, Amano Pharmaceutical, Japan) were used as received. Acetone (AR, Tianjin Bodi Chemicals, China) was dried with 4 Å molecular sieves before use.
Synthesis of BHPU dispersions
Table 1 shows the compositions of the BHPUs dispersions. The NCO/OH molar ratio was defined as R. The value of R = NCO(IPDI)/[OH(PCL + PEG + DMPA)] was set to 1.2 for all BHPU samples. The same amounts of DMPA and PEG were used to synthesize BHPUs (WDMPA = WPEG, 2.4%, 2.2%, and 2.0% of the weight of the BHPU prepolymer, respectively). Moreover, the soft segment of all BHPU samples was about 68%. To investigate the influence of PEG incorporation on the BHPU properties, samples containing only PCL as the soft segment were also synthesized.
Table 1 Composition of prepared BHPU dispersions
| |
Materials |
Content (mol) |
wt%a |
| Based on the total mass of the prepolymer. R = NCO(IPDI)/[OH(PCL + PEG + DMPA)] was 1.2. The content of hard segments was about 32%. |
| Soft segments |
PCL (Mn = 2000) |
0.011 |
|
| PEG (Mn = 200, 400, 1000, 2000) |
Variable |
2.0–2.4 |
| Hard segmentsc |
IPDI |
0.0382 |
|
| BDO |
Calculated by the value of Rb (0.010–0.014) |
|
| DMPA |
Variable |
2.0–2.4 |
| Neutralizing agent |
TEA |
Equivalent molar ratio with DMPA |
|
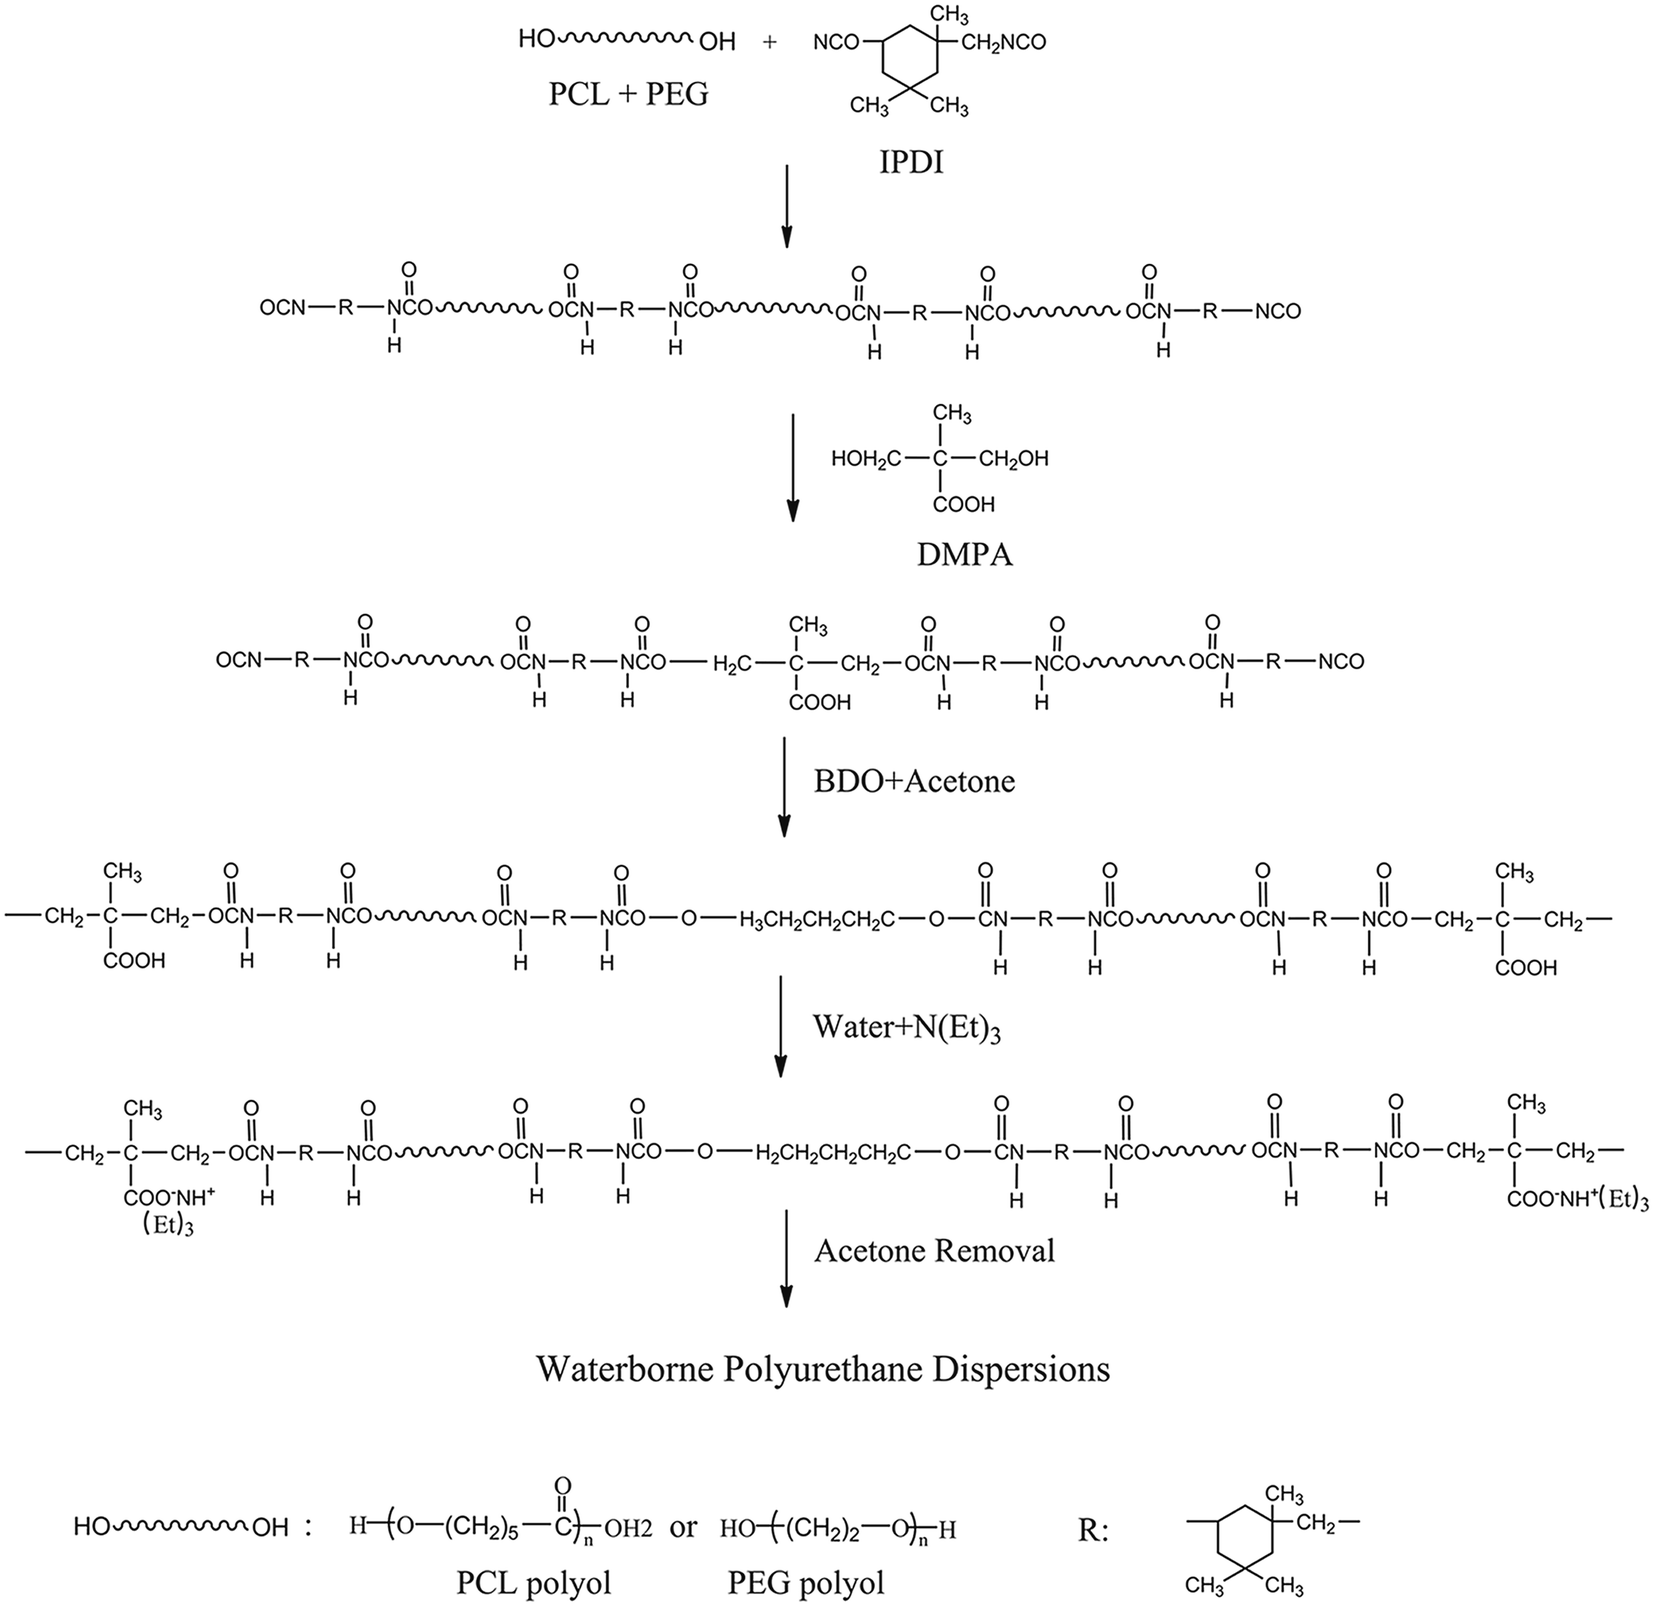
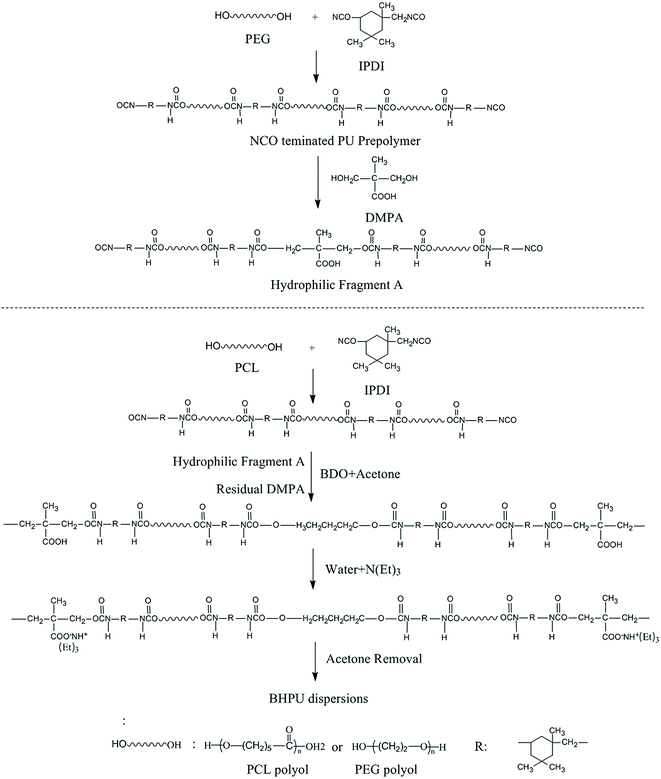
Synthesis Route 1
Synthesis Route 1 is shown in Fig. 1. First, PCL and PEG were added into a 250 ml four-neck round-bottom flask equipped with a mechanical stirrer, reflux condenser, and nitrogen protection system. The mixture was stirred at 55 °C for 10 min to obtain a homogeneous mixture, followed by the addition of IPDI and dibutyltin dilaurate (about 0.1 wt% of the prepolymer). Then, the reaction temperature was raised to 85 °C and stirred at 250 rpm for 90 min, and then BDO was added. The reaction proceeded until the desired amount of residual NCO groups reacted, and the reaction system was cooled to 50 °C, followed by the addition of TEA to neutralize the carboxylic acid. After that, deionized water was added to the neutralized PU prepolymer at 35 °C with 1000 rpm for 30 min to disperse the PU prepolymer. Throughout the reparation process, about 5–10% of acetone was used to adjust the viscosity of the reaction system. Finally, the residual acetone was removed in a vacuum drying oven at 42 °C under 0.1 MPa pressure.
 |
| | Fig. 1 Synthesis Route 1 of BHPU samples. | |
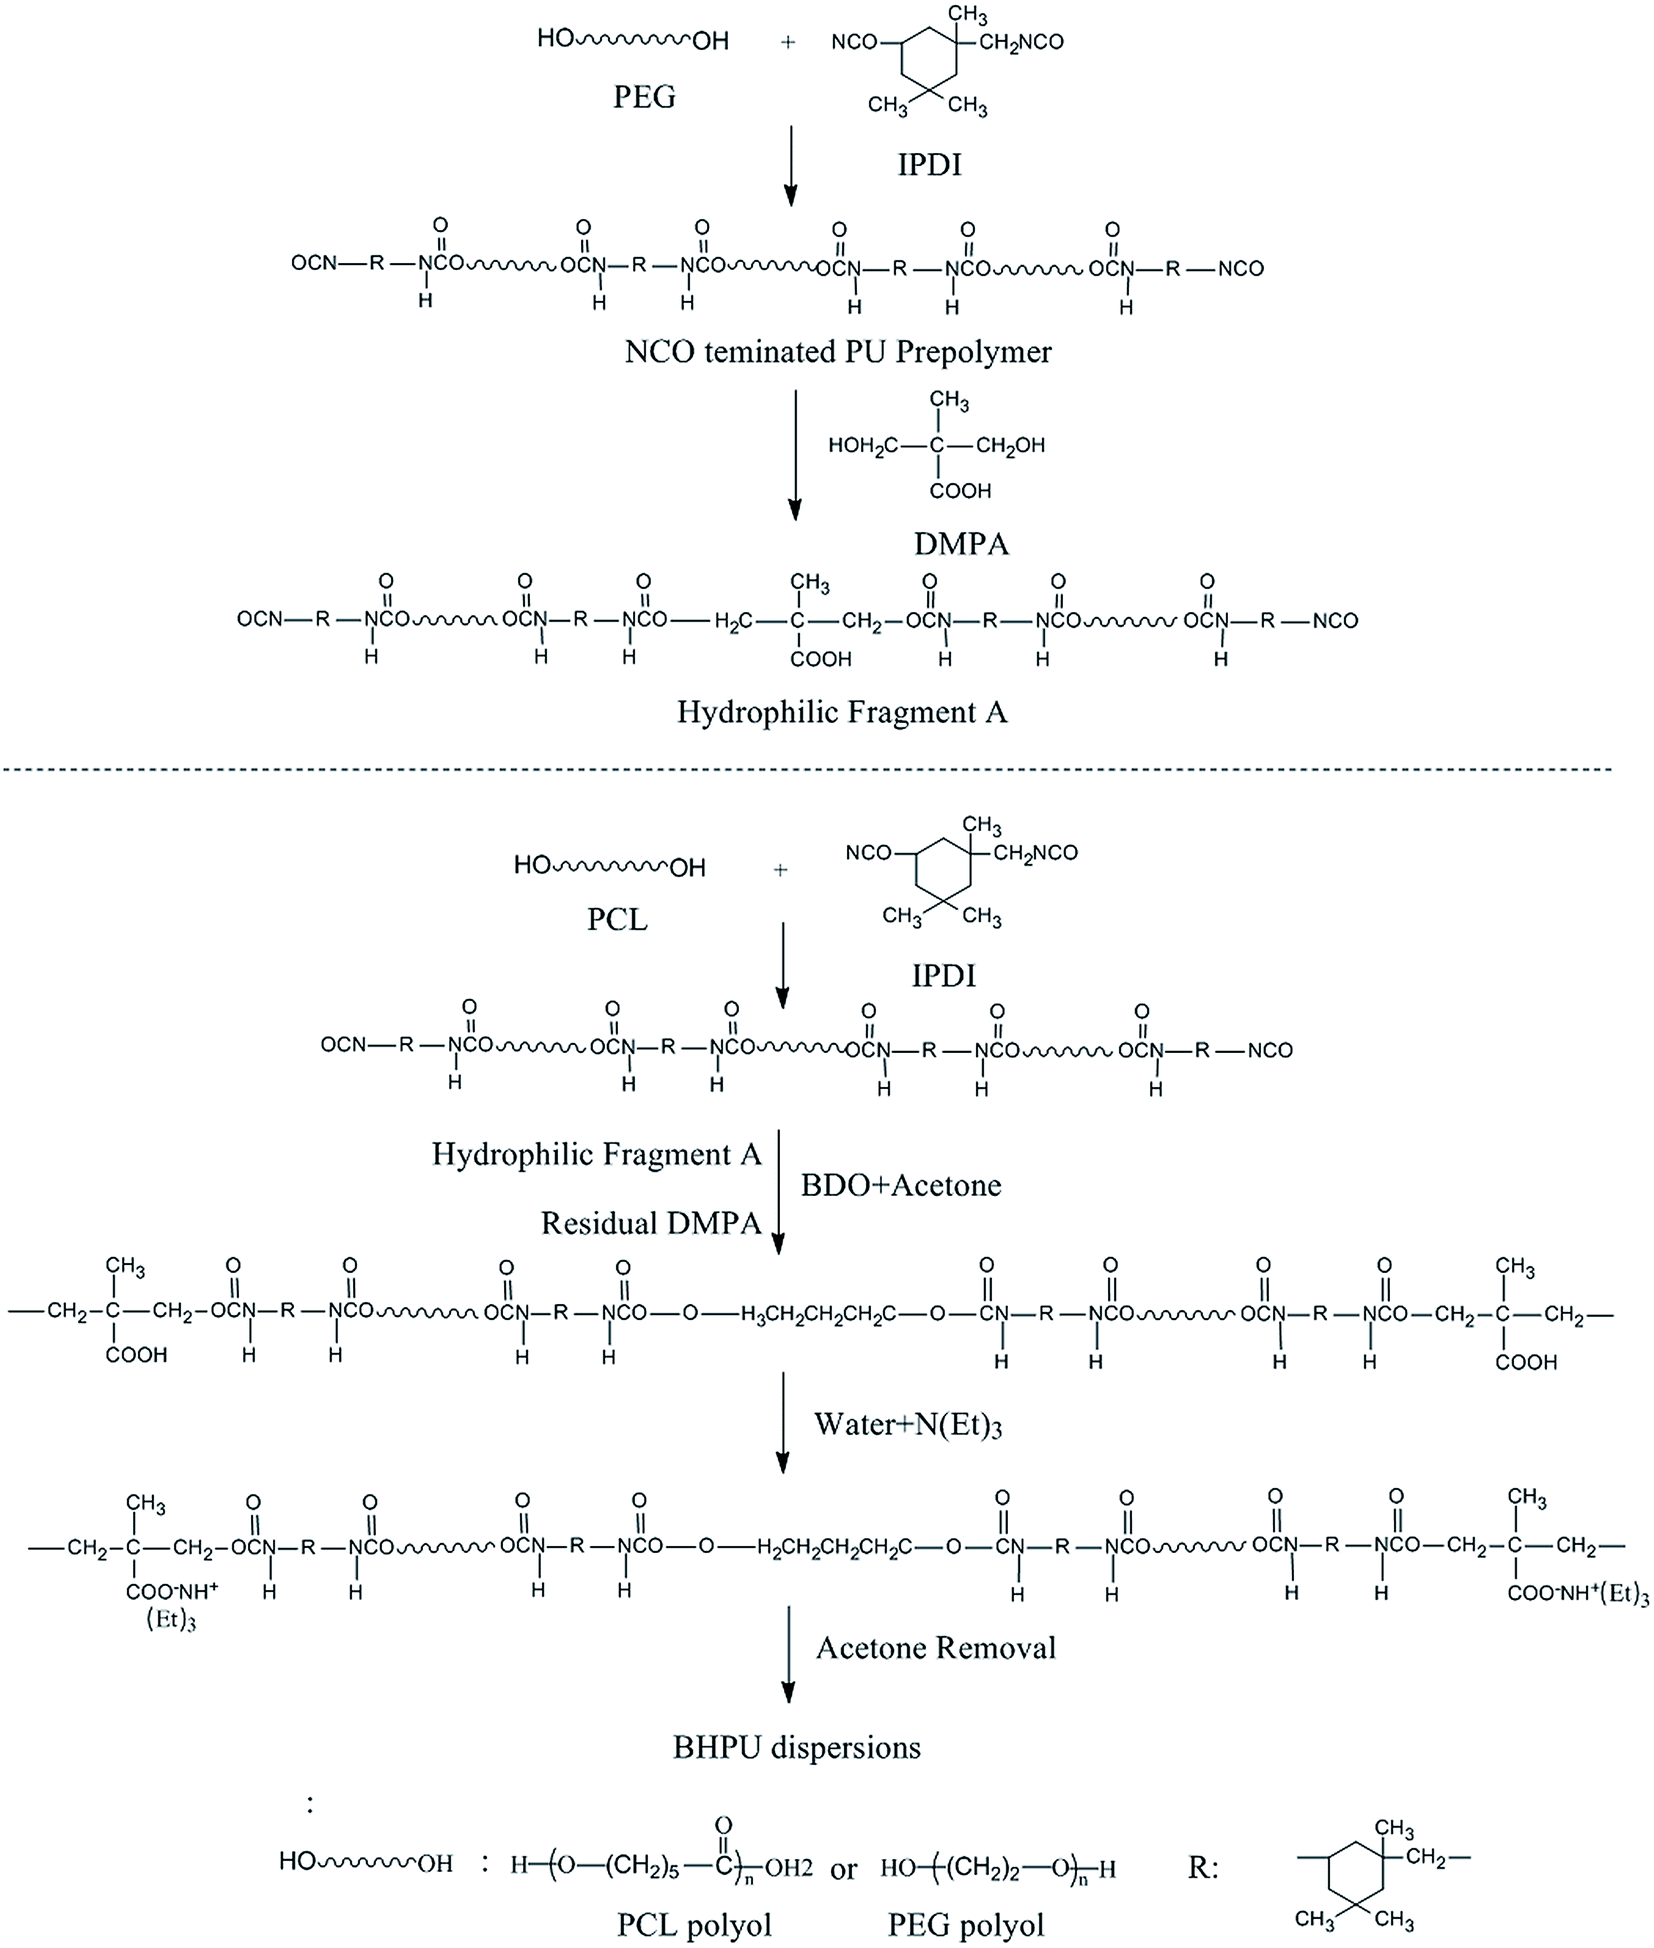
Synthesis Route 2
The type and amount of each raw material used to synthesize BHPU were the same as in Route 1. Synthesis Route 2 is shown in Fig. 2. An NCO-terminated hydrophilic fragment A was first synthesized using the entire amount of PEG (0.7–0.83 g) and part of the DMPA and IPDI (the molar ratio of PEG/IPDI/DMPA was 1![[thin space (1/6-em)]](https://www.rsc.org/images/entities/char_2009.gif) :1:3). At the same time, the remaining DMPA and IPDI and other materials (calculated according to Table 1) were used to synthesize another polyurethane-prepolymer according to Route 1. The difference from Route 1 was that the hydrophilic fragment A was added into the reactor before BDO. The dispersion step was also the same as Route 1, and then the BHPU dispersions were obtained.
:1:3). At the same time, the remaining DMPA and IPDI and other materials (calculated according to Table 1) were used to synthesize another polyurethane-prepolymer according to Route 1. The difference from Route 1 was that the hydrophilic fragment A was added into the reactor before BDO. The dispersion step was also the same as Route 1, and then the BHPU dispersions were obtained.
 |
| | Fig. 2 Synthesis Route 2 of BHPU samples. | |
Preparation of hydrophilic fragment A
The molar ratio of PEG/IPDI/DMPA was 1:1:3. The entire amount of PEG (0.7–0.83 g) and part of IPDI were added into a 250 ml four-neck round-bottom flask (equipped the same as Route 1) and stirred at 55 °C for 15 min. Then, the reaction temperature was raised to 85 °C, reacted for 90 min, and then cooled to 80 °C. Then, part of the DMPA was added into the reactor with the PEG. The reaction proceeded until the desired amount of residual NCO groups was obtained and hydrophilic fragment A was obtained. During this procedure, some acetone was used to adjust the system viscosity.
The two different synthesis routes produced different association relationships between DMPA and PEG. In the samples prepared by Route 2, all PEG molecules were directly associated to DMPA; however, in the samples prepared via Route 1, not all PEG molecules were directly linked to DMPA.
Preparation of BHPU films
BHPU films were prepared by casting BHPU dispersions on a Teflon baffle disk, followed by drying the sample films at room temperature for 24 h, and then in a vacuum oven at 45 °C for another 24 h.
Characterization
Average particle size
The average BHPU particle sizes were measured by dynamic light-scattering using a particle size analyzer (Brookhaven 90 Plus, Germany). The BHPU emulsion was diluted to 0.3% using deionized water at 25 °C.
Solid content
The solid content of the BHPU emulsion was determined by weighting the sample before and after water evaporation. Approximately 2 g of BHPU emulsion was placed in a glass container, followed by the evaporation of water at 103 °C in an oven until a constant weight was obtained. The solid content of each sample was calculated as the average of five experiments.
Infrared spectroscopy (FTIR)
ATR-FTIR spectra of the BHPU films were obtained on an infrared spectrometer (IS50, Nicolet, USA) with 32 scans at a resolution of 4 cm−1.
Differential scanning calorimetry (DSC)
DSC curves of BHPU films were obtained using a differential scanning calorimeter (PerkinElmer, USA). Approximately 5 g of BHPU films were placed in an aluminum pan and then heated from 30 to 140 °C at 10 °C min−1 under a nitrogen atmosphere, followed by cooling from 140 °C to −60 °C at 5 °C min−1. Then, the second heating process was carried out from −60 °C to 140 °C at 10 °C min−1.
Polarizing optical microscopy (POM)
The crystalline morphologies of BHPU films were studied at room temperature using polarizing optical microscopy (Leica 020-525, Leica Microsystems GmbH, Germany).
Dynamic mechanical analysis (DMA)
The viscoelastic properties of the BHPU films were measured using a dynamic mechanical analyzer (DMA, Germany). Tests were carried out by heating samples from −90 °C to 100 °C at a heating rate of 3 °C min−1 and a frequency of 1 Hz.
X-ray diffraction (XRD)
The crystallinity of BHPU samples was analyzed using an X-ray diffractometer (Bruker, Germany). Scans with 2θ angles from 5° to 60° with a 0.02° step were acquired at a rate of 0.1 s per step.
Water absorption measurement
The water absorption of BHPU films was measured by immersing the films in water for 1, 2, 3, and 4 days at room temperature, followed by the removal of excess water from the sample surface with filter paper. The percent water absorption of each BHPU film was calculated by the weight change as follows:
where, Wt and W0 are the weights of wet and dry samples, respectively.
Contact angle measurements
A contact angle measurement instrument (DSA 30, Kruss, Germany) was used to measure the contact angles of BHPU films. The thickness of sample films was about 0.8 mm, and three measurements were carried out for each BHPU film by dropping deionized water on the film surface.
Mechanical properties measurement
The mechanical properties of BHPU films were tested using a tensile tester (Instron, USA). BHPU film specimens were cut into 30 mm × 4 mm × 1 mm, followed by tests at a crosshead speed of 50 mm min−1.
Scanning electron microscopy (SEM)
The surface morphologies of degraded BHPU samples were observed via a JSM6510 SEM (JEOL, Japan) with an acceleration voltage of 10 kV. Before analysis, the surface of the BHPU sample film was coated with a layer of gold under vacuum.
Gel permeation chromatography (GPC)
The molecular weight of BHPU films was measured using a gel permeation chromatograph (PL-GPC50, UK). The BHPU samples were dissolved in tetrahydrofuran (THF) at a constant concentration of 0.1 wt%. The flow rate of THF was 1.0 ml min−1 and the sample injection volume was 10 μl.
Degradation test
Standard hydrolysis (PBS, pH = 7) and enzymatic hydrolysis (20 U ml−1 lipase) were carried out at 37 °C with shaking.29 The sample film was cut into 10 mm × 10 mm × 1 mm specimens that were then placed into a 50 ml plastic tube with a lid containing 10 ml of a degradation buffer solution. Samples were removed at different time intervals and then rinsed carefully with distilled water three times, followed by drying the sample in a vacuum oven at 35 °C to obtain a constant weight. Each sample was measured 3 times, and the average was reported.
Results and discussion
Influence of PEG on the particle size and solid content of BHPU dispersions
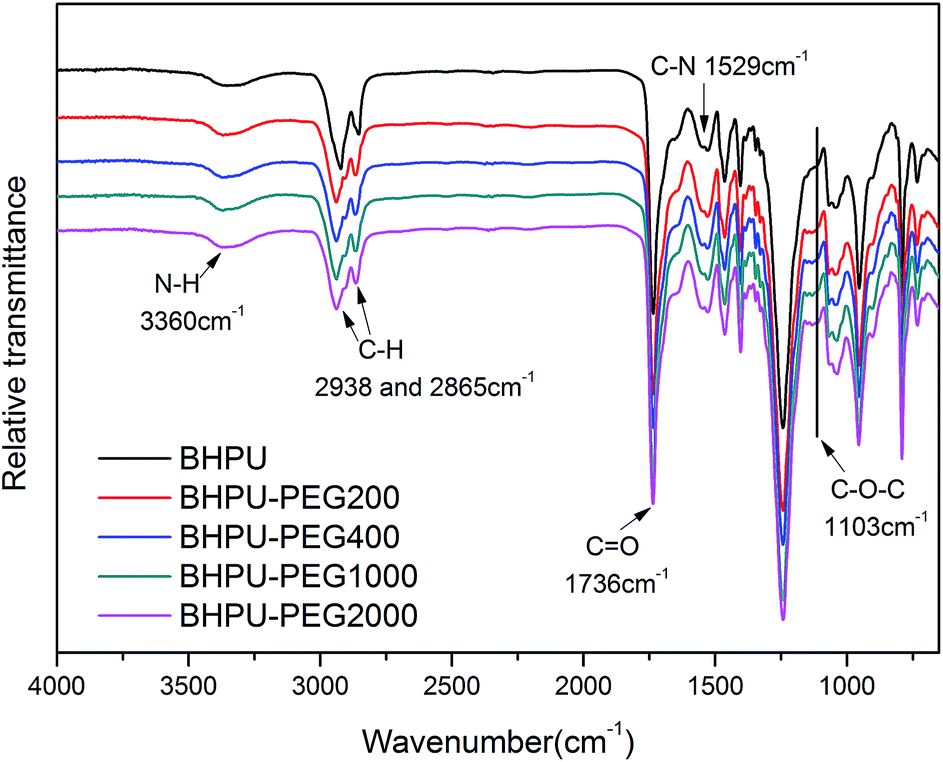
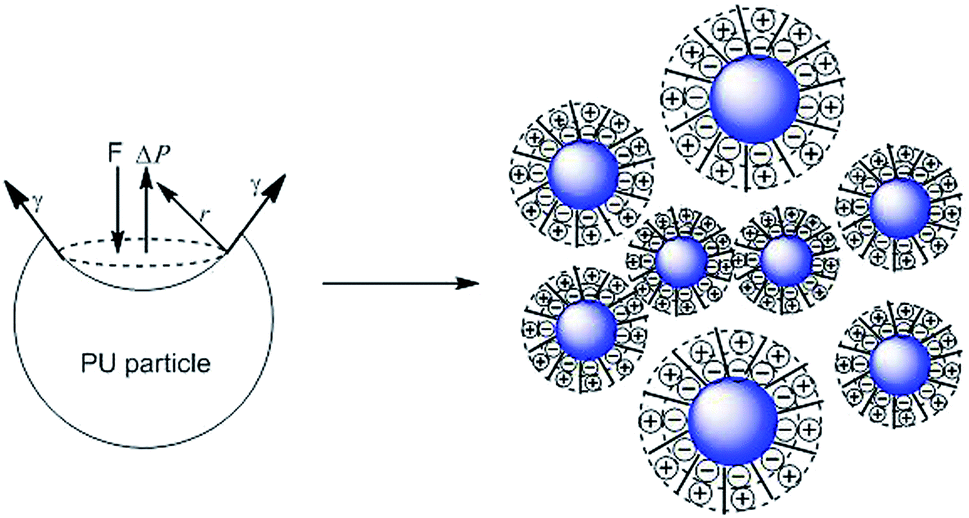
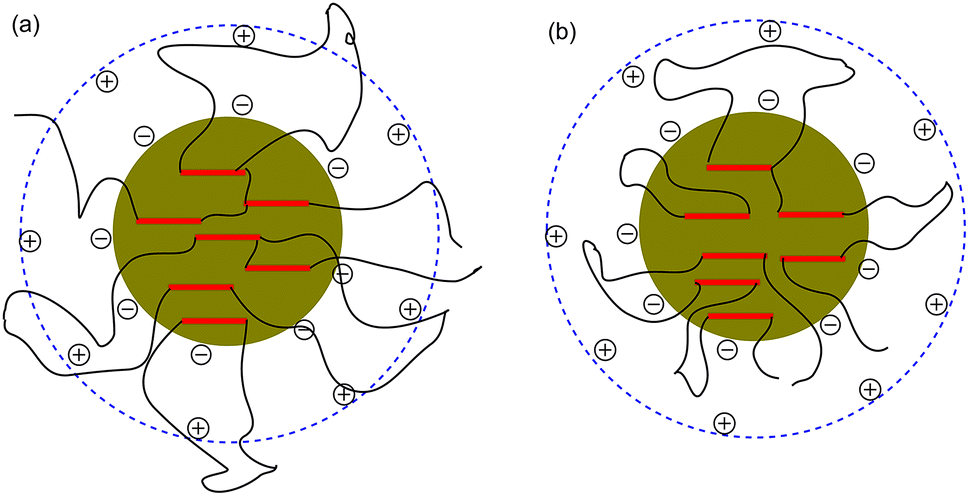
To determine the influence of PEG on the properties of BHPU dispersions, different molecular weights of PEG (WPEG = WDMPA, Mw = 200, 400, 1000, 2000) were introduced into the anionic polyurethane backbone. The chemical structure of the BHPU samples was analyzed by FTIR spectroscopy (Fig. 3). The characteristic absorption peaks at 3360 cm−1 and 1736 cm−1 corresponded to the N–H and C![[double bond, length as m-dash]](https://www.rsc.org/images/entities/char_e001.gif) O stretching vibration of urethane, respectively. The peaks at 2938 cm−1 and 2865 cm−1 were attributed to the C–H stretching vibration of CH3 and CH2, respectively. The peak at 1529 cm−1 was associated with C–N stretching vibrations. The absorption peak at 1103 cm−1 was attributed to the C–O–C stretching vibration, which appeared in the spectra of the samples containing PEG, indicating the successful introduction of PEG into the BHPU backbone. Fig. 4 shows the effects of PEG molecular weight on the mean particle size of the BHPUs. When DMPA was used alone as the hydrophilic chain segment and WDMPA = 2.4%, all BHPU samples were stable; however, when WDMPA was decreased to 2.2% and 2.0%, the BHPU dispersions without PEG were unstable. This indicated that there was a minimum dose of DMPA when used alone as the hydrophilic group to obtain a stable polyurethane dispersion.30 In addition, on each curve, the BHPU dispersions containing PEG200 were either unstable (WDMPA = 2.0%) or had a large particle size (WDMPA = 2.2% and WDMPA = 2.4%), which indicated that PEG200 had little effect on increasing the stability of the anionic BHPU dispersions compared with PEG400, PEG1000, and PEG2000. Moreover, the dispersions containing PEG400 and PEG1000 had smaller particle sizes than those with PEG2000, when WDMPA decreased to 2.2% and 2.0%. Therefore, the effect of PEG molecular weight on the dispersibility and stability of BHPUs followed the order PEG400 ≈ PEG1000 > PEG2000 ≫ PEG200. This phenomenon was due to the dispersion of BHPU and was evaluated using the Laplace equation, ΔP = 2γ/r.31 Fig. 5 shows a schematic diagram of the BHPU particle formation process during dispersion. During this, in order to cut the BHPU prepolymer into small particles, an applied shear force (F) was needed to overcome the additional pressure (ΔP) formed by the curved liquid surface, as well as energy due to the higher interface area. Therefore, to obtain a smaller particle size, i.e., a smaller radius (r) of the curved liquid surface, the surface tension of the liquid (γ) needed to be reduced because the external force (F) just was a limiting value. The hydrophilic molecular chains of PEG tended to segregate to the oil–water interface and decreased γ at the interface, which decreased the particle size. Moreover, the hydrophilicity of PEG could be evaluated by the hydrophilic properties of alkyl polyoxyethylene ether (APE, C11H23CH2OCH2CH2(OCH2CH2)nOCH2CH2OH) due to their similar structures. In the molecular formula, when n ≤ 5, the polymer has a low water solubility.32 For PEG200, n ≈ 4 and adjacent hydrophobic chains in urethane were much larger than those in APE. Thus, PEG200 was harder to enter into the surface of BHPU particles and contributed little to decreasing γ at the oil–water interface, which is why introducing PEG200 had the smallest effect on improving the BHPU dispersibility among all PEG samples in this study. PEG became more hydrophilic at higher molecular weights (Mw > 200), which allowed them to more easily enter the surface of BHPU particles. This permitted the formation of smaller particles and improved the emulsion stability. Although PEG2000 had the largest molecular weight, it did not produce the smallest particle size of all PEG samples. This was possibly because the long hydrophilic PEG chains entered into the water and formed a thick hydrated layer that exposed relatively few chains at the oil–water interface, resulting in a lower contribution to decreasing γ (Fig. 6). It could be concluded from the above analysis that incorporating a certain amount of PEG into the PU backbone reduced the minimum amount of DMPA required (the required dose for DMPA used alone is 2.4%) to stabilize BHPU dispersions. Table 2 shows some of the key properties of the BHPU dispersions and films which show that samples with incorporated PEG had a higher solid content than those (N2.4) without PEG.
O stretching vibration of urethane, respectively. The peaks at 2938 cm−1 and 2865 cm−1 were attributed to the C–H stretching vibration of CH3 and CH2, respectively. The peak at 1529 cm−1 was associated with C–N stretching vibrations. The absorption peak at 1103 cm−1 was attributed to the C–O–C stretching vibration, which appeared in the spectra of the samples containing PEG, indicating the successful introduction of PEG into the BHPU backbone. Fig. 4 shows the effects of PEG molecular weight on the mean particle size of the BHPUs. When DMPA was used alone as the hydrophilic chain segment and WDMPA = 2.4%, all BHPU samples were stable; however, when WDMPA was decreased to 2.2% and 2.0%, the BHPU dispersions without PEG were unstable. This indicated that there was a minimum dose of DMPA when used alone as the hydrophilic group to obtain a stable polyurethane dispersion.30 In addition, on each curve, the BHPU dispersions containing PEG200 were either unstable (WDMPA = 2.0%) or had a large particle size (WDMPA = 2.2% and WDMPA = 2.4%), which indicated that PEG200 had little effect on increasing the stability of the anionic BHPU dispersions compared with PEG400, PEG1000, and PEG2000. Moreover, the dispersions containing PEG400 and PEG1000 had smaller particle sizes than those with PEG2000, when WDMPA decreased to 2.2% and 2.0%. Therefore, the effect of PEG molecular weight on the dispersibility and stability of BHPUs followed the order PEG400 ≈ PEG1000 > PEG2000 ≫ PEG200. This phenomenon was due to the dispersion of BHPU and was evaluated using the Laplace equation, ΔP = 2γ/r.31 Fig. 5 shows a schematic diagram of the BHPU particle formation process during dispersion. During this, in order to cut the BHPU prepolymer into small particles, an applied shear force (F) was needed to overcome the additional pressure (ΔP) formed by the curved liquid surface, as well as energy due to the higher interface area. Therefore, to obtain a smaller particle size, i.e., a smaller radius (r) of the curved liquid surface, the surface tension of the liquid (γ) needed to be reduced because the external force (F) just was a limiting value. The hydrophilic molecular chains of PEG tended to segregate to the oil–water interface and decreased γ at the interface, which decreased the particle size. Moreover, the hydrophilicity of PEG could be evaluated by the hydrophilic properties of alkyl polyoxyethylene ether (APE, C11H23CH2OCH2CH2(OCH2CH2)nOCH2CH2OH) due to their similar structures. In the molecular formula, when n ≤ 5, the polymer has a low water solubility.32 For PEG200, n ≈ 4 and adjacent hydrophobic chains in urethane were much larger than those in APE. Thus, PEG200 was harder to enter into the surface of BHPU particles and contributed little to decreasing γ at the oil–water interface, which is why introducing PEG200 had the smallest effect on improving the BHPU dispersibility among all PEG samples in this study. PEG became more hydrophilic at higher molecular weights (Mw > 200), which allowed them to more easily enter the surface of BHPU particles. This permitted the formation of smaller particles and improved the emulsion stability. Although PEG2000 had the largest molecular weight, it did not produce the smallest particle size of all PEG samples. This was possibly because the long hydrophilic PEG chains entered into the water and formed a thick hydrated layer that exposed relatively few chains at the oil–water interface, resulting in a lower contribution to decreasing γ (Fig. 6). It could be concluded from the above analysis that incorporating a certain amount of PEG into the PU backbone reduced the minimum amount of DMPA required (the required dose for DMPA used alone is 2.4%) to stabilize BHPU dispersions. Table 2 shows some of the key properties of the BHPU dispersions and films which show that samples with incorporated PEG had a higher solid content than those (N2.4) without PEG.
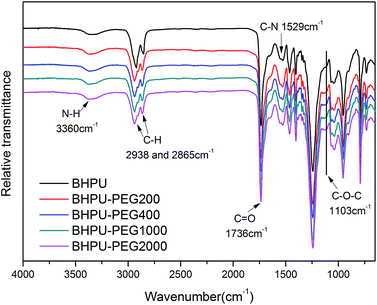 |
| | Fig. 3 FTIR spectra of BHPU films. | |
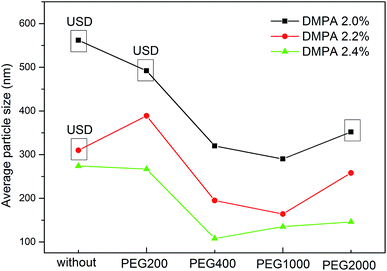 |
| | Fig. 4 The effects of PEG with different molecular weights on the average particle size of BHPUs. USD = unstable dispersion. | |
 |
| | Fig. 5 Schematic diagram of the BHPU particle formation during dispersion. | |
 |
| | Fig. 6 Schematic diagram of the BHPU particles with PEG2000 (a) and PEG with shorter molecular chains than PEG2000 (b). | |
Table 2 Selected properties of BHPU dispersions and films
| Samplea |
DMPAb (wt%) |
PEGb |
Sold content (%) |
Stability |
Tensile strength (MPa) |
Elongation ratio (%) |
| Samples were named by the synthetic route and hydrophilic group, e.g., N2.4 and N2.2 meant the WDMPA of the samples without PEG was 2.4% and 2.2%, respectively. NC2.4-4 and C2.4-4 meant the samples with PEG400 prepared by Route 1 and Route 2, respectively, and the WDMPA was 2.4%. WDMPA = WPEG, 2.4%, 2.2% and 2.0% of the weight of the BHPU prepolymer, respectively. |
| N2.4 |
2.4 |
— |
41.1 |
>6 months |
35 ± 1 |
439 ± 10 |
| N2.2 |
2.2 |
— |
— |
<1 day |
— |
— |
| NC2.4-4 |
2.4 |
PEG400 |
42.8 |
>6 months |
40 ± 1 |
524 ± 10 |
| C2.4-4 |
2.4 |
PEG400 |
45.2 |
>6 months |
49 ± 1 |
577 ± 10 |
| NC2.2-4 |
2.2 |
PEG400 |
48.9 |
>6 months |
30 ± 1 |
461 ± 10 |
| C2.2-4 |
2.2 |
PEG400 |
51.5 |
>6 months |
37 ± 2 |
542 ± 20 |
| NC2.0-4 |
2.0 |
PEG400 |
— |
<1 day |
— |
— |
| C2.0-4 |
2.0 |
PEG400 |
52.7 |
>6 months |
35 ± 1 |
588 ± 20 |
| NC2.4-20 |
2.4 |
PEG2000 |
42.4 |
>6 months |
39 ± 2 |
635 ± 20 |
| C2.4-20 |
2.4 |
PEG2000 |
41.7 |
>6 months |
43 ± 2 |
660 ± 20 |
| NC2.2-20 |
2.2 |
PEG2000 |
49.6 |
>6 months |
31 ± 2 |
469 ± 20 |
| C2.2-20 |
2.2 |
PEG2000 |
50.0 |
>6 months |
33 ± 2 |
580 ± 20 |
| NC2.0-20 |
2.0 |
PEG2000 |
— |
<1 day |
— |
— |
| C2.0-20 |
2.0 |
PEG2000 |
— |
<1 day |
— |
— |
From the analysis above, the introduction of PEG significantly improved the dispersion, stability and solid content of anionic WPU. However, the movement of PEG molecular chains may have been restricted by adjacent hydrophobic chains, and not all of PEG molecules may have been introduced into the oil–water interface to help decrease γ and increase the stability of the WPU emulsion. According to Route 2, if all PEG molecules associated with DMPA were used to prepare the BHPU, the matrix of those hydrophilic groups should be more hydrophilic and be able to more easily access the water–oil interface. This should obtain the most stable BHPU dispersion. Since PEG400 and PEG1000 had similar effects and produced better WPU dispersions than PEG2000, PEG400 and PEG2000 were introduced into the WPU backbone and used to synthesize BHPUs by Routes 1 and 2. The two different synthesis routes formed different association relationships between DMPA and PEG.
Effect of the synthetic route on BHPU particle size and solid content
Fig. 7 shows the influence of different synthesis routes on the BHPU particle size. Fig. 7(a) and (c) show that the samples (C2.4-4 and C2.2-4) synthesized by Route 2 possessed a smaller particle size than those (NC2.4-4 and NC2.2-4) synthesized by Route 1. This indicated the direct association of all PEG400 molecules with DMPA, which promoted easier access of the hydrophilic groups to the oil–water interface and presented a significant synergistic influence on the polyurethane dispersion. The samples containing PEG2000 exhibited different results compared to those with PEG400. When WDMPA was 2.2% (Fig. 7(d)), the curve showed the same trend as that of the samples with PEG400, i.e., the sample (C2.2-20) prepared by Route 2 had a smaller particle size than that of the sample (NC2.2-20) prepared by Route 1. However, when WDMPA was 2.4% (Fig. 7(b)), the opposite trend was observed, and the sample (C2.4-20) synthesized by Route 2 showed a larger particle size than that of the sample (NC2.4-20) synthesized by Route 1. The different particle sizes (with PEG2000, WDMPA = 2.4%) may be because the introduction of PEG2000 had a dual impact on the BHPU properties. On one hand, the introduction of PEG2000 decreased γ, which decreased the BHPU particle size. On the other hand, the long hydrophilic chains of PEG2000 entered into the water and formed a thick hydrate layer which increased the particle size of the BHPUs. The impact of the latter had more of an effect on the BHPU properties in the sample containing PEG2000 and 2.4% DMPA. However, decreasing γ dominated in the sample with PEG2000 and 2.2% DMPA, which increased the dispersion of the BHPUs.
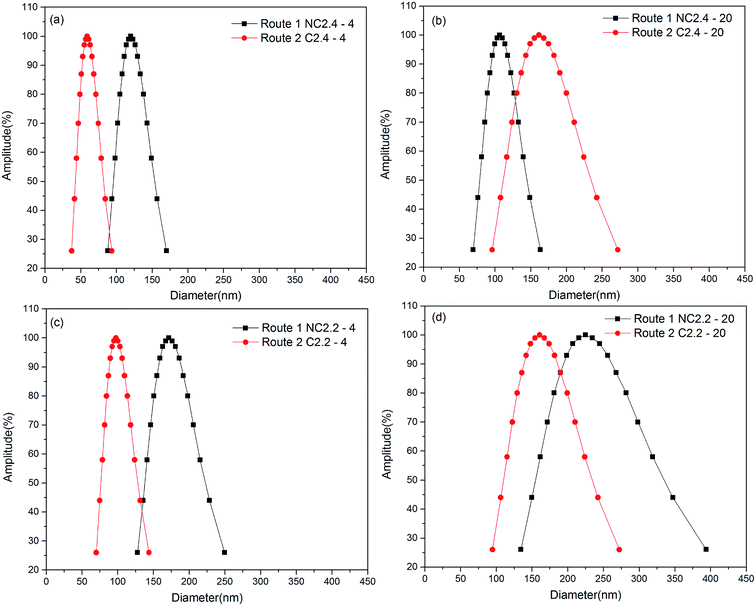 |
| | Fig. 7 The influence of different synthetic routes on BHPU particle size and solid content. (a) Containing 2.4% DMPA and 2.4% PEG400. (b) Containing 2.4% DMPA and 2.4% PEG2000. (c) Containing 2.2% DMPA and 2.2% PEG400. (d) Containing 2.2% DMPA and 2.2% PEG2000. | |
The influence of different synthesis routes on the stability of the BHPU dispersions is shown in Table 2. The sample (C2.0-4) synthesized via Route 2 was stable, while the sample (NC2.0-4) synthesized by Route 1 was unstable (<1 day). Both samples C2.0-20 and NC2.0-20 were unstable whether they were synthesized via Route 2 or Route 1. These results further demonstrate that PEG400 had a better effect on enhancing the dispersion and stability of BHPUs than PEG2000 when all PEG was directed linked with DMPA. When the minimum required DMPA content was reduced to 2.0%, the solid content of the corresponding sample (C2.0-4) synthesized by Route 2 increased to 52.7%.
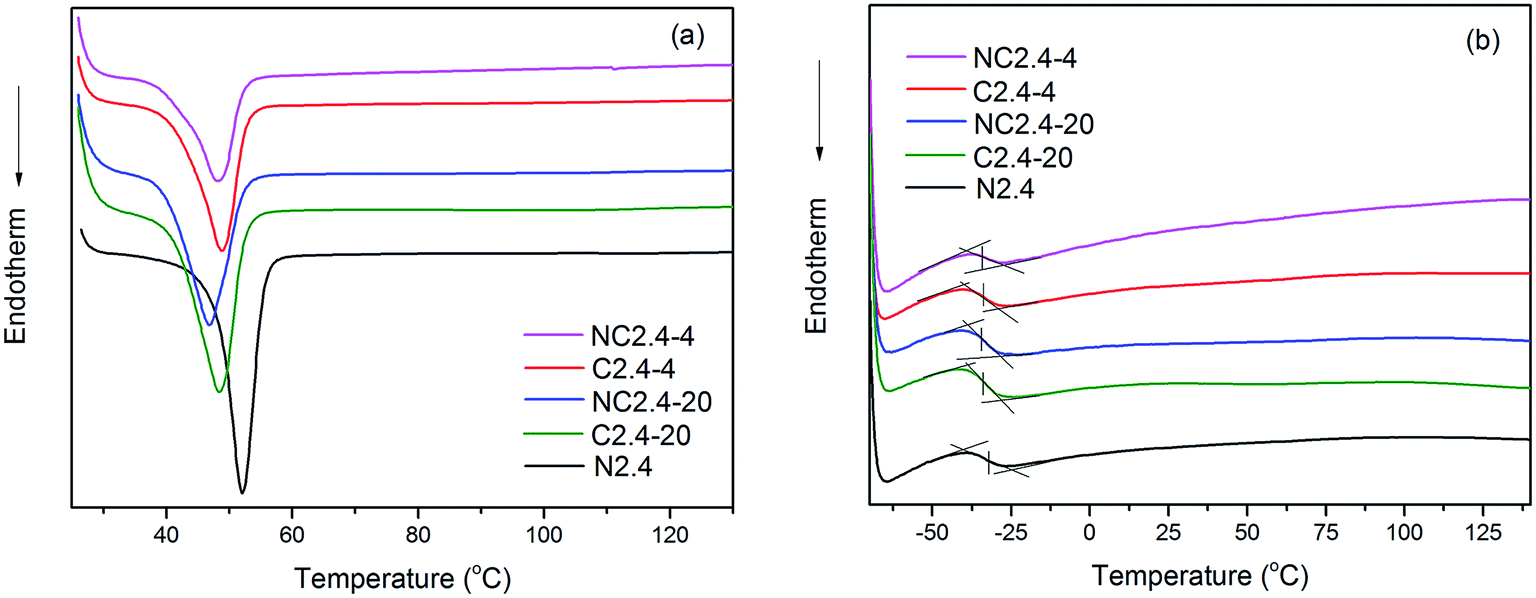
Effect of synthesis route on the thermal and crystalline properties of BHPU films
The thermal properties of BHPU samples were investigated by DSC. Fig. 8(a) and (b) show the DSC thermograms of BHPU samples in the first heating scan and the second heating scan, respectively, and Table 3 shows the corresponding DSC data. The sample without PEG (N2.4) had a higher melting temperature (Tm) and heat of fusion (ΔHm) than the other BHPU samples. In addition, the degree of crystallinity (αc) of the BHPU samples was calculated via the following formula (1):33–35| | |
αcBHPU% = 100 × ΔHBHPU/ΔHPCL × (wt%PCL)
| (1) |
where wt%PCL is the weight percentage of PCL in BHPU samples, and ΔHPCL and ΔHBHPU represent the heats of fusion of neat PCL and BHPU samples, respectively. The value of ΔHPCL was 139.5 J g−1.
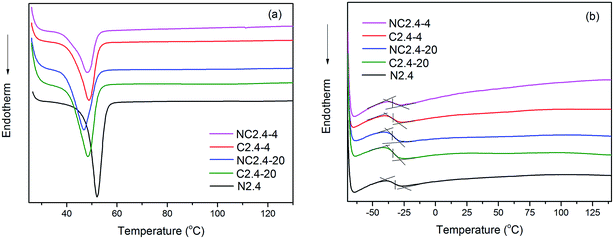 |
| | Fig. 8 DSC thermograms of BHPUs prepared using different synthetic routes: (a) first heating at 10 °C min−1, (b) second heating at 10 °C min−1. | |
Table 3 DSC results of BHPU samples
| Samples |
Tgs (°C) |
Tm (°C) |
ΔHm (J g−1) |
αc (%) |
| N2.4 |
−30.2 ± 0.3 |
52.1 ± 0.2 |
30.4 ± 0.2 |
32.0 ± 0.2 |
| C2.4-20 |
−34.1 ± 0.5 |
48.4 ± 0.2 |
23.1 ± 0.1 |
24.3 ± 0.1 |
| NC2.4-20 |
−34.8 ± 0.5 |
46.7 ± 0.2 |
22.4 ± 0.2 |
23.6 ± 0.2 |
| C2.4-4 |
−34.0 ± 0.5 |
49.4 ± 0.2 |
23.0 ± 0.2 |
24.2 ± 0.2 |
| NC2.4-4 |
−34.6 ± 0.5 |
48.2 ± 0.2 |
19.2 ± 0.1 |
20.2 ± 0.1 |
From Table 3, the αc of the BHPU sample (NC2.4) was the highest, which indicated that the incorporation of PEG hindered the crystallization of the BHPU soft segments.36 The influence of the two synthesis routes on the thermal and crystalline properties of BHPU films are also shown in Fig. 8 and Table 3. The samples (C2.4-4 and C2.4-20) prepared using Route 2 had a higher Tm, ΔHm, and αc than those synthesize via Route 1 (NC2.4-4 and NC2.4-20). This might have occurred because the direct link of DMPA with PEG enhanced the interactions between DMPA and PEG, which prevented the PEG from entering the soft segments and decreased the PEG chain motion, increasing the crystallinity of the soft segments. Moreover, from Fig. 8(b), sample (N2.4) had the highest glass transition temperature of its soft segments (Tgs: −30.2 °C) among the five BHPU samples because the introduction of PEG increased the molecular mobility and decreased Tgs. In addition, the Tgs of the other four samples with PEG were similar and at about −34 °C.
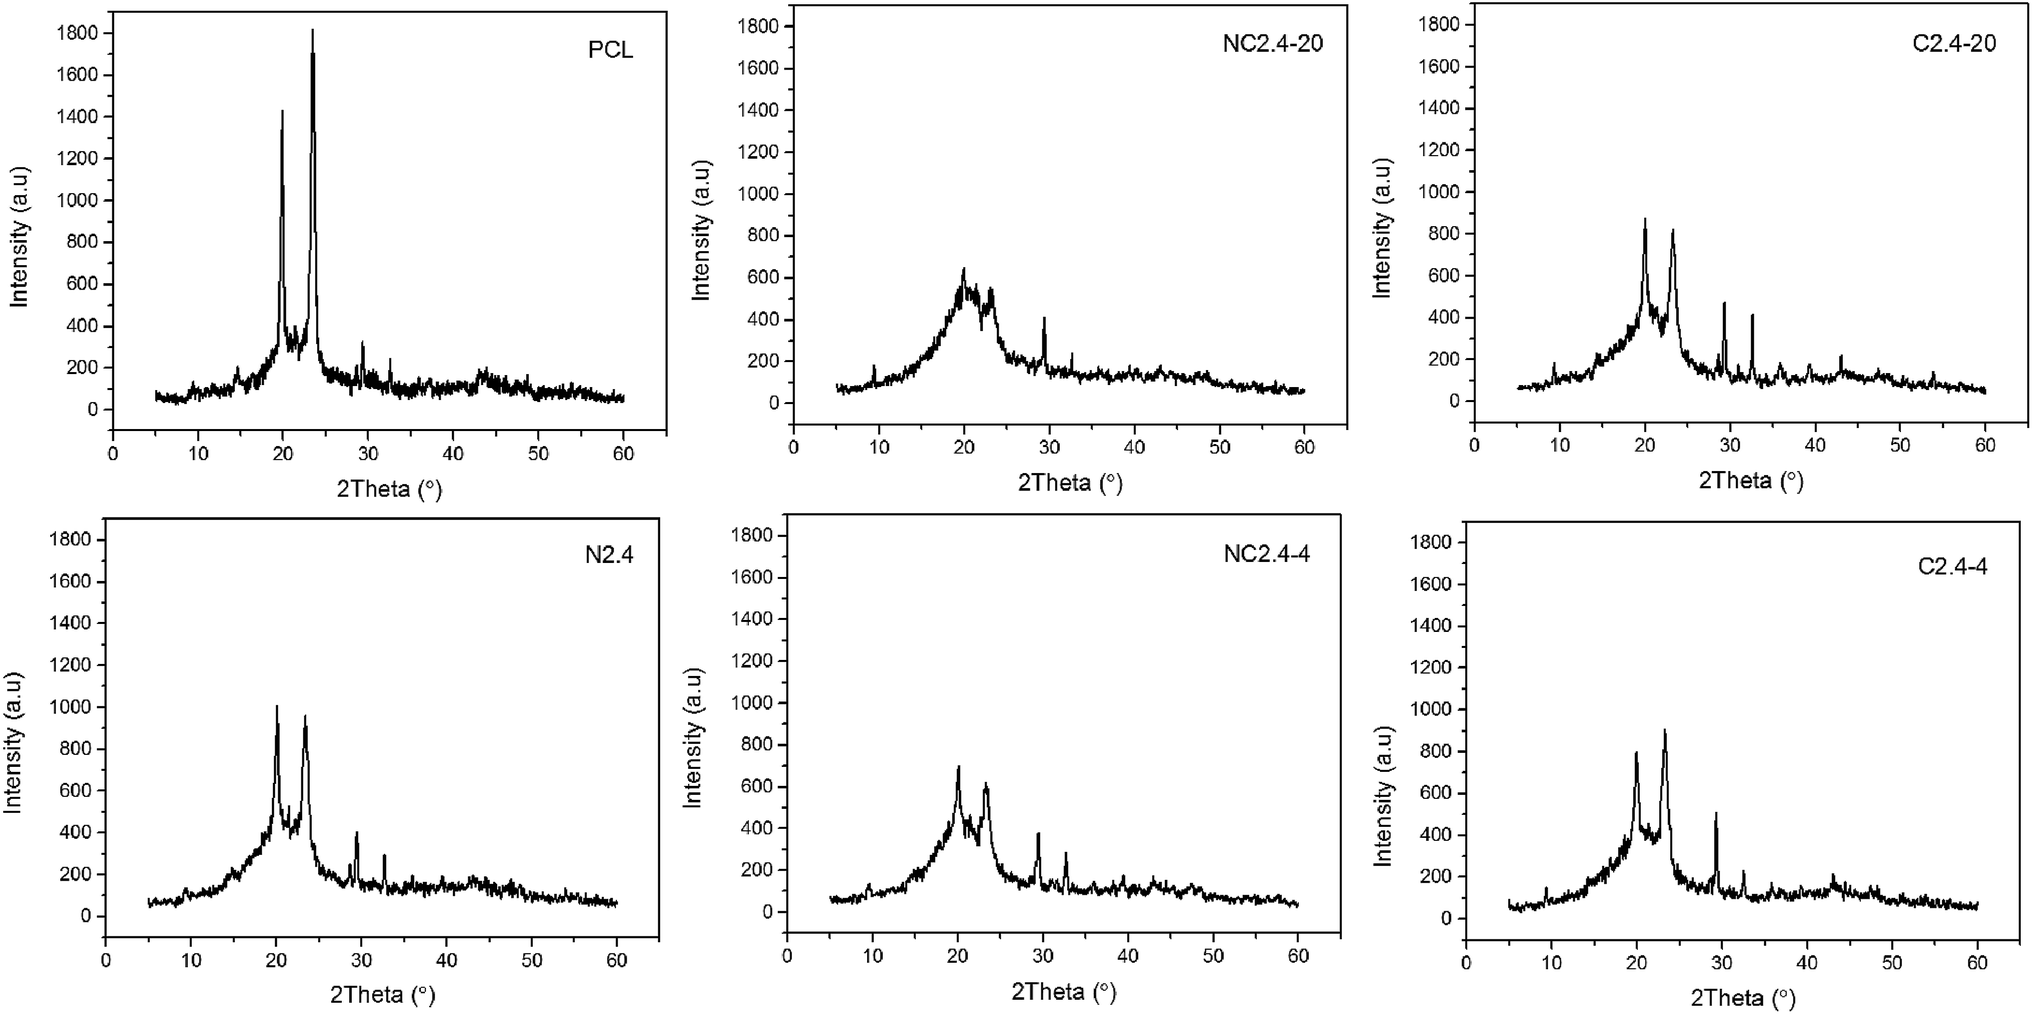
Due to PCL ordered structure, it was easy to crystallize in segmented PU. In order to gain deeper insight into the crystal structure of the BHPU samples, the XRD diffraction patterns of neat PCL and BHPU samples were determined and the results depicted in Fig. 9. All BHPU samples exhibited two prominent diffraction peaks around 21.48° assigned to the (110) plane and 23.8° attributed to the (200) plane of the PCL soft segments,37 and the intensity of both peaks was relatively weak compared to neat PCL. Therefore, the crystalline structure of BHPU samples originated from PCL soft segments and the crystallization ability of PCL was likely confined by interference of hard segments. In addition, all BHPU samples showed two weak diffraction peaks around 30°, which were similar to neat PCL, suggesting that these peaks were caused by the crystallization of PCL soft segment. The XRD patterns also showed that the intensity of the two main diffraction peaks at 2θ of 21.48° and 23.8° of the sample (N2.4) without PEG was higher than the other four samples with PEG. The intensity of the main diffraction peaks of sample (N2.4) was around 1000, while that of the other four samples was significantly less than 1000. Previous studies have confirmed that the crystallinity of polyurethane mainly depends on the type and content of the soft segment.38 The soft segments of all BHPUs were the same (68%), therefore, it can be concluded that the introduction of PEG decreased the crystallinity of the BHPU films. This was because the incorporation of a polyether polyol-like impurity destroyed the regularity of the PCL chain segments which suppressed the crystallization of PCL soft segments.36,39 Moreover, compared with the samples (C2.4-4 and C2.4-20) prepared by Route 2, the dominant diffraction peak of the samples (NC2.4-4 and NC2.4-20) prepared by Route 1 was weaker and broader, which indicated that Route 2, which involved the direct association of DMPA and PEG, increased the crystallization of BHPU films. The above results were in agreement with the DSC analysis.
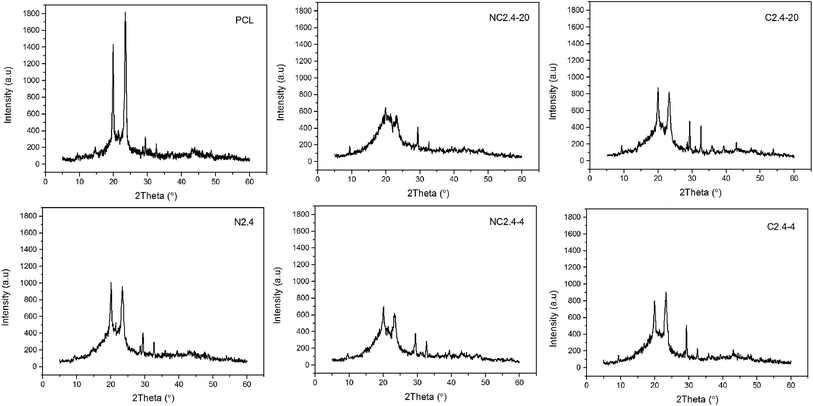 |
| | Fig. 9 X-ray diffractograms of neat PCL and BHPU samples prepared by different synthetic routes. | |
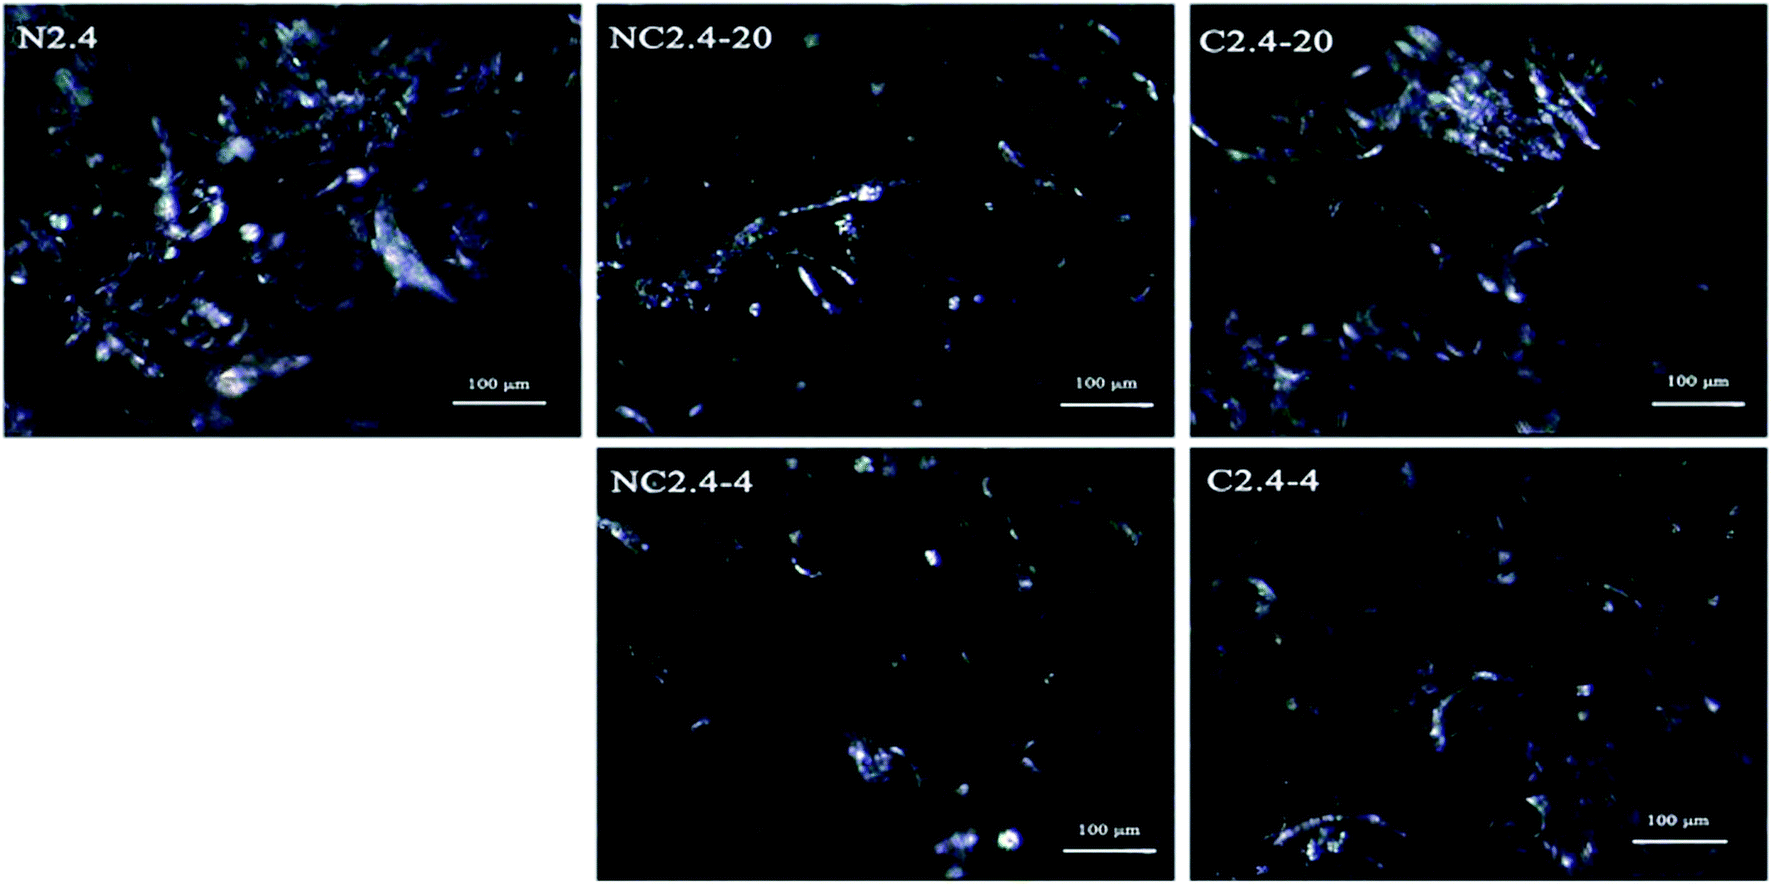
The crystallinity of the BHPU samples could be also described by POM micrographs at a 480 × 630 resolution. The POM micrographs of the BHPU samples in Fig. 10 show that all BHPU samples were crystalline, but their crystal sizes and density were different. The crystal size and density of sample (N2.4) was the largest among the five samples. Meanwhile, the crystal size of samples (C2.4-4 and C2.4-20) was larger than those of samples (NC2.4-4 and NC2.4-20). These results agreed well with the DSC and X-ray measurements.
 |
| | Fig. 10 POM images of BHPUs prepared by different synthesis routes. | |
The influence of synthesis route on the dynamic mechanical properties of BHPU films
Fig. 11 shows the influence of introducing PEG 400 or PEG2000 into the PU backbone on the storage and loss modulus as a function of the BHPU film temperature. Fig. 11(a) shows that at temperatures below −40 °C, the storage modulus of the three BHPU samples was nearly unchanged by the temperature, indicating they were in the glassy state. As the temperature increased, these samples gradually entered the glass transition region, and the storage modulus began to decrease rapidly. Compared with the samples without PEG, the storage modulus of the samples with PEG400 or PEG2000 decreased faster upon increasing the temperature. This could be explained by the fact that introducing PEG into the BHPUs reduced the crystallinity of the samples (confirmed by DSC and XRD), resulting in a quicker decline of the storage modulus above the Tgs.
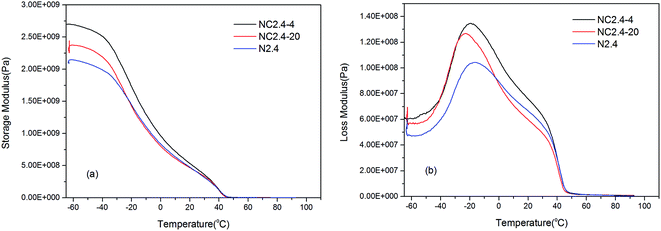 |
| | Fig. 11 The influence of PEG introduction on the dynamic mechanical properties of BHPU samples: (a) the storage modulus, (b) the loss modulus. | |
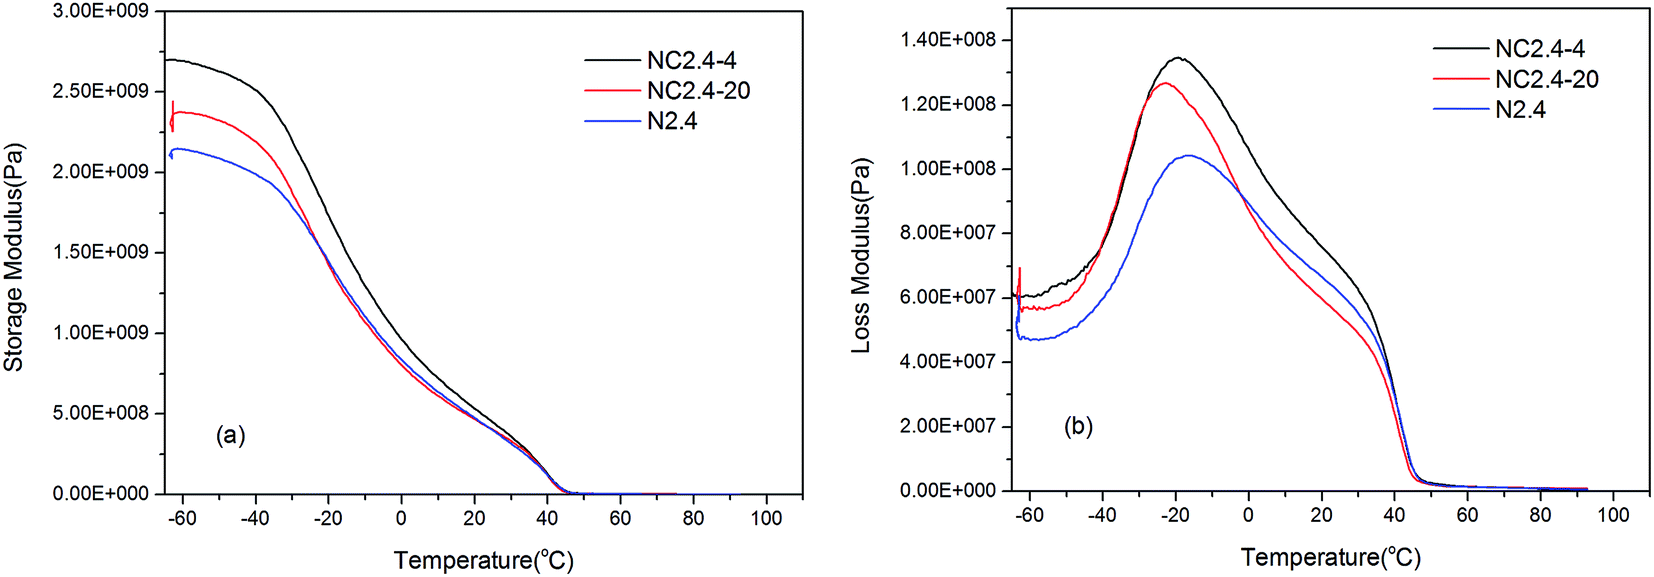
In addition, Fig. 11(b) shows that the loss modulus of the three BHPU samples varied with the temperature, and there was a transition peak corresponding to the Tgs on each curve. The peak of sample N2.4 was wider, and its Tgs was higher than that of the other two PEG-containing samples, which indicated that the soft segment mobility of sample N2.4 varied more and was more restricted than those containing PEG. Moreover, the Tgs of sample N2.4-4 was slightly higher than sample N2.4-20, possibly because BHPU samples with shorter molecular chains (PEG400) were less flexible than those of PEG2000, which resulted in a higher Tgs in the sample with PEG400 than that with PEG2000.
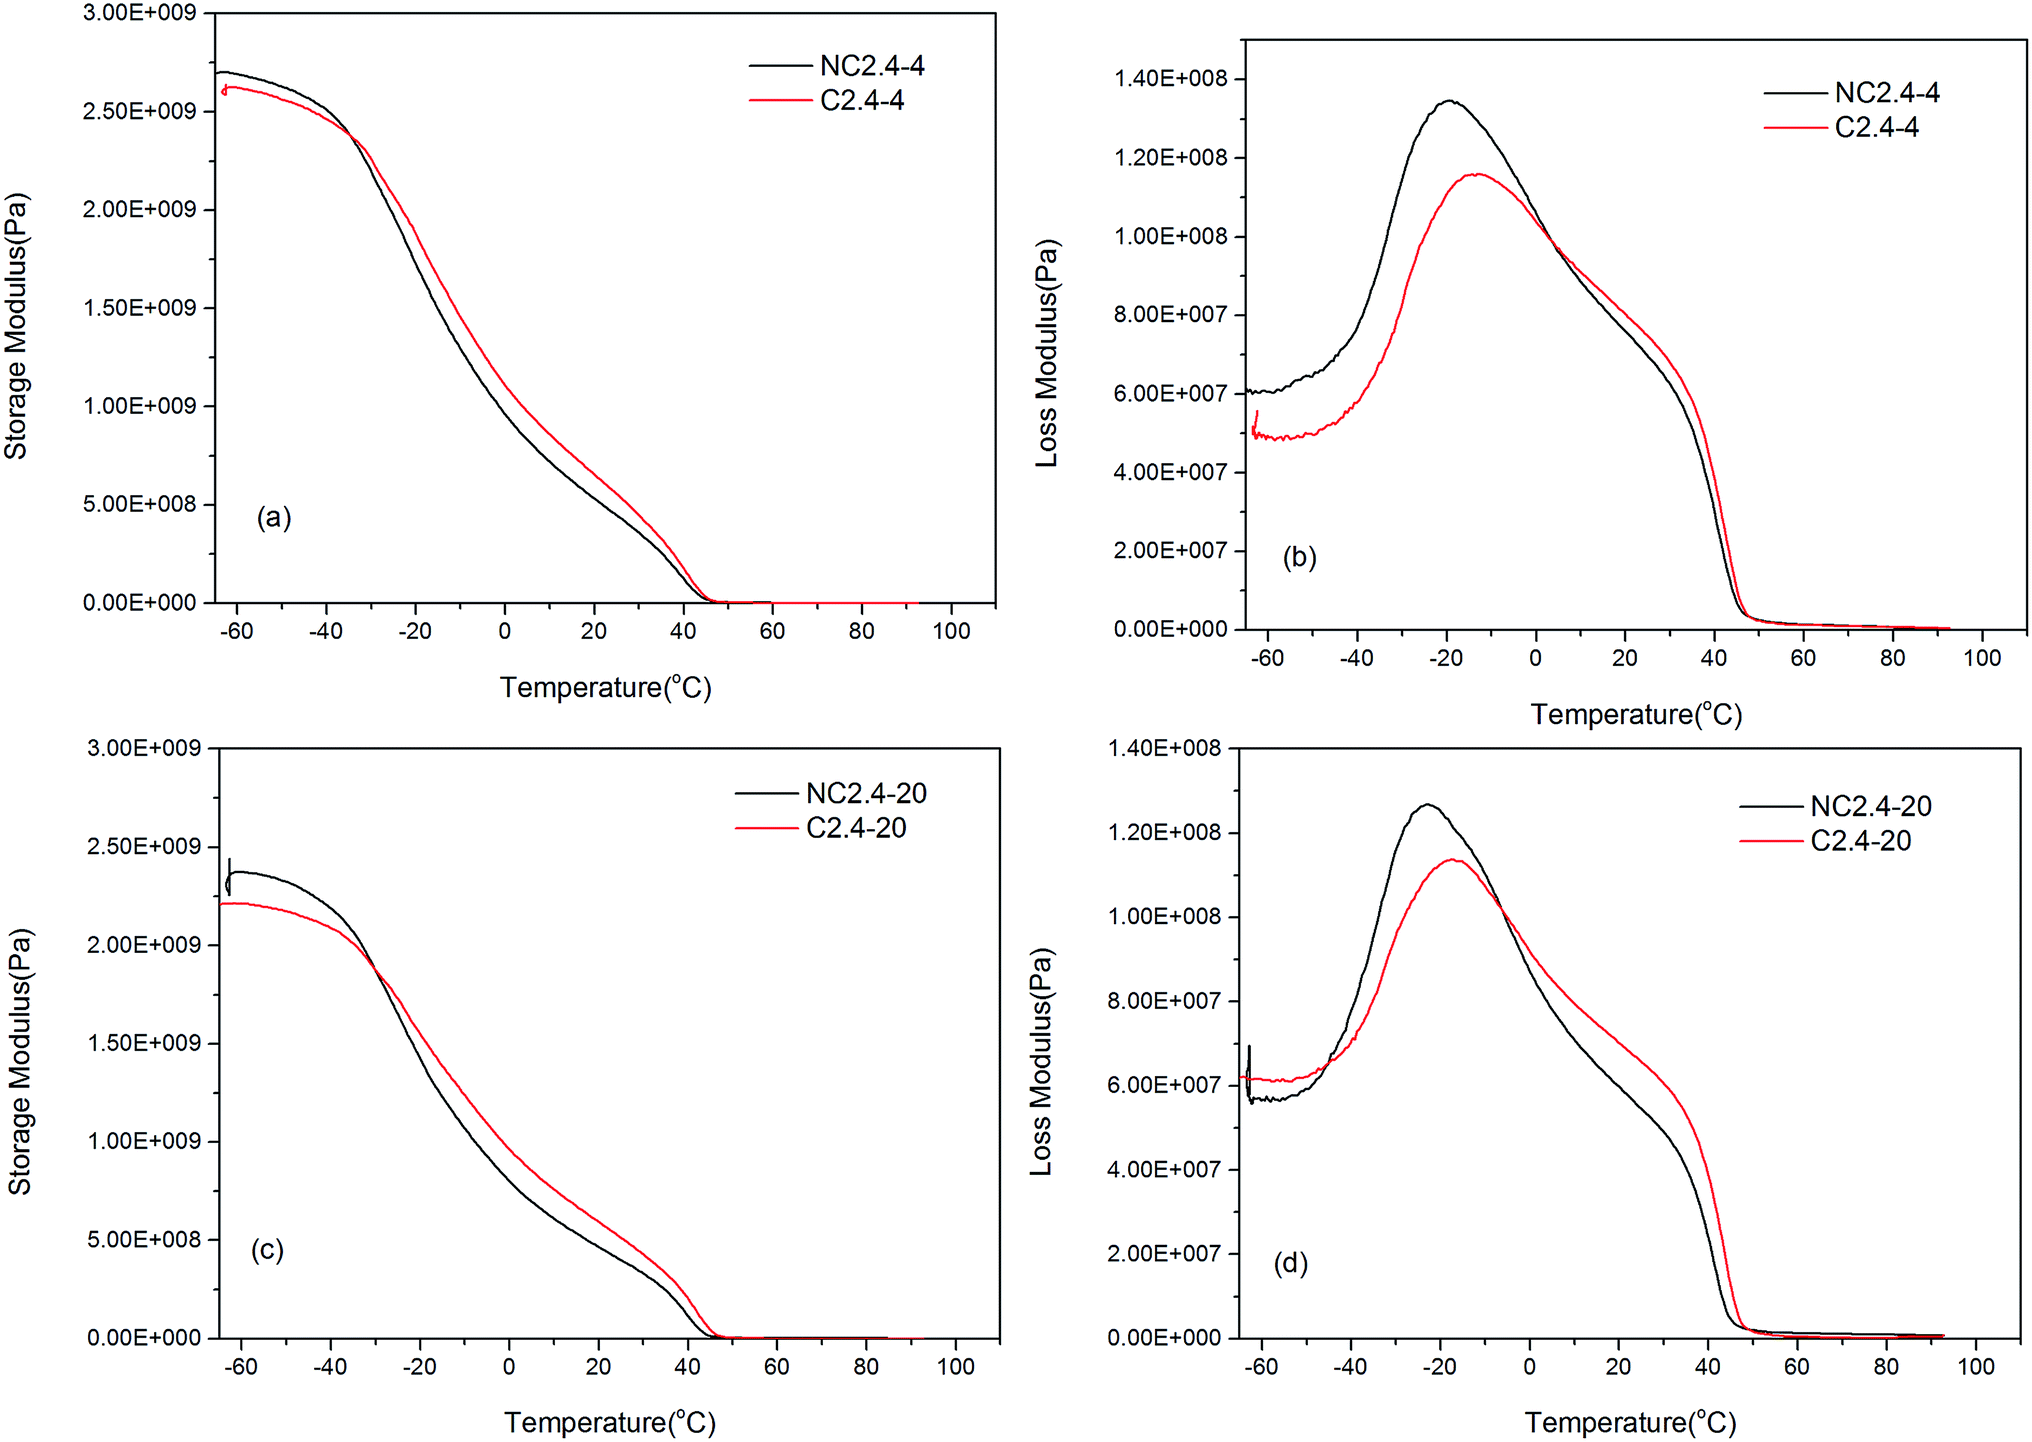
Moreover, Fig. 12 shows the influence of the two different synthesis methods on the dynamic mechanical properties of the BHPU samples. Compared with the samples (C2.4-4 and C2.4-20) prepared by Route 2, the storage modulus of the samples (NC2.4-4 and NC2.4-20) synthesized via Route 1 decreased more quickly. Meanwhile, the samples prepared via Route 2 had slightly higher Tgs values (C2.4-4 > NC2.4-4, C2.4-20 > NC2.4-20). These results also confirmed that the direct association of DMPA with PEG introduced relatively little PEG into the soft segment of BHPUs, which increased the Tgs. The Tgs measurements from DMA were not the same as those obtained from DSC (the Tgs of the four samples containing PEG was about −34 °C) because the test mechanisms of DMA and DSC were different.
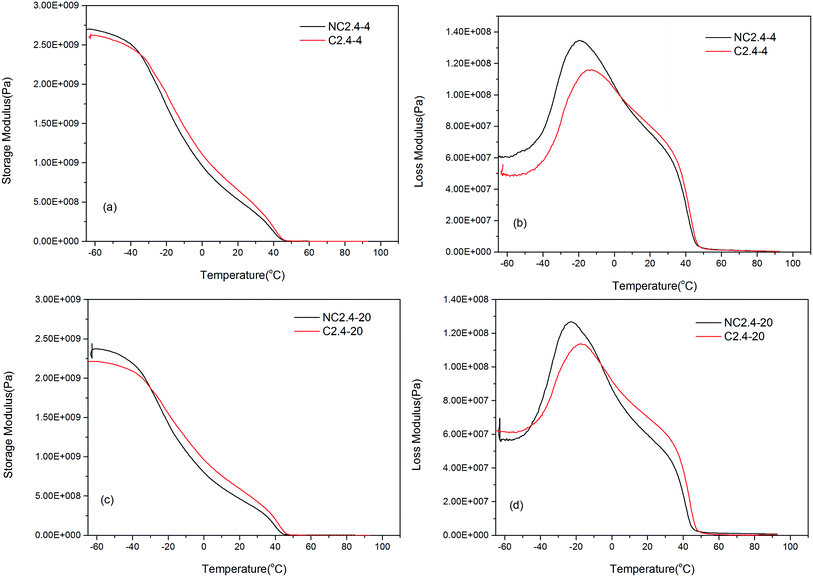 |
| | Fig. 12 The influence of different synthetic routes on the dynamic mechanical properties of BHPU films, (a and c) the storage modulus of the samples with PEG400 and PEG2000, respectively; (b and d) the loss modulus of the samples with PEG400 and PEG2000, respectively. | |
The influence of different synthesis routes on the mechanical properties of BHPU films
The tensile properties obtained from the stress–strain curves of the BHPU films are summarized in Table 2, which shows that the samples with a DMPA dosage of 2.4% had better stress–strain properties than those with 2.2%. For example, the tensile strength and elongation ratios of samples (NC2.4-4) and (C2.4-4) with 2.4% DMPA were 40 MPa and 49 MPa, and 524% and 577%, respectively, while those of samples (NC2.2-4 and C2.2-4) with 2.2% DMPA were 30 MPa and 37 MPa, and 461% and 542%, respectively. The lower DMPA dosage reduced the coulombic forces and hydrogen bonding in the molecules, which decreased the cohesive energy.40 In addition, the lower amount of DMPA resulted in worse dispersion. These combined factors led to lower tensile properties of the samples with 2.2% DMPA.
The synthesis method also affected the tensile properties of the WBPUs. The samples (C2.4-4, C2.2-4, C2.2-20, and C2.2-20) prepared by Route 2 had a higher tensile strength and elongation at break than those (NC2.4-4, NC2.2-4, NC2.2-20 and NC2.2-20) synthesized by Route 1. This phenomenon could be explained by noting that the samples prepared via Route 2 were more crystalline which resulted in a greater degree of phase separation between their soft and hard segments, which improved the tensile properties.41
The influence of different synthetic routes on water absorption, contact angle, and surface energy of BHPU films
Water absorption is an indicator of the bulk hydrophilicity of the polyurethane films and is also an important factor for studying a material's biodegradability.42 The water absorption data as a function of time for five BHPU films are listed in Table 4. The data show that the water absorption ratio of sample N2.4 without PEG remained nearly unchanged after 48 h, while those of the other PEG-containing samples were essentially unchanged after 72 h. Sample N2.4 had the lowest water absorption at each time point among the five samples. These results indicate that the hydrophilicity of the samples containing PEG was higher than those of sample N2.4 which only used DMPA. This was because the introduction of PEG increased the number of hydrophilic groups in the WPU backbone, which increased the water absorption ratio. In addition, compared with the samples containing PEG2000, the samples with PEG400 had a lower water absorption ratio at each time point, which indicated that the BHPUs containing PEG with shorter molecular chains had better water resistance than those with longer PEG chains.43 Additionally, the BHPU samples prepared by Route 2 had a higher water resistance than those prepared by Route 1 due to the higher crystallinity of the former, which made it more difficult for water molecules to enter the BHPU films.
Table 4 Water absorption, contact angle, and surface energy data for the WPU films
| Sample |
Water absorption (%) |
Contact angle (°) |
Surface energy (mJ m−2) |
| 24 h |
48 h |
72 h |
96 h |
H2O |
(CH2OH)2 |
γps |
γds |
γs |
| N2.4 |
2.3 |
4.4 |
4.6 |
4.7 |
93.8 |
63.3 |
21.3 |
7.0 |
28.3 |
| NC2.4-20 |
5.8 |
9.7 |
10.4 |
10.4 |
78.3 |
58.2 |
12.9 |
18.8 |
31.7 |
| C2.4-20 |
4.5 |
6.9 |
7.7 |
7.8 |
87.0 |
57.6 |
19.4 |
10.7 |
30.1 |
| NC2.4-4 |
3.1 |
4.9 |
6.8 |
7.1 |
88.4 |
60.1 |
18.4 |
10.4 |
28.8 |
| C2.4-4 |
2.6 |
4.6 |
6.4 |
6.7 |
90.3 |
61.4 |
19.1 |
9.3 |
28.4 |
The water contact angle and surface energy of the BHPU films are two important properties that affect their applications. The water contact angle can reveal the wetting properties of the BHPU film surface, while the surface free energy (γs) can be used to evaluate the repellency of polyurethane films to water and soil.44 In order to further investigate the surface properties of the BHPU samples, the surface free energy (γs) was calculated by the static contact angle of two liquids (water and ethylene glycol) via formulas (2) and (3).45–47
| |
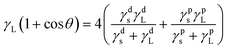 | (2) |
where
γs is the surface energy,
γds and
γps are the dispersion components of
γs and the polar component of
γs for the solid, respectively;
γL is the surface tension,
γdL and
γpL are the dispersion component of
γL and the polar component of
γL for the liquid, respectively. The dispersion component and polar component of water, and ethylene glycol are 21.8 mJ m
−2 and 51.0 mJ m
−2, and 29.3 mJ m
−2 and 19.0 mJ m
−2, respectively.
Fig. 13 shows images of the static water contact angles of the BHPU films, and the water contact angle data and γs of the BHPU films are also listed in Table 4. Sample N2.4 without PEG had the highest water contact angle (93.8°) and the lowest surface energy (28.3 mJ m−2) compared with the other four BUPU samples. This showed that sample N2.4 had the worst wetting properties, but the best water and soil repellency due to the hydrophobic nature of PCL.48 In the other four BHPU samples containing PEG, the γs of the samples prepared via Route 2 was slightly smaller than that of the samples prepared via Route 1, which indicated that the samples synthesized by Route 2 had better water and soil repellency than the samples synthesized via Route 1.
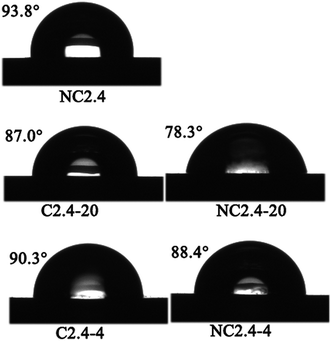 |
| | Fig. 13 The influence of synthesis route on the water contact angle of BHPU films. | |
Biodegradation of the BHPU samples
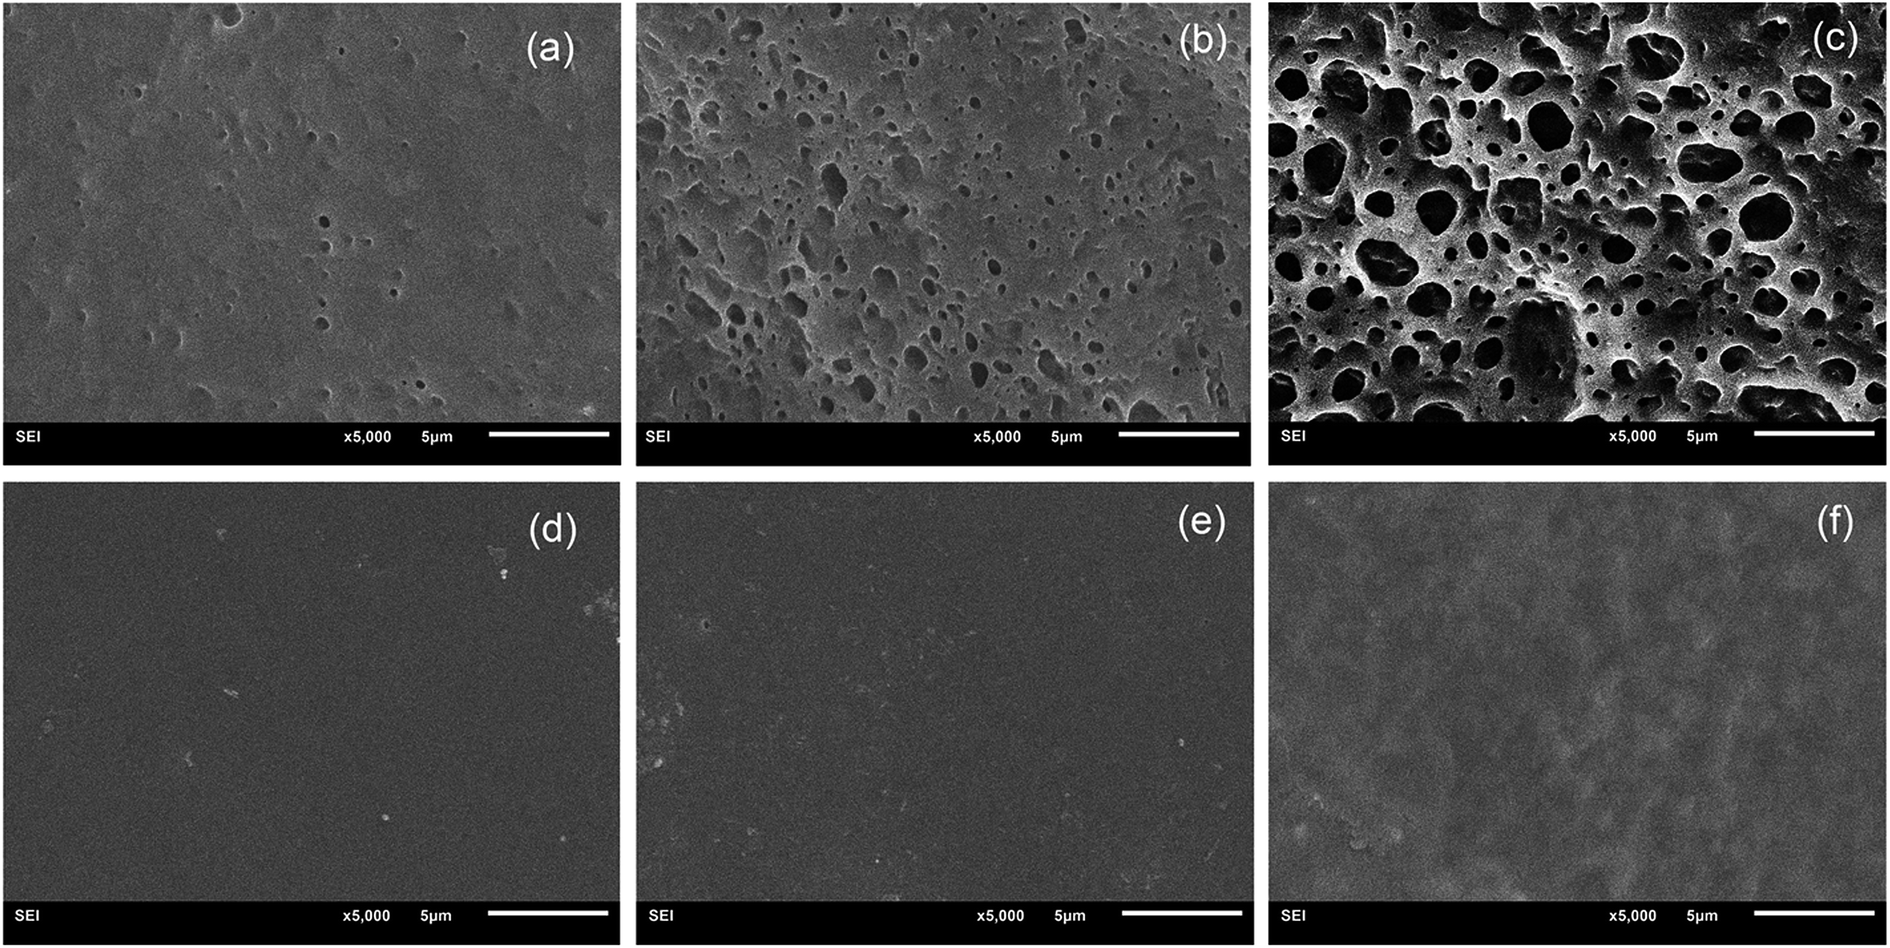
The hydrolytic degradation of PCL-based PUs is very slow, and in most cases, they can be degraded at an accelerated rate in the presence of lipase.48,49 The enzymatic procedure is a convenient method for assessing biodegradation,50,51 and thus, the degradation of BHPU samples was investigated in PBS solution and also in PBS/lipase solution over 4 weeks. The weight loss at various degradation periods and molecular weight changes of the BHPU samples over 4 weeks were evaluated, and none of the BHPU samples obviously degraded in PBS solution within 4 weeks. However, when these samples were degraded in PBS/lipase solution, a faster and more pronounced degradation occurred (Fig. 14 and 15). As shown in Fig. 14, compared with the other four samples containing PEG, sample N2.4 had the highest degradation rate in PBS/lipase, reaching a weight loss of 19% after 4 weeks of degradation. The soft segment of sample N2.4 consisted entirely of PCL, and PCL can be degraded by lipase; therefore, its degradation rate was highest among the five BHPU samples. The weight loss of the other four samples at the same time intervals was similar, indicating that the effects of small amounts of PEG with different molecular weights and synthesis routes had only a small effect on the degradation rate of the BHPUs. Fig. 15 shows the SEM images of samples C2.4-4 degraded in PBS/lipase and PBS at 1 week, 2 weeks, and 4 weeks. When degraded in PBS/lipase for 1 week, some small voids were formed on the BHPU film surfaces, and the depths of these holes were different (Fig. 15(a)). When the degradation time increased to 2 weeks, the voids on the BHPU films increased and became deeper (Fig. 15(b)). After degradation for 4 weeks, the holes continued to increase and formed a mesh film (Fig. 15(c)). In contrast, when the samples were degraded in PBS, no obvious erosion was observed on the film surface after 4 weeks of degradation (Fig. 15(d)–(f)).
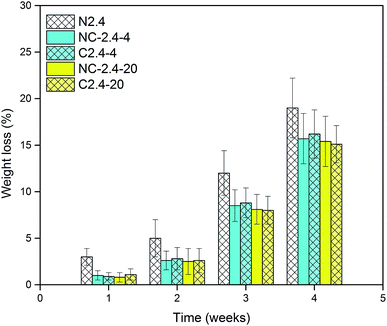 |
| | Fig. 14 Weight loss of BHPU samples degraded in PBS/lipase. | |
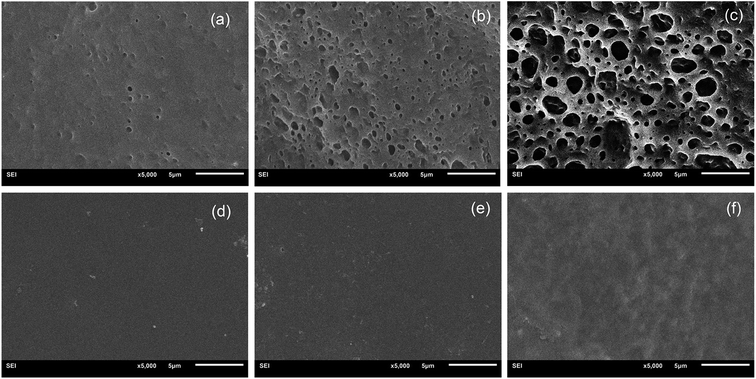 |
| | Fig. 15 SEM images of C2.4-4 degraded in PBS/lipase at 1 week (a), 2 weeks (b) and 4 weeks (c); and in PBS at 1 week (d), 2 weeks (e) and 4 weeks (f). | |
The changes in the molecular weight of BHPU samples degraded in PBS and PBS/lipase were evaluated by GPC (Table 5). The Mn of the BHPU samples exhibited no significant changes when degraded in PBS for 4 weeks. However, when the degradation was performed in PBS/lipase for 4 weeks, the Mn of sample N2.4 decreased by 8.7%, while the other four samples decreased by 6.0–6.8%. These results showed that the four samples containing PEG had similar reductions in their Mn, and the introduction of PEG did not increase the degradation rate of BHPUs even though PEG was hydrophilic.
Table 5 GPC analysis of BHPU samples before and after degradation in PBS and PBS/lipase
| Sample |
No (0 weeks) |
PBS (4 weeks) |
PBS/lipase (4 weeks) |
| Mn |
Mw/Mn |
Mn |
Mw/Mn |
Mn |
Mw/Mn |
| N2.4 |
41523 |
1.88 |
41464 |
1.90 |
37907 |
1.96 |
| NC2.4-4 |
40292 |
1.79 |
40198 |
1.79 |
37531 |
1.95 |
| C2.4-4 |
40289 |
1.81 |
40212 |
1.83 |
37868 |
1.92 |
| NC2.4-20 |
43289 |
1.96 |
43005 |
1.97 |
40468 |
2.01 |
| C2.4-20 |
43365 |
1.97 |
43167 |
1.97 |
40641 |
2.13 |
Conclusions
A series of BHPU samples were prepared by incorporating PEG with different molecular weights into the PU backbone of PCL using two different synthesis methods. The results showed that the samples with molecular weights of 400 g mol−1 and 1000 g mol−1 provided the best dispersion and stability of BHPUs. In the two synthesis methods, the method which directly associated all of the PEG molecules with DMPA enhanced the crystallization properties, water and soil repellence, tensile properties of the BHPU samples, and increased the solid content of the samples to 52.7%. The biodegradability of the BHPU samples was also evaluated. The results indicated that the sample without PEG degraded faster in PBS/lipase solution than the samples with PEG. The molecular weight of PEG and the association relationship between DMPA and PEG had no obvious effect on the biodegradability of BHPU samples. The results also showed that none of the BHPU samples were degraded in PBS solution within 4 weeks.
Conflicts of interest
There are no conflicts to declare.
Acknowledgements
This study was funded by science and technology project from Jilin Province Ministry of Education (Grant number JJKH20191304KJ) and Industrial Technology Research and Development Project from Jilin Province (Grant number 2019C046-5).
References
- V. García-Pacios, V. Costa, M. Colera and J. H. Martín-Martínez, Prog. Org. Coat., 2011, 71, 136–146 CrossRef
 .
. - R. Udagama, E. Degrandi-Contraires, C. Creton, C. Graillat, T. F. L. McKenna and E. Bourgeat-Lami, Macromolecules, 2011, 44, 2632–2642 CrossRef CAS .
- C. Fang, X. Zhou, Q. Yu, S. Liu, D. Guo, R. Yu and J. Hu, Prog. Org. Coat., 2014, 77, 61–71 CrossRef CAS .
- S. A. Madbouly and J. U. Otaigbe, Macromolecules, 2006, 39, 4144–4151 CrossRef CAS .
- S. A. Madbouly, Y. Xia and M. R. Kessler, Macromolecules, 2013, 46, 4606–4616 CrossRef CAS .
- T. Wan and D. J. Chen, J. Mater. Sci., 2017, 52, 197–207 CrossRef CAS .
- G. T. Howard, Int. Biodeterior. Biodegrad., 2002, 49, 245–252 CrossRef CAS .
- T. J. Lee, S. H. Kwon and B. K Kim, Prog. Org. Coat., 2014, 77, 1111–1116 CrossRef CAS .
- X. Zhou, Y. Li, C. Q. Fang, S. J. Li, Y. L. Cheng, W. Q. Lei and X. J. Meng, J. Mater. Sci. Technol., 2015, 31, 708–722 CrossRef .
- V. Siracusa, P. Rocculi, S. Romani and M. D. Rosa, Trends Food Sci. Technol., 2008, 9, 634–643 CrossRef .
- F. Lefebvre and C. David, Polym. Degrad. Stab., 1994, 45(3), 347–353 CrossRef CAS .
- A. C. Albertsson, R. Renstad, B. Erlandsson, C. Eldsater and S. Karlson, J. Appl. Polym. Sci., 1998, 70(1), 61–74 CrossRef CAS .
- M. Rutkowska, A. Dereszewska and J. H. Jastrzebska, Macromol. Symp., 1998, 130, 199–204 CrossRef CAS .
- K. Kasuya, K. Takagi, S. Ishiwatari, Y. Yoshida and Y. Doi, Polym. Degrad. Stab., 1998, 59, 327–332 CrossRef CAS .
- H. J. Dong, E. Y. Kim, Y. S. Kang and B. K. Kim, Colloids Surf., A, 2010, 370, 58–63 CrossRef .
- S. J. Peng, Y. Jin, X. F. Cheng, T. B. Sun, R. Qi and B. Z. Fan, Prog. Org. Coat., 2015, 86, 1–10 CrossRef CAS .
- K. Burja, U. Segedin, S. Skale, P. Berce, P. Sket, P. Prosen and D. Kukanja, Prog. Org. Coat., 2015, 78, 275–286 CrossRef CAS .
- D. Shaw, Introduction to Colloid and Surface Chemistry, Butterworths, 4th edn, 1970 Search PubMed .
- P. A. Lovell and M. S. El-Aasser, Emulsion polymerization and emulsion polymers, J. Wiley, 1997 Search PubMed .
- L. Lei, L. Zhong, X. Q. Lin, Y. Y. Li and Z. B. Xia, Chem. Eng. J., 2014, 253, 518–525 CrossRef CAS .
- M. Li, F. Liu, Y. Li and X. H. Qiang, RSC Adv., 2017, 7, 13312 RSC .
- A. Santamaria-Echart, A. Arbelaiz, A. Saralegi, B. Fernández-d'Arlas, A. Eceiza and M. A. Corcuera, Colloids Surf., A, 2015, 482, 554–561 CrossRef CAS .
- S. K. Lee and B. K. Kim, J. Colloid Interface Sci., 2009, 336, 208–214 CrossRef CAS PubMed .
- L. K. Saw, B. W. Brooks, K. J. Carpenter and D. V. Keight, J. Colloid Interface Sci., 2003, 257, 163–172 CrossRef CAS PubMed .
- L. H. Bao, Y. J. Lan and S. F. Zhang, J. Polym. Res., 2006, 13, 507–514 CrossRef CAS .
- Z. Fang, H. Duan, Z. Zhang, J. Wang, D. Li, J. Huang, J. Shang and Z. Liu, Appl. Surf. Sci., 2011, 257, 4765–4768 CrossRef CAS .
- V. Garcia-Pacios, Y. Iwata, M. Colera and J. M. Martín-Martínez, Int. J. Adhes. Adhes., 2011, 31, 787–794 CrossRef CAS .
- D. Dieterich, Prog. Org. Coat., 1981, 9, 281–340 CrossRef CAS .
- Z. Ma, Y. Hong, D. M. Nelson, J. E. Pichamuthu, C. E. Leeson and W. R. Wagner, Biomacromolecules, 2011, 12, 3265–3274 CrossRef CAS PubMed .
- T. C. Wen, Y. J. Wang, T. T. Cheng and C. H. Yang, Polymer, 1999, 40, 3979–3988 CrossRef CAS .
- Z. Liang, Emulsion Science and Technology Foundation, Science Press, Beijing, 2001 Search PubMed .
- D. Myers, Surfaces, Interfaces and Colloids, Wiley-VCH, New York, 1990, pp.250–280 Search PubMed .
- B. Bogdanov, V. Toncheva, E. Schacht, L. Finelli, B. Sarti and M. Scandola, Polymer, 1999, 40, 3171–3182 CrossRef CAS .
- S. Mondal and J. L. Hu, J. Membr. Sci., 2006, 276, 16–22 CrossRef CAS .
- S. Mondal and J. L. Hu, Polym. Int., 2006, 55, 1013–1020 CrossRef CAS .
- S. M. Cakić, I. S. Ristić, I. Krakovský, D. T. Stojiljković, P. Bělský and L. Kollová, Mater. Chem. Phys., 2014, 144, 31–40 CrossRef .
- Q. Meng, J. Hu and S. Mondal, J. Membr. Sci., 2008, 319, 102–110 CrossRef CAS .
- J. L. Hu and S. Mondal, Polym. Int., 2005, 54, 764–771 CrossRef CAS .
- L. Lei, Z. B. Xia, C. B. Ou, L. Zhang and L. Zhong, Prog. Org. Coat., 2015, 88, 155–163 CrossRef CAS .
- N. Liu, Y. H. Zhao, M. Q. Kang, J. W. Wang, X. K. Wang, Y. L. Feng, N. Yin and Q. F. Li, Prog. Org. Coat., 2015, 82, 46–56 CrossRef CAS .
- S. Mondal and D. Martin, Polym. Degrad. Stab., 2012, 97(8), 1553–1561 CrossRef CAS .
- M. Alishiri, A. Shojaei, M. J. Abdekhodaie and H. Yeganeh, Mater. Sci. Eng., C, 2014, 42, 763–773 CrossRef CAS PubMed .
- F. Mumtaz, M. Zuber, K. M. Zia, T. Jamil and R. Hussain, Korean J. Chem. Eng., 2013, 30, 2259–2263 CrossRef CAS .
- T. Su, G. Y. Wang, S. L. Wang and C. P. Hu, Eur. Polym. J., 2010, 46(3), 472–483 CrossRef CAS .
- D. E. Packham, Int. J. Adhes. Adhes., 2003, 23, 437–448 CrossRef CAS .
- L. Jiang, Y. L. Chen and C. P. Hu, J. Coat. Technol., 2007, 4(1), 59–66 CrossRef CAS .
- H. Fu, C. Yan, W. Zhou and H. Huang, J. Ind. Eng. Chem., 2014, 20(4), 1623–1632 CrossRef CAS .
- H. Yeganeh, M. Lakouraj and S. Jamshidi, Eur. Polym. J., 2005, 41, 2370–2379 CrossRef CAS .
- A. P. Kishan, T. Wilems, S. Mohiuddin and E. M. Cosgriff-Hernandez, ACS Biomater. Sci. Eng., 2017, 3, 3493–3502 CrossRef CAS .
- Y. Tokiwa, T. Suzuki and K. Takeda, Agric. Biol. Chem., 1998, 52, 1937–1943 Search PubMed .
- K. R. Kamath and K. Park, Adv. Drug Delivery Rev., 1993, 11, 59–84 CrossRef CAS .
|
| This journal is © The Royal Society of Chemistry 2020 |
Click here to see how this site uses Cookies. View our privacy policy here. 
 Open Access Article
 This Open Access Article is licensed under a Creative Commons Attribution-Non Commercial 3.0 Unported Licence
 *
*