 Open Access Article
The effect of surfactants on hydrate particle agglomeration in liquid hydrocarbon continuous systems: a molecular dynamics simulation study†
Bin Fanga,
Fulong Ning *ab,
Sijia Huc,
Dongdong Guoa,
Wenjia Oua,
Cunfang Wangd,
Jiang Wend,
Jiaxin Suna,
Zhichao Liua and
Carolyn A. Koh
 *c
*c
aNational Center for International Research on Deep Earth Drilling and Resource Development, Faculty of Engineering, China University of Geosciences, Wuhan, Hubei 430074, China. E-mail: fangbin126@cug.edu.cn; guodongdong@cug.edu.cn; ouwj@cug.edu.cn; jiaxinsun@cug.edu.cn; liuzhichao@cug.edu.cn; nflzx@cug.edu.cn
bLaboratory for Marine Mineral Resources, Qingdao National Laboratory for Marine Science and Technology, Qingdao 266237, China
cCenter for Hydrate Research, Chemical and Biological Engineering Department, Colorado School of Mines, Golden, Colorado 80401, USA. E-mail: shu@mymail.mines.edu; ckoh@mines.edu
dCNPC Offshore Engineering Company Limited, Beijing, 100028, China. E-mail: wangcf.cpoe@cnpc.com.cn; wenjiang1.cpoe@cnpc.com.cn
First published on 24th August 2020
Abstract
Anti-agglomerants (AAs), both natural and commercial, are currently being considered for gas hydrate risk management of petroleum pipelines in offshore operations. However, the molecular mechanisms of the interaction between the AAs and gas hydrate surfaces and the prevention of hydrate agglomeration remain critical and complex questions that need to be addressed to advance this technology. Here, we use molecular dynamics (MD) simulations to investigate the effect of model surfactant molecules (polynuclear aromatic carboxylic acids) on the agglomeration behaviour of gas hydrate particles and disruption of the capillary liquid bridge between hydrate particles. The results show that the anti-agglomeration pathway can be divided into two processes: the spontaneous adsorption effect of surfactant molecules onto the hydrate surface and the weakening effect of the intensity of the liquid bridge between attracted hydrate particles. The MD simulation results also indicate that the anti-agglomeration effectiveness of surfactants is determined by the intrinsic nature of their molecular functional groups. Additionally, we find that surfactant molecules can affect hydrate growth, which decreases hydrate particle size and correspondingly lower the risk of hydrate agglomeration. This study provides molecular-level insights into the anti-agglomeration mechanism of surfactant molecules, which can aid in the ultimate application of natural or commercial AAs with optimal anti-agglomeration properties.
1. Introduction
Natural gas hydrates (NGHs) are crystalline ice-like solids in which certain natural gas molecules (e.g., methane, ethane, hydrate formers) can stabilize the interconnected polyhedral cages formed by hydrogen-bonded (H-bonded) water molecules.1 Although NGHs are considered a potential future energy resource because of their abundance in permafrost regions and deep oceans,2,3 their formation and agglomeration in offshore petroleum transmission pipelines can cause serious flow assurance problems, resulting in safety issues, environmental concerns and significant economic losses4 in the oil and gas industry. Gas hydrate inhibitors have been widely used to mitigate hydrate plugging risks and lower the operating costs. Traditionally, thermodynamic hydrate inhibitors (THIs), such as methanol and ethylene glycol, are added to shift the hydrate equilibrium boundary to lower temperatures and higher pressures.5–7 However, this method may present both economic and environmental concerns because high doses of THIs are often required (typically 30–40 vol%).8 The utilization of low-dose hydrate inhibitors (LDHIs) is an alternative approach. There are two subcategories of LDHIs, kinetic hydrate inhibitors (KHIs) and anti-agglomerants (AAs), which can be used to manage hydrate plugs via different mechanisms at much lower doses (typical dose of 0.5–2 vol%) than used for THIs.1 The KHIs can delay hydrate nucleation and usually adsorb strongly onto the hydrate surface and retard crystal growth.1 However, KHIs may be ineffective in deep water operations due to the high subcooling conditions for hydrate formation. In contrast, AAs can prevent the agglomeration of small hydrate crystallites in pipeline fluids; therefore, hydrates are transported as a flowable slurry, which can be effective for higher subcooling and over prolonged pipeline shut-in periods. Therefore, AAs are becoming increasingly popular agents for hydrate risk management of oil and/or gas industry operations.9 It should be noted that there are natural (as well as commercial) AAs, i.e., some oils contain naturally occurring surfactants that can prevent hydrate particles from agglomerating, such as surfactants in asphaltene or acid fractions of the oil.10,11 The polyaromatic carboxylic acid surfactant molecules used in this study could be considered model molecules for these natural surfactants,12,13 although it should be noted that the complexity of natural oils make it difficult to isolate the molecular structure of the active components.Understanding the intrinsic mechanism of surfactant anti-agglomeration is of great importance for advancing hydrate risk management strategies. Generally, AAs (both natural and commercial) are surfactants with a hydrophilic head and a hydrophobic tail that can adsorb onto the hydrate particle surface, thereby changing the hydrate surface morphology, wettability and interactions to prevent hydrates from agglomerating and forming large plugs.14–21 In addition, some reports have shown that AAs could also potentially affect hydrate formation and growth processes.22–25 To evaluate the effectiveness of AAs, one frequently used method is to measure model (cyclopentane, CyC5) hydrate interparticle cohesive forces in the presence of AAs using an ambient pressure micromechanical force (MMF) apparatus,26 because the capillary liquid bridge between hydrate particles was proposed to be another essential feature dominating hydrate particle cohesion in oil continuous systems.27–29 Interestingly, one crucial result of MMF studies of surfactants indicated that polynuclear aromatic carboxylic acids can be highly effective in reducing hydrate cohesion forces by up to 87 ± 9% for a four-ring conjugated hydrophobic group,16,30 thereby subsequently preventing hydrate particles from agglomerating. In practical applications, this finding indicates that the acid fraction in crude oil plays a role in naturally dispersing hydrate particles,10,31 similar to the function of these LDHI–AAs in terms of reducing the force between hydrate particles. Thus, these surfactants (acid molecules) are considered a new potential type of AA molecule, as the usually commercial AAs tend to be based on quaternary ammonium salts.1,6,15 This observation was explained by the activity of carboxylic acid molecules, which could change the wettability of the hydrate surface from hydrophilic to lipophilic, leading to a reduction in hydrate agglomeration;16 however, this explanation lacks theoretical support at the molecular level. The previous experiment yielded another interesting result: the anti-agglomeration effectiveness of the carboxylic acid surfactants increases with the number of polynuclear aromatic rings even if these surfactants are homologues.30 Therefore, an understanding of the molecular intrinsic characteristic (especially molecular functional groups) on anti-agglomeration properties is necessary and important for the development of a new potential category of LDHI–AAs with optimal properties, as well as new insight into the role natural surfactant (acids) can play in hydrate anti-agglomeration.
Previous simulation reports indicated that the adsorption of AA surfactant molecules on the hydrate/liquid interface is one of the most important anti-agglomeration mechanisms.25,32,33 However, few works discuss if this adsorption of AA molecules can also affect the cohesion force of the capillary water bridge between attracted hydrate particles at the molecular level, which is regarded as the primary reason for hydrate particle agglomeration.34,35 In this paper, we built a molecular adsorption model and capillary water bridge model at the molecular level to reveal the intrinsic mechanism of model AA surfactant performance. In addition, the effect of molecular structure and characteristics on anti-agglomeration of this type of surfactant are also discussed.
2. Method and models
2.1 Simulation tool and system definition
To identify and quantify the surfactant mechanism at the molecular level, we report single surfactant molecule adsorption onto a hydrate seed and the interaction of the surfactant molecule with the capillary liquid bridge using a classical molecular dynamics (MD) simulation, which has been widely and successfully used in previous investigations of hydrates, including AAs.15,17,21,24,36 In this paper, we used the general Amber force field37 to describe three different surfactant molecules: (1) 1-phenylacetic acid, (2) 2-napthylacetic acid and (3) 1-pyreneacetic acid. Using this approach, atom types of each surfactant were taken from the AMBER library. Moreover, the RESP charges were calculated for the atomic charges of the AMBER forcefield at the HF/6-31G(d) level, and the RESP atomic charges of the three surfactants were obtained at the same level.37 In addition, the water molecules in our simulations were described by the TIP4P/2005 water model,38 which has been demonstrated to accurately reproduce hydrate properties using MD simulations.39,40 For methane, propane and decane, OPLS all-atom potentials were used.41Temperature coupling was implemented using velocity rescaling with a stochastic term,42 and Parrinello–Rahman extended-ensemble pressure control was utilized to rescale the simulation box vectors.43 The thermostat and barostat constants were 0.2 and 2.0 ps, respectively. The particle-mesh Ewald (PME) summation method44 was used to handle the long electrostatic interactions calculation. The van der Waals interactions between atoms were described by the Lennard-Jones potential, and the cut-off distance was 10 Å, which should be less than half the length of the simulation box. The leap-frog algorithm was used to integrate Newton's motion equation with a 2 fs time step.45 Periodic boundary conditions were taken into account in three directions.
2.2 Surface adsorption model
For the simulated system, three initial configurations of surfactant adsorption have been constructed.15 Initially, we selected the structure II (sII) hydrate polymorph, which is one of the three typical structures of NGHs and the predominant structure formed in oil and gas transmission pipelines. For the sII hydrate, the polyhedral cages formed by hydrogen-bonded water were occupied by methane (in small pentagonal dodecahedron cages) and propane (in large hexacaidecahedral cages) guest molecules in our simulations.39 The lattice parameters and all the coordinates of atoms in the sII unit cell were taken from Takeuchi's work,46 and a 3 × 3 × 3 supercell of the sII crystal was built. The (111) face of the sII hydrate has been confirmed to have the slowest growth rate47 and to usually be well developed; therefore, the (111) face is considered the most relevant crystal surface for the study of surfactant molecule adsorption. The crystal structure was extracted from the methane–propane binary sII crystal supercell, leading to exposure of the (111) face in the z-direction. The intersected unit cell has periodic dimensions of 12.23 × 7.06 × 10.00 Å with orthogonal lattice vectors oriented along the directions of the original unit cell [11![[2 with combining macron]](https://www.rsc.org/images/entities/char_0032_0304.gif) ], [
], [![[1 with combining macron]](https://www.rsc.org/images/entities/char_0031_0304.gif) 10] and [111], and the simulated hydrate phase consists of 4 × 3 × 4 repetitive cubic cells. After the hydrate crystals with the (111) surface were created, we extended the simulation box in the z-direction, resulting in a width of 80 Å of unfilled space.
10] and [111], and the simulated hydrate phase consists of 4 × 3 × 4 repetitive cubic cells. After the hydrate crystals with the (111) surface were created, we extended the simulation box in the z-direction, resulting in a width of 80 Å of unfilled space.
Subsequently, we placed a surfactant molecule on the surface of the hydrate phase in the z-direction, and the unfilled space was filled by the hydrocarbon phase (decane molecule). During the equilibration simulation stage, the hydrate phase near the interface dissociated due to the mismatch of the two phases, leading to diffusion of the methane and propane molecules near the hydrate/hydrocarbon phase interface into the hydrocarbon phase. This diffusion behaviour leads to the same fugacity for guest molecules in the hydrate and hydrocarbon phases and ensures the systems reach an equilibrium state during this simulation stage. Therefore, the liquid hydrocarbon phase adopted in the initial configurations consisted of only decane molecules at first, and methane and propane molecules were dissolved after the equilibration simulations. The final configurations of the surface adsorption model, including the hydrate phase, liquid hydrocarbon and one surfactant molecule, resulted in 147 methane molecules, 83 propane molecules, 227 decane molecules, 1236 water molecules and 1 surfactant molecule in the initial simulation systems, with periodic dimensions of 49 Å × 21.5 Å × 125 Å.
To rapidly equilibrate the system under a certain temperature–pressure condition before the MD simulation, a 200 ps single annealing simulation was implemented to optimize the initial systems (including clathrate hydrate phase, hydrocarbon phase and surfactant molecule) by heating the systems from 236 K to 276 K in increments of 2 K at a pressure of 10 MPa, rapidly leading to systems with a reasonable volume and temperature. Following the annealing simulation, 100 ns simulations were performed in the NPT ensemble to equilibrate the system (10 MPa and 276 K). During this stage, the hydrate decomposed, and a number of guest molecules, including methane and propane, were released from the broken hydrate cages and diffused into the liquid hydrocarbon phase. Finally, the simulation system reached equilibrium, and the last snapshot was used as the initial simulation configuration to calculate the binding energy and binding free energy. These two parameters can be used to characterize surface adsorption.
| ΔE = [〈EAA,HS,LP〉 − 〈EHS,LP〉] − [〈EAA,LP〉 − 〈ELP〉] | (1) |
As shown in the above equation, energies of the four systems derived from the adsorption model are necessary: (1) the system described in the surface adsorption model consists of the AA surfactant molecule, hydrate phase and liquid hydrocarbon (defined as AA, HS, and LP); (2) the system consists of the hydrate phase, liquid hydrocarbon (defined as HS and LP); (3) the system of the AA surfactant solvated in the bulk hydrocarbon phase (defined as AA and LP); and (4) the system including only the bulk hydrocarbon phase (defined as LP). EAA,HS,LP, EHS,LP, EAA,LP and ELP represent the energy of the four systems, and 〈〉 represents an ensemble-average. [〈EAA,HS,LP〉 − 〈EHS,LP〉] and [〈EAA,LP〉 − 〈ELP〉] represent the average energy change when surfactant is adsorbed on the hydrate phase surface site and the average energy change when surfactant is introduced into the liquid hydrocarbon phase, respectively. The binding energy is equal to the energy difference (as shown in eqn (1)) between these two quantities because the difference represents the change in system energy when the surfactant molecule is bound to the hydrate/hydrocarbon phase interface versus being introduced into the hydrocarbon phase. This approach for binding energy calculations (eqn (1)) can adequately sample the unbound state and is not dependent on the unbound state definition;15 therefore, the reference states EHS,LP, EAA,LP, and ELP utilized in this work could improve the accuracy of the binding energy calculation. The reference systems (HS, LP), (AA, LP), and (LP) are all independent simulations, and the ensemble-averaged energies 〈EHS,LP〉, 〈EAA,LP〉, and 〈ELP〉 correspond to the three systems. All simulation parameters were used as mentioned above, and the ensemble-averaged energies 〈E〉 were calculated over 100 ns production simulations after a 100 ns equilibration simulation for each system at a pressure of 10 MPa and a temperature of 276 K.
2.3 The capillary liquid bridge model
For the capillary water bridge model, three initial configurations were constructed for the three surfactants. The same (111) face of the hydrate was selected to connect the capillary bridge water, and each hydrate particle consisted of 4 × 6 × 4 rectangular unit cells separated by 40 Å. Subsequently, we added 2422 water molecules to the middle layer as a liquid water bridge with a hydrocarbon phase on both sides. The hydrocarbon phase consisted of 122 decane molecules and 60 surfactant molecules, and the final configuration had dimensions of 84.8 Å × 48.9 Å × 76.9 Å. Here, in theory, 60 1-pyreneacetic acid molecules could almost fully occupy the water/oil interface on two sides on the basis of the molecular area. Additionally, we constructed a simulation system without surfactants for comparative purposes. The simulation process was the same with that of the capillary water bridge model, the only difference is that the 60 surfactant molecules were replaced by decane molecules. A 50 ns NVT ensemble was performed with a 20 ns equilibration simulation, and the cut-off distance of van der Waals interactions for the Lennard-Jones potential was changed to 12 Å.2.4 Quantum chemical calculations
The structures of the three model surfactants were optimized at the B3LYP/6-311G level in water using the integral equation formalism polarizable continuum model (IEFPCM),50 and then the total energy of the three acids with or without water molecules was calculated. Under the same conditions, for the three acid molecules, a relaxed total energy surface scan was performed involving an O![[double bond, length as m-dash]](https://www.rsc.org/images/entities/char_e001.gif) COH dihedral angle from 0° to 180° in increments of 3°. The van der Waals surface of a molecule is defined as the electron density 0.001 e Bohr−3 contour,51 a property directly related to the van der Waals radius.
COH dihedral angle from 0° to 180° in increments of 3°. The van der Waals surface of a molecule is defined as the electron density 0.001 e Bohr−3 contour,51 a property directly related to the van der Waals radius.
3. Results and discussion
3.1 Surfactant adsorption on hydrate particle surface
Our choice of surfactants is polynuclear aromatic carboxylic acids, including 1-phenylacetic acid, 2-napthylacetic acid and 1-pyreneacetic acid, which were suggested to have anti-agglomeration behaviour according to previous experimental work.30 Each surfactant has one hydrophilic head group (carboxyl) and one large hydrophobic tail group (aromatic ring) (Fig. 1). The surfactants those show good performance have a four-ring conjugated hydrophobic group; those with poor performance have only one ring group, according to the experimental results.30 In our simulations, we start by focusing on surfactant molecule surface adsorption at the oil–hydrate interface by quantifying the evolution of the adsorption process in the system using binding free energy and binding energy calculations. We proposed another configuration to monitor the interaction between surfactant and water molecules within the capillary liquid bridge. The sII hydrate adopted in our simulation is the predominant structure occurring in oil and gas pipelines.39 Fig. 2d shows a schematic of the simulated system. In order to calculate the binding free energy and binding energy, the quasi-liquid phase in Fig. 2d is well equilibrated according to the rotational correlation function and the intermediate scattering function calculations (details calculations are described in the ESI†).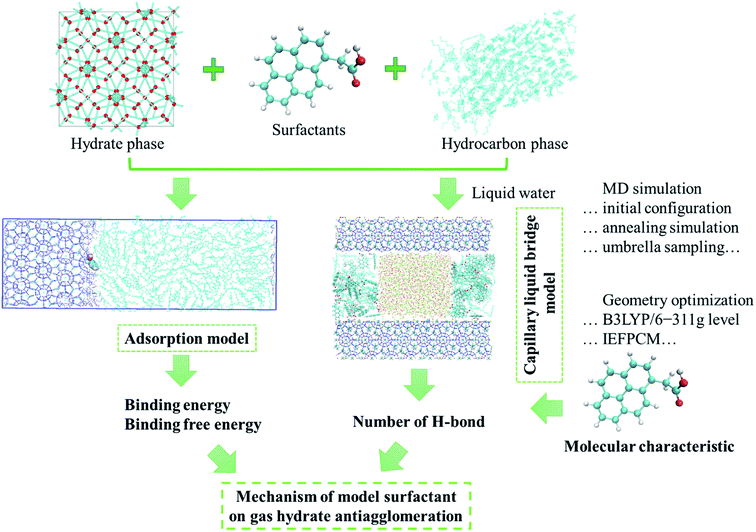 | ||
| Fig. 1 Main stages of the MD simulation to investigate the effect of surfactants on gas hydrate anti-agglomeration. | ||
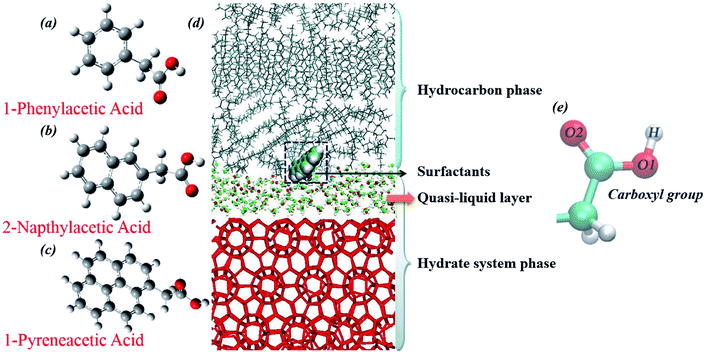 | ||
| Fig. 2 Molecular structures of the three model surfactants: (a) 1-phenylacetic acid, (b) 2-napthylacetic acid, (c) 1-pyreneacetic acid, and (d) the simulation configuration for the surfactant surface adsorption model after 100 ns equilibration simulation (methane and propane molecules are not shown in the figure). Methane–propane binary sII hydrates are used in the system; the hydrocarbon phase is composed of methane, propane and decane (liquid hydrocarbon phase) molecules. During the equilibration process, the cage structure on the hydrate surface collapsed, leading to the presence of guest molecules (methane and propane) in the hydrocarbon phases, as well as the quasi-liquid layer (QLL) at the hydrate surface, and the QLL was also shown in previous simulations.15,25 In addition, carboxylic oxygen (O1 and O2) and hydrogen (H) atoms are labelled (e). | ||
The binding free energy (ΔG) could provide surface adsorption process information about the surfactant on the hydrate surface. One-dimensional potential mean force (PMF) curves were computed for the adsorption process of each model AA surfactant (Fig. 3) using the umbrella sampling technique48 with the weighted histogram analysis method49 at 10 MPa and 276 K, yielding the ΔG of binding to the sII hydrate (111) surface, and the values of ΔG are shown in Table 1. The negative free energies for the three surfactants demonstrate that the processes of carboxylic acid molecules binding to the hydrate–oil interface from the hydrocarbon phase are spontaneous, leading to a high concentration of surfactant binding and occupying the hydrate/liquid hydrocarbon interface. Due to the lipophilicity of the hydrophobic aromatic ring, surfactants can effectively prevent hydrate agglomeration. Furthermore, there is a noticeable trend of the magnitude of the binding free energy for each surfactant molecule in Table 1. The quantitative calculation of the free binding energy implies an increased adsorption and a higher attraction favourability of the 1-pyreneacetic acid to the hydrate/liquid hydrocarbon interface in oil continuous systems compared to the other two acids.
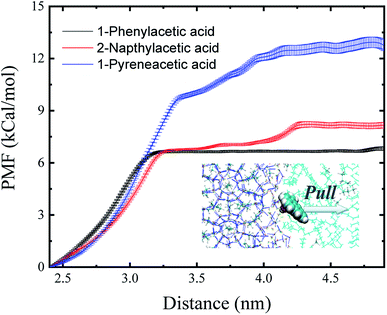 | ||
| Fig. 3 Potential mean force (PMF) profiles obtained for the three surfactants as they travel from the sII hydrate (111) surface to the liquid hydrocarbon phase. Error bars were estimated from bootstrap analysis implemented in GROMACS.52 | ||
| Surfactants | Binding free energy (kcal mol−1) | Binding energy (kcal mol−1) |
|---|---|---|
| 1-Phenylacetic acid | −6.68 ± 0.06 | −17.52 ± 3.04 |
| 2-Napthylacetic acid | −8.17 ± 0.16 | −32.07 ± 2.38 |
| 1-Pyreneacetic acid | −12.86 ± 0.31 | −67.64 ± 3.73 |
The binding energy (ΔE) is the minimum energy required to separate particles (binding affinity) and can be used to indicate the strength of the connection between different components. The binding energies shown in Table 1 demonstrate that the surface adsorption for a surfactant from the liquid hydrocarbon phase to the hydrate surface is an exergonic process. All the binding energy values of the three acids are relatively high,15 especially that of 1-pyreneacetic acid (ΔE = −67.64 kcal mol−1; considering large fluctuations of systems with the large 1-pyreneacetic acid molecule, the ensemble-averaged energies were calculated over 100 ns production simulations after a 200 ns equilibration simulation for the corresponding four systems), which suggests that the binding is energetically favourable. The remarkable trend of binding energy for the three surfactants presented in Table 1 is similar to that of the binding free energy, which shows that the adsorption of 1-pyreneacetic acid to the hydrate surface by intermolecular interactions (mainly H-bond effects) is the most stable process, and compared to those of the other two surfactants, such a strong binding affinity also indicates increased surface adsorption of the 1-pyreneacetic acid in the liquid hydrocarbon phase.
3.2 Interactions between the surfactants and liquid water bridge
Our analysis of surfactant surface adsorption is in agreement with the binding models developed for the AA mechanism in previous experimental studies.15,53 Although the surfactant molecules were scattered in the oil continuous system in pipelines with low concentrations, surfactants could accumulate around the forming hydrate particles. The hydrophilic head group (carboxyl) of the surfactant bound to the hydrate surface, and the hydrophobic group (aromatic benzene ring) of the surfactant formed a barrier/film (steric hindrance) that could effectively decrease the amount of water (water bridge) between two contacted hydrate particles, thereby reducing hydrate particle agglomeration. Generally, surfactant's efficiency is related to not only its adsorption firmness, hydrophobic force and hydrophile lipophilic balance, but also geometric properties of surfactants. If just considering the differences in the geometric properties among the three surfactants, 1-pyreneacetic acid may not be as efficient as suggested by the experimental results (1-pyreneacetic acid can significantly decrease the cohesion force between hydrate particles by up to 87 ± 9%, while the effectiveness of 2-napthylacetic acid was only slightly better than that of 1-phenylacetic acid)30 because the molecular area of 1-pyreneacetic acid was only 24.0% larger than that of 2-napthylacetic acid, and the molecular area of 2-napthylacetic acid was 26.5% larger than that of 1-phenylacetic acid; the difference in molecular area is not as large as the discrepancy in the observed cohesion force reduction measured for the corresponding surfactants (Table 2).| Surfactant | Area (Å2) | Volume (Å3) |
|---|---|---|
| 1-Phenylacetic acid | 178.27 | 176.58 |
| 2-Napthylacetic acid | 225.51 | 236.33 |
| 1-Pyreneacetic acid | 279.70 | 315.42 |
Although the concentration of surfactants in the liquid hydrocarbon phase was low, a large number of surfactants molecules accumulated at the hydrate crystallite surface due to the adsorption process. In addition, in all simulations, it was observed that a thin quasi-liquid water film (thickness of 4–7 Å) formed near the interface of the hydrate/hydrocarbon phase in the liquid hydrocarbon system (Fig. 2d).15 Previous work suggested that this quasi-liquid layer at the hydrate surface and free water can lead to hydrate particle agglomeration through the formation of capillary liquid bridges between hydrate particles.20,54 The existence of capillary liquid bridges between hydrate particles is considered an essential mechanism for hydrate cohesion in oil continuous systems.26
Fig. 4 shows a capillary liquid bridge model generated using MD simulations. This model was applied to study the intrinsic interactions between surfactants and H-bond networks those form in liquid bridges. Three similar initial configurations were built (as described in Section 2.3). In the following MD simulations, hydrate crystals were used to mimic hydrate particles in the liquid bridge model. To stabilize the configuration and decrease the interactions between gas hydrate particles and surfactants, all molecules within the hydrate crystal were frozen, including the guest molecules. Water molecules can form a H-bond with both the carboxyl oxygens and hydrogen of model surfactants. We define the H-bond between donor and acceptor as follows: the distance between donor oxygen and acceptor hydrogen is <2.45 Å, and the angle of ∠H–O⋯O is <30°.55–57 We categorize the configuration into three different groups (O1, O2 and H are shown in Fig. 1): (1) carboxylic O1 H-bonded with water molecules (O1-WH), (2) carboxylic O2 H-bonded with water molecules (O2-WH), and (3) carboxylic H H-bonded with water molecules (H-WO).
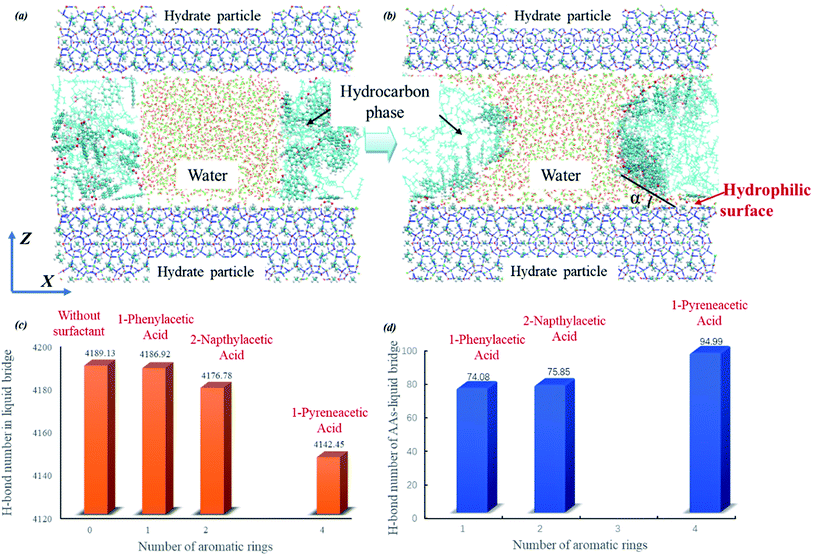 | ||
| Fig. 4 Initial (a) and final (b) snapshots of the capillary liquid bridge model at the molecular level taken for the system with 1-pyreneacetic acid as an example (1-phenylacetic acid and 2-napthylacetic acid systems are shown in Fig. S6†). The simulation cell is composed of three layers, with bridge water molecules in the middle of the hydrocarbon phase between the hydrate slabs at the top and bottom (in blue), and the hydrocarbon phase in the middle layer is composed of decane molecules with surfactants dispersed within it. The average number of H-bonds in the capillary bridge water molecules (c); the average number of H-bonds between surfactant molecules and bridge water molecules (d). | ||
The simulations were performed with a limited number of capillary liquid bridge water molecules, which form a hyperbola shape between two hydrate particle hydrophilic surfaces separated by 40 Å; additionally, the number of surfactants molecules in the liquid bridge model was determined by this hyperbola shape surface area. During the simulations, surfactant molecules gradually moved closer to the hydrate particles and eventually bound to the water–oil interface (Fig. 4b). We clearly observed that the average number of H-bonds in the water liquid bridge tended to decrease with increasing number of aromatic rings of the surfactant (shown in Fig. 4c). This phenomenon is caused by the increase in interactions between the hydrophilic group of surfactant and water molecules (Fig. 4d, it shows the average number of H-bonds in which the donor/acceptor is from the surfactant molecule). The cohesion force between two hydrate particles is determined by the capillary liquid bridge,19,31,58 while at the molecular level, the cohesion force is mainly attributed to the intensity of the H-bond network in the capillary liquid bridge. As shown in Fig. 4c and d, the surfactants can destabilize the capillary liquid bridge by the binding of the hydrophilic group on the surfactant to the liquid bridge, thus allowing for more H-bonds to form between the water molecules in the liquid bridge and the surfactants. This behaviour further disrupts the H-bond network, decreasing the number of H-bonds in the water liquid bridge, thereby weakening the cohesion force of two hydrate particles and eventually preventing agglomeration under the action of the produced fluid. It is noted that 1-pyreneacetic acid can form over 25% more H-bonds with water molecules in the bridge than the other two acids according to our statistical data (Fig. 4d), therefore, the anti-aggregation effectiveness of 1-pyreneacetic acid is more outstanding. In addition, the presence of surfactant molecules at the oil/water interface could also change the interface tension. And the interface tension and system pressure are different for the three surfactants. In our simulations, the both factors could have some relationship with the H-bond network intensity but the effects are not obvious (detail results are shown in ESI†).
From Fig. 4c, it can be found that the reduction in the average H-bond number from 4186.92 to 4142.45 seems a little small (about 1.1% of the total number). This result mainly attributes to the simulation setting in which the surfactant number in the three simulation systems is the same and keep at a small set value during our simulations. However, in actual system, more surfactant molecules could interact with water molecules in liquid bridge compared to those in the MD simulation systems due to the favourable adsorption effect of the surfactants discussed above. With the increasing surfactants number, the bridge weakening effect from surfactant molecules could be enhanced.
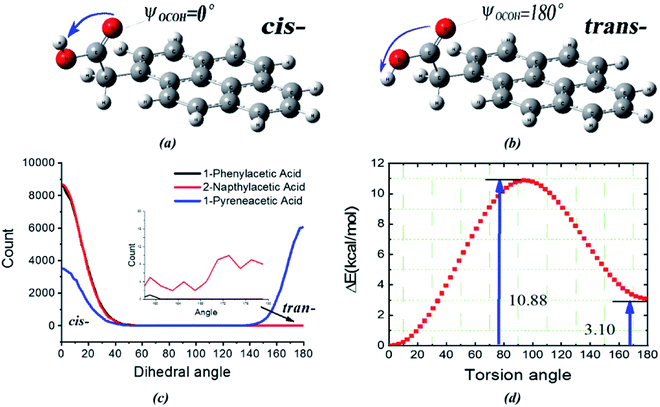
The next question is why do the three surfactants show different interactions with the liquid bridge water even though their hydrophilic groups are all comprised of carboxyl groups? To better investigate the difference in the H-bond interaction, we placed eight acid molecules (surfactant molecules) labelled no. 1–8 into liquid water and performed 20 ns MD simulations at 276 K and 0.1 MPa (details regarding simulation models and algorithms are described in the ESI†). Two conformers (cis/trans-COOH59 shown in Fig. 5) are found in the 1-pyreneacetic acid/water phase system by the dihedral carboxyl group torsion but rarely found in the other two surfactant systems (Fig. 5c). The internal rotational degrees of freedom of 1-pyreneacetic acid led to two low-energy conformers. We optimized the structure and computed the total energy of 1-pyreneacetic acid with a carboxyl COOH dihedral acid angle ranging from 0° to 180° and an angle interval of 3° at the B3LYP/6-311g level (Fig. 5d) in the water phase using the integral equation formalism variant (IEFPCM).50 It was known that both cis-COOH and trans-COOH belong to the ensemble of possible conformations,59 but analysis of the energies revealed that the cis-carboxyl was intrinsically more favourable than the trans-carboxyl by approximately 3.1 kcal mol−1, with a barrier of 10.9 kcal mol−1 (Fig. 5d). Besides, the energies of the other two acids corresponding to the torsion angle were also scanned using the same method, and the results present the same tendency as observed for 1-pyreneacetic acid but with higher energy barriers (Fig. S10†). The energy barriers seem closely correlated with the intramolecular proton transfer between cis-COOH and trans-COOH.
Furthermore, we estimated the carboxyl proton transfer tunneling probability by the transition state theory at room temperature.60,61
 | (2) |
| ν (cm−1) | ΔG (kcal mol−1) | G | |
|---|---|---|---|
| 1-Phenylacetic acid | 589.43 | 10.296 | 0.35 |
| 2-Napthylacetic acid | 584.80 | 8.580 | 0.35 |
| 1-Pyreneacetic acid | 560.26 | 10.012 | 0.37 |
It is shown obviously that the intramolecular proton transfer tunneling probability of 1-pyreneacetic acid is large than those of two other molecules. However, the difference of tunneling probability is not significant among the three surfactants. We think there are two reasons, one is that the temperature used in the transfer probability calculation is higher than that in our MD simulation, and the other is that the calculation is only based on the molecular itself and we have not taken the effects (intermolecular H-bond) from water molecules into consideration.
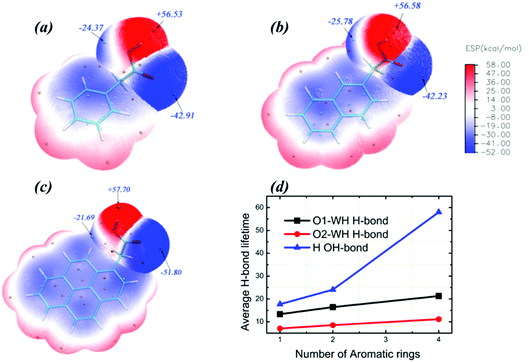
In addition to the nature of the surfactants themselves, it is evident that intermolecular H-bonds play a vital role in determining the conformational energies. Carboxylic oxygen or hydrogen atoms of surfactants can form intermolecular H-bonds with the oxygen or hydrogen atoms of water molecules. As a result, the cis-COOH and trans-COOH conformations may coexist simultaneously in the aqueous solution. We analysed the molecular surface by electrostatic potential maps (EPMs) for which polar molecules reveal well sites those are most electron-rich and most electron-poor. The molecular EPM of polar molecules generally performed well in predicting the possibility of charge–dipole, dipole–dipole, and quadrupole–dipole interactions.62 As seen from Fig. 6, the quantified electrostatic potential surface determined using quantum chemistry calculations suggests that the polar hydrogen/oxygen in surfactant molecules can be involved in hydrogen bonding. The molecular polarity was generally enhanced by increasing the number of aromatic rings, which may be induced by the resonance of two π-delocalized bonds in the surfactant molecule. This implies that H-bonds formed by carboxylic oxygen/hydrogen and water molecules for surfactants with more aromatic rings become more stabilized than those of surfactants with fewer aromatic rings. This finding is also verified by the H-bond lifetime calculated by correlation function (Fig. 6d).63 H-Bonds with a donor or acceptor provided by 1-pyreneacetic acid have the longest lifetime in comparison with those formed at the same site using the other two surfactants. The intrinsic structural preferences of 1-pyreneacetic acid are relatively easy to alter in aqueous solution due to intrinsic properties and the interaction energy caused by the intermolecular H-bond effects.
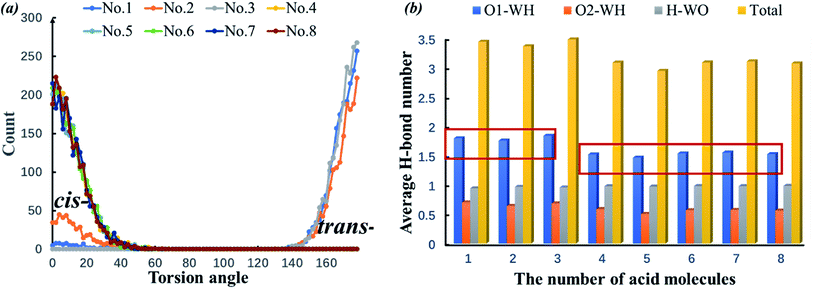
cis-COOH and trans-COOH are two conformations of polynuclear aromatic carboxylic acid mixtures with water molecules. Although the conformation energy is relatively high, the proportion of the trans-COOH conformation increases due to the H-bond effect. In the 1-pyreneacetic acid/water system, this torsion in turn impacts the number of H-bonds formed by carboxylic oxygen or hydrogen. Fig. 7a shows the number of 1-pyreneacetic configurations corresponding to the COOH torsion angle. It shows that molecules 1–3 have trans-COOH conformation preferences, and molecules 4–8 have cis-COOH conformation preferences. Fig. 7b provides the number of H-bonds formed by each acid molecule and water molecule. Compared with the cis-COOH conformation, the trans-COOH conformation can facilitate the formation of H-bonds (the number of O1-OW H-bonds significantly increases), which may contribute to decreasing steric hindrance of the carboxylic oxygen atom and increase the probability of the donor and acceptor of intermolecular H-bond interactions. Thus, we studied the interactions between each of the three polynuclear aromatic carboxylic acids and the liquid water molecules by first changing the conformation preferences and then facilitating H-bond formation.
3.3 Effects of surfactants on the growth rate of hydrate
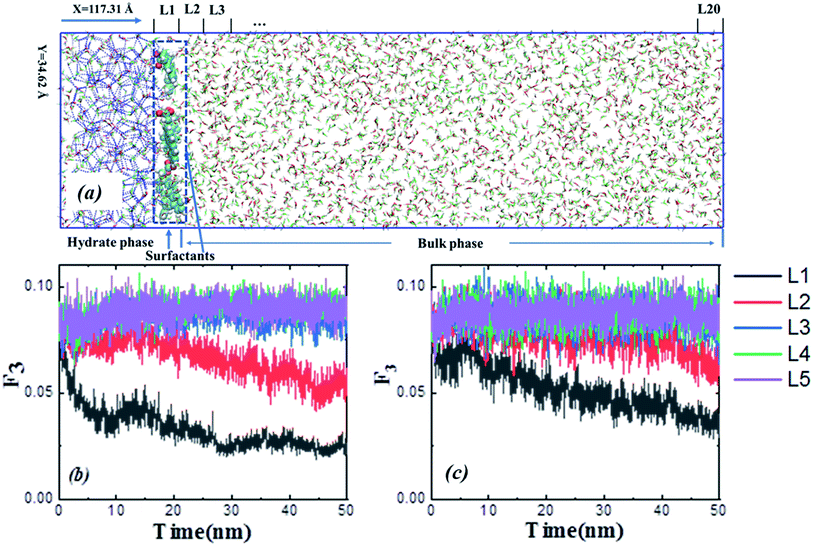
Surface adsorption can also occur in KHIs those inhibit the formation and growth kinetics behaviours of hydrate crystals.23,64 Based on previous studies, some AAs exhibit the same kinetic effects in the petroleum industry.17,25 Therefore, additional simulations and experiments were performed to investigate whether the adsorption of the model surfactants could affect gas hydrate growth, and the initial simulation configuration is shown in Fig. 8.The system can be divided into two parts along the x-direction: the left part is the sII methane–propane binary hydrate crystal, which generates 1 × 2 × 2 unit cells from sII unit cell data.46 This crystal is used to induce the growth of hydrate; the right part is the bulk phase, which is mixed with water, methane and propane molecules at a molecular ratio of 17![[thin space (1/6-em)]](https://www.rsc.org/images/entities/char_2009.gif) :
:![[thin space (1/6-em)]](https://www.rsc.org/images/entities/char_2009.gif) 2
2![[thin space (1/6-em)]](https://www.rsc.org/images/entities/char_2009.gif) :
:![[thin space (1/6-em)]](https://www.rsc.org/images/entities/char_2009.gif) 1, which agrees with the methane–propane binary hydrate. The bulk phase was equally divided into twenty layers perpendicular to the x-direction in the figure, named L1 to L20. The configuration consists of six 1-pyreneacetic acid molecules placed onto the hydrate crystal surface, and the configuration of the hydrate growth systems had dimensions of 117.31 Å × 34.62 Å × 34.62 Å and consisted of 6 surfactants, 434 methane molecules, 221 propane molecules, and 3687 water molecules.
1, which agrees with the methane–propane binary hydrate. The bulk phase was equally divided into twenty layers perpendicular to the x-direction in the figure, named L1 to L20. The configuration consists of six 1-pyreneacetic acid molecules placed onto the hydrate crystal surface, and the configuration of the hydrate growth systems had dimensions of 117.31 Å × 34.62 Å × 34.62 Å and consisted of 6 surfactants, 434 methane molecules, 221 propane molecules, and 3687 water molecules.
To compare the effect of surfactants (with AA properties) on the growth (fast or slow) of hydrate crystals, we removed the surfactant molecules in the growth system and simulated the growth without surfactants as a reference. All the other simulation details are similar to the above system. A 50 ns NPT ensemble was performed, and the temperature and pressure were kept at 260 K and 10 MPa, respectively. In addition, the MD simulation procedures were as described above. The F3 order parameter developed by Baez and Clancy65 was used to describe the local states of the water molecules, which can be used to distinguish the water molecules in simulation systems belonging to the hydrate phase or aqueous phase during the hydrate growth processes.
 | (3) |
In addition, hydrate formation experiments also confirmed that surfactants with AA properties (napthylacetic acid) could delay hydrate growth in an oil system with 20 vol% water (the materials, experimental procedure and results are reported in the ESI†). The existence of surfactants could delay hydrate growth, leading to the hydrate particle in a relatively small size. This effect would contribute to preventing hydrate particle agglomeration in pipeline because of the reduction of force between particles.66
Both the simulation and experiment show that polynuclear aromatic carboxylic acids (as model surfactants) may have some commonalities with KHIs in the mechanism of hydrate inhibition behaviour, and this phenomenon may be attributed to the mass transfer limit in the oil and gas system induced by surface adsorption.67,68 Therefore, this class of surfactants could be considered kinetic hydrate inhibitor-like AAs (KHI-like AAs).
4. Conclusions
In conclusion, we employed MD simulations to elucidate the essential origin of the cohesion force reduction at the molecular level for polynuclear aromatic carboxylic acids as model AAs, which was observed (on the mesoscale) from previous experiments to reduce the hydrate cohesion forces in liquid cyclopentane. The results demonstrate that the model surfactant molecules with AA properties can play a role to prevent hydrate particle aggregation in two processes. The first is the known adsorption effect where the surfactant molecules can approach and bind to the hydrate surface from the hydrocarbon phase when the hydrate crystal nucleus forms. The second is the weakening of the capillary liquid bridges formed between hydrate particles by the model AAs, which interact with water molecules in these bridges by H-bonding, thus, disrupting the internal H-bond network. The simulation results also indicate that 1-pyreneacetic acid is the most beneficial for adsorption process and can change the intrinsic structural preferences due to the solvent effect in the aqueous solution, in turn, the induced conformation can enhance the H-bond interaction between the carboxylic acids and the water liquid bridge. Therefore, 1-pyreneacetic acid shows better AA performance than the other two acids, which is in agreement with the experimental measurements.Finally, we find that surfactants with AA properties can delay hydrate growth, which could contribute to the dispersion of hydrate particles. This phenomenon that AAs affect the hydrate growth is similar to that of a kinetic hydrate inhibitor. Therefore, this type of AA could be considered a KHI-like AA. Future studies may aim to summarize the universality and individuality among different classes of AAs and discover or synthesize environmentally friendly KHI-like AAs across a range of water vol%.
Conflicts of interest
The authors declare that they have no conflict of interest.Acknowledgements
This work was supported by The National Key Research and Development Program of China (2017YFC0307600, 2018YFE0126400), the National Natural Science Foundation of China (41672367), Department of Natural Resources of Guangdong Province Project (GDNRC[2020]-047), the China Geological Survey Project (DD20190232), the Qingdao National Laboratory for Marine Science and Technology Open Fund (QNLM2016ORP0203), and the National High-Level Talent Special Support Plan. Thank you to Y. Liu and A. Schide (CHR) for proof-reading and providing comments on this document.References
- E. D. Sloan and C. A. Koh, Clathrate Hydrates of Natural Gases, CRC Press, 2007 Search PubMed.
- L. J. Florusse, C. J. Peters, J. Schoonman, K. C. Hester, C. A. Koh, S. F. Dec, K. N. Marsh and E. D. Sloan, Science, 2004, 306, 469–471 CrossRef CAS PubMed.
- X. S. Li, C. G. Xu, Y. Zhang, X. K. Ruan, G. Li and Y. Wang, Appl. Energy, 2016, 172, 286–322 CrossRef CAS.
- E. D. Sloan, Am. Mineral., 2004, 89, 1155–1161 CrossRef CAS.
- C. A. Koh, Chem. Soc. Rev., 2002, 31, 157–167 RSC.
- M. A. Kelland, Energy Fuels, 2006, 20, 825–847 CrossRef CAS.
- J. L. Creek, Energy Fuels, 2012, 26, 4112–4116 CrossRef CAS.
- M. R. Anklam, J. D. York, L. Helmerich and A. Firoozabadi, AIChE J., 2008, 54, 565–574 CrossRef CAS.
- D. Sloan, C. Koh, A. K. Sum, A. L. Ballard, J. Creek, M. Eaton, J. Lachance, N. Mcmullen, T. Palermo and G. Shoup, Natural Gas Hydrates in Flow Assurance, 2010 Search PubMed.
- J. Sjöblom, B. Øvrevoll, G. Jentoft, C. Lesaint, T. Palermo, A. Sinquin, P. Gateau, L. Barré, S. Subramanian, J. Boxall, S. Davies, L. Dieker, D. Greaves, J. Lachance, P. Rensing, K. Miller, E. D. Sloan and C. A. Koh, J. Dispersion Sci. Technol., 2010, 31, 1100–1119 CrossRef.
- D. Costa Salmin, J. Delgado-Linares, D. T. Wu, L. E. Zerpa and C. A. Koh, Presented in part at the Offshore Technology Conference, Houston, Texas, 2019/4/26, 2019 Search PubMed.
- K. Erstad, S. Høiland, P. Fotland and T. Barth, Energy Fuels, 2009, 23, 2213–2219 CrossRef CAS.
- T. Barth, S. Høiland, P. Fotland, K. M. Askvik, B. S. Pedersen and A. E. Borgund, Org. Geochem., 2004, 35, 1513–1525 CrossRef CAS.
- E. P. Brown, S. J. Hu, J. Wells, X. H. Wang and C. A. Koh, Energy Fuels, 2018, 32, 6619–6626 CrossRef CAS.
- M. A. Bellucci, M. R. Walsh and B. L. Trout, J. Phys. Chem. C, 2018, 122, 2673–2683 CrossRef CAS.
- Z. M. Aman, K. Olcott, K. Pfeiffer, E. D. Sloan, A. K. Sum and C. A. Koh, Langmuir, 2013, 29, 2676–2682 CrossRef CAS PubMed.
- T. Bui, A. Phan, D. Monteiro, Q. Lan, M. Ceglio, E. Acosta, P. Krishnamurthy and A. StrioloD, Langmuir, 2017, 33, 2263–2274 CrossRef CAS PubMed.
- M. A. Kelland, T. M. Svartaas, J. Ovsthus, T. Tomita and K. Mizuta, Chem. Eng. Sci., 2006, 61, 4290–4298 CrossRef CAS.
- Z. M. Aman, L. E. Dieker, G. Aspenes, A. K. Sum, E. D. Sloan and C. A. Koh, Energy Fuels, 2010, 24, 5441–5445 CrossRef CAS.
- Z. M. Aman and C. A. Koh, Chem. Soc. Rev., 2016, 45, 1678–1690 RSC.
- A. Phan, T. Bui, E. Acosta, P. Krishnamurthy and A. Striolo, Phys. Chem. Chem. Phys., 2016, 18, 24859–24871 RSC.
- A. Kumar, G. Bhattacharjee, B. D. Kulkarni and R. Kumar, Ind. Eng. Chem. Res., 2015, 54, 12217–12232 CrossRef CAS.
- U. Karaaslan and M. Parlaktuna, Energy Fuels, 2000, 14, 1103–1107 CrossRef CAS.
- A. A. Bertolazzo, P. M. Naullage, B. Peters and V. Molinero, J. Phys. Chem. Lett., 2018, 9, 3224–3231 CrossRef CAS PubMed.
- T. Bui, F. Sicard, D. Monteiro, Q. Lan, M. Ceglio, C. Burress and A. Striolo, J. Phys. Chem. Lett., 2018, 9, 3491–3496 CrossRef CAS PubMed.
- Z. M. Aman, E. P. Brown, E. D. Sloan, A. K. Sum and C. A. Koh, Phys. Chem. Chem. Phys., 2011, 13, 19796–19806 RSC.
- T. Austvik, X. Y. Li and L. H. Gjertsen, Ann. N. Y. Acad. Sci., 2000, 912, 294–303 CrossRef CAS.
- A. Fidel-Dufour, F. Gruy and J. M. Herri, Chem. Eng. Sci., 2006, 61, 505–515 CrossRef CAS.
- R. Camargo, T. Palermo, A. Sinquin and P. Glenat, Ann. N. Y. Acad. Sci., 2000, 912, 906–916 CrossRef.
- Z. M. Aman, E. D. Sloan, A. K. Sum and C. A. Koh, Energy Fuels, 2012, 26, 5102–5108 CrossRef CAS.
- L. E. Dieker, Z. M. Aman, N. C. George, A. K. Sum, E. D. Sloan and C. A. Koh, Energy Fuels, 2009, 23, 5966–5971 CrossRef CAS.
- F. Sicard, T. Bui, D. Monteiro, Q. Lan, M. Ceglio, C. Burress and A. Striolo, Langmuir, 2018, 34, 9701–9710 CrossRef CAS PubMed.
- P. M. Naullage, A. A. Bertolazzo and V. Molinero, ACS Cent. Sci., 2019, 5, 428–439 CrossRef CAS PubMed.
- D. J. Turner, K. T. Miller and E. D. Sloan, Chem. Eng. Sci., 2009, 64, 3996–4004 CrossRef CAS.
- Z. M. Aman, E. P. Brown, E. D. Sloan, A. K. Sum and C. A. Koh, Phys. Chem. Chem. Phys., 2011, 13, 19796 RSC.
- F. Jimenez-Angeles and A. Firoozabadi, ACS Cent. Sci., 2018, 4, 820–831 CrossRef CAS PubMed.
- J. M. Wang, R. M. Wolf, J. W. Caldwell, P. A. Kollman and D. A. Case, J. Comput. Chem., 2004, 25, 1157–1174 CrossRef CAS PubMed.
- J. L. F. Abascal and C. Vega, J. Chem. Phys., 2005, 123, 234505 CrossRef CAS PubMed.
- B. Fang, F. L. Ning, P. Q. Cao, L. Peng, J. Y. Wu, Z. Zhang, T. J. H. Vlugt and S. Kjelstrup, J. Phys. Chem. C, 2017, 121, 23911–23925 CrossRef CAS.
- F. L. Ning, K. Glavatskiy, Z. Ji, S. Kjelstrup and T. J. H. Vlugt, Phys. Chem. Chem. Phys., 2015, 17, 2869–2883 RSC.
- W. L. Jorgensen, D. S. Maxwell and J. TiradoRives, J. Am. Chem. Soc., 1996, 118, 11225–11236 CrossRef CAS.
- G. Bussi, D. Donadio and M. Parrinello, J. Chem. Phys., 2007, 126, 014101 CrossRef PubMed.
- M. Parrinello, J. Appl. Phys., 1981, 52, 7182–7190 CrossRef CAS.
- T. Darden, D. York and L. Pedersen, J. Chem. Phys., 1993, 98, 10089–10092 CrossRef CAS.
- M. A. Ratner, Phys. Today, 1997, 50, 66 Search PubMed.
- F. Takeuchi, M. Hiratsuka, R. Ohmura, S. Alavi, A. K. Sum and K. Yasuoka, J. Chem. Phys., 2013, 138, 124504 CrossRef PubMed.
- P. Licence, Fuel, 2008, 87, 3158 CrossRef CAS.
- G. M. Torrie and J. P. Valleau, J. Comput. Phys., 1977, 23, 187–199 CrossRef.
- S. Kumar, D. Bouzida, R. H. Swendsen, P. A. Kollman and J. M. Rosenberg, J. Comput. Chem., 1992, 13, 1011–1021 CrossRef CAS.
- J. L. Pascualahuir, E. Silla and I. Tunon, J. Comput. Chem., 1994, 15, 1127–1138 CrossRef CAS.
- R. F. W. Bader, M. T. Carroll, J. R. Cheeseman and C. Chang, J. Am. Chem. Soc., 1987, 109, 7968–7979 CrossRef CAS.
- J. S. Hub, B. L. de Groot and D. van der Spoel, J. Chem. Theory Comput., 2010, 6, 3713–3720 CrossRef CAS.
- M. W. Sun and A. Firoozabadi, J. Colloid Interface Sci., 2013, 402, 312–319 CrossRef CAS PubMed.
- Z. M. Aman, S. E. Joshi, E. D. Sloan, A. K. Sum and C. A. Koh, J. Colloid Interface Sci., 2012, 376, 283–288 CrossRef CAS PubMed.
- D. Laage and J. T. Hynes, J. Phys. Chem. B, 2008, 112, 14230–14242 CrossRef CAS PubMed.
- D. Laage and J. T. Hynes, Science, 2006, 311, 832–835 CrossRef CAS PubMed.
- B. Fang, T. J. Wang, X. Chen, T. Jin, R. T. Zhang and W. Zhuang, J. Phys. Chem. B, 2015, 119, 12390–12396 CrossRef CAS PubMed.
- G. Aspenes, L. E. Dieker, Z. M. Aman, S. Hoiland, A. K. Sum, C. A. Koh and E. D. Sloan, J. Colloid Interface Sci., 2010, 343, 529–536 CrossRef CAS PubMed.
- K. D. He and W. D. Allen, J. Chem. Theory Comput., 2016, 12, 3571–3582 CrossRef CAS PubMed.
- G. A. DiLabio and E. R. Johnson, J. Am. Chem. Soc., 2007, 129, 6199–6203 CrossRef CAS PubMed.
- L. Zhao, J. Liu and P. Zhou, J. Chem. Phys., 2018, 149, 034309 CrossRef PubMed.
- P. Politzer, P. R. Laurence and K. Jayasuriya, Environ. Health Perspect., 1985, 61, 191–202 CrossRef CAS PubMed.
- F. W. Starr, J. K. Nielsen and H. E. Stanley, Phys. Rev. Lett., 1999, 82, 2294–2297 CrossRef CAS.
- M. A. Kelland, Energy Fuels, 2018, 32, 12001–12012 CrossRef CAS.
- L. A. Baez and P. Clancy, Ann. N. Y. Acad. Sci., 1994, 715, 177–186 CrossRef CAS.
- M. R. Anklam, J. D. York, L. Helmerich and A. Firoozabadi, AIChE J., 2008, 54, 565–574 CrossRef CAS.
- T. Yagasaki, M. Matsumoto and H. Tanaka, J. Phys. Chem. B, 2018, 122, 3396–3406 CrossRef CAS PubMed.
- T. Yagasaki, M. Matsumoto and H. Tanaka, J. Am. Chem. Soc., 2015, 137, 12079–12085 CrossRef CAS PubMed.
Footnote |
| † Electronic supplementary information (ESI) available: Models and simulation methods, binding energy, binding free energy and quantum chemical calculations. See DOI: 10.1039/d0ra04088f |
| This journal is © The Royal Society of Chemistry 2020 |

