DOI:
10.1039/D0RA04068A
(Paper)
RSC Adv., 2020,
10, 28664-28673
Study on the adsorption mechanism of benzoylurea insecticides onto modified hyperbranched polysilicon materials
Received
6th May 2020
, Accepted 12th July 2020
First published on 4th August 2020
Abstract
Several hyperbranched polysilicon (HBPS) materials with different end group modifications were designed and synthesized and the structures were characterized. The modified HBPS polymers were applied to the adsorption of benzoylurea insecticides (BUs). The binding mode and binding energy between the HBPS and BUs were quantified and the results of an adsorption kinetics study and an adsorption thermodynamics experiment were verified by calculation and mutual verification. The adsorption mechanism of BUs onto HBPS was also discussed. The theoretical results show that the most effective way to combine the adsorbent and BUs is via hydrogen bonding when the end group is an amino group. Moreover, the most effective combination when the end group is β-cyclodextrin is the interaction of the BUs with the interior of the cavity to form a host–guest coating. The theoretical results of other end group-modified HBPS materials were also obtained and verified by adsorption experiments. In this work, an experimental method for obtaining the binding mode by theoretical calculations and then verifying it according to adsorption experiments was established.
1. Introduction
Benzoylurea insecticides (BUs) are a class of pesticides that interfere with the formation of chitin in insect cuticles, which will block molting and lead to subsequent rupture of the malformed cuticle or death from starvation.1,2 After several decades of development, these insecticides are still widely used in agriculture. BUs, such as diflubenzuron, hexaflumuron, flufenoxuron, teflubenzuron, lufenuron and chlorfluazuron, have been widely used in pest management systems due to their attractive properties, which include high insecticidal activity, great selectivity and rapid biodegradation.3 The high employment of these insecticides has led to the accumulation of their residues in soil, groundwater and surface water. According to European Union regulations, the content of BUs residues in environmental water must be less than 0.05 mg kg−1.4 Some sensitive analytical methods for monitoring these compounds were developed. However, there are few reports on the adsorption mechanism of BUs.
Hyperbranched polysilicon (HBPS) materials have high application value in the fields of flame retardant materials, drug loading and material modification due to their good chemical stability, good material compatibility and their high number of reactive functional end groups.5,6 In previous work, the application of a β-cyclodextrin (β-CD)-modified and amino-modified HBPS material in the analytical detection of BUs residues demonstrates its potential as an adsorbent material.7,8 At the same time, the material compatibility and end group activity of HBPS materials are also promising. The end group modification of the HBPS material can further utilize its highly branched spatial structure, increase the number of surface active groups per unit material and expand its application range.9,10
Density functional theory (DFT) is a representation of quantum theory developed in 1964 based on the Thomas–Femi model and proposed in the Hohenberg–Kohn theorem.11,12 In recent years, DFT has been combined with molecular dynamics methods. Many new developments have become an important foundation and technical core for the calculation of condensed matter physics, computational materials science and computational quantum chemistry. Quantum chemical calculations have been gradually applied to study the adsorption and diffusion behavior of adsorbed materials on target analytes.13 Through quantum chemical methods, the interaction between particles is calculated to obtain adsorbed materials and target compounds in different substrates (gaseous or liquid). The density functionalization plus attenuation dispersion proposed by Wu describes the hydrogen peroxide and hydroquinone systems,14 indicating that the theory can be applied to water, surface physical adsorption and chemical reactions involving hydrogen bonding. Mueller et al. used DFT, PBE exchange-related functional theory and periodic boundary conditions to study the adsorption of hydrogen molecules in the material by simulating the combination of the spatial configuration of metal–organic frameworks and hydrogen molecules.15 However, there have been few reports on the study of mechanisms using quantum chemical calculation methods in solid phase extraction adsorption.16 Since the HBPS material has the characteristics of strong plasticity and easy modification,17 the combination of the adsorbent and the target analyte and the spatial configuration after the combination are simulated by the quantum chemical calculation method, and then the macroscopic adsorption test is carried out to verify the calculation results.
In this study, a series of HBPS adsorbents with different end groups were designed and synthesized.18,19 The adsorption mechanism between different end group-modified HBPS materials and BUs was discussed by measuring the adsorption kinetics, adsorption isotherms and adsorption binding energy. The binding mechanism of the modified HBPS to the target analyte and the molecular structure of the adsorbed material and the target analyte were optimized by quantum chemical calculations. The combination method and binding energy were optimized, and the calculation results were confirmed by the experimental results. The binding mechanism between the adsorption materials of different end groups and the target analytes was discussed. The results were verified by the results of molecular simulation to prove the feasibility of the proposed method. This method provides predictability and diverse possibilities for studying the extraction mechanism of target analytes and guiding the molecular design and synthesis of new, selective adsorbents.
2. Materials and methods
2.1 Chemicals and reagents
Stock standard solutions of individual compounds (diflubenzuron, hexaflumuron, flufenoxuron, teflubenzuron, lufenuron, and chlorfluazuron) at a concentration of 1000 mg L−1 were prepared by exact weighing of the powder that was then dissolved in methanol or acetonitrile. A working standard mixture at a concentration of 10 mg L−1 was prepared in acetonitrile by appropriate dilutions of the stock solutions. All solutions were stored at −18 °C in the dark.
The pesticide standards (diflubenzuron, hexaflumuron, flufenoxuron, teflubenzuron, lufenuron, and chlorfluazuron) were purchased from Aladdin Reagent Corporation (Shanghai, China). Ammonia solution, ethanol and acetone were purchased from Beijing Chemical Factory (Beijing, China).
2.2 Instrumentation
Chromatographic analysis was performed on an Agilent 1260 HPLC (Quantum Design, San Diego, CA, USA) system equipped with an ultraviolet detector (UVD) and an autosampler. Sample separations were conducted on a Venusil XBP C18 (L) column (250 × 4.6 mm i.d., 5 μm) with a Spursil C18 guard column (10 × 2.1 mm i.d., 5 μm). A mixture of methanol (A) and water (B) was used as the mobile phase at a flow rate of 0.7 mL min−1. The gradient conditions were 79% A and 21% B for 2 min, then increased from 79% A to 89% A over 21 min and decreased from 89% A to 79% A.
2.3 Synthesis of terminally modified HBPS materials
2.3.1 Synthesis of amino-modified HBPS. First, 0.5 g cetyltrimethylammonium bromide was added to 70 mL deionized water. Then, 5 mL ethanol, 15 mL diethyl ether and 0.8 mL 30% aqueous ammonia were added. The mixture was stirred at 40 °C for 30 min. Then, 2.5 mL tetraethyl orthosilicate and 0.1 mL triaminopropyltriethoxysilane were mixed and added to the above liquid and stirred at 40 °C for 4 h. At the end of the reaction, hydrochloric acid was added to terminate the reaction, and the mixture was centrifuged at 3500 rpm for 5 min. The precipitate was transferred to the sediment at the bottom and dried under vacuum at 50 °C for 8 h.20
2.3.2 Synthesis of carboxyl-modified HBPS. First, 0.5 g amino-modified HBPS was added to 50 mL DMF. Then, 4.5 g succinic anhydride was dissolved in 12.5 mL of DMF and added to 4.5 mL triethanolamine. After a 30 min reaction, the obtained product was washed with water and ethanol and dried under vacuum at 50 °C for 8 h.
2.3.3 Synthesis of phenyl-modified HBPS. Briefly, 35 mg 1-(3-dimethylaminopropyl)-3-ethylcarbodiimide hydrochloride (EDC), 20 mg N-hydroxysuccinimide (NHS) and 30 mg carboxyl-modified HBPS was added to 20 mL DMF, sonicated for 5 min and stirred at 35 °C for 30 min. Then, 200 μL benzylamine was added to 1 mL of ethanol and the above reaction solution was added and stirred at 35 °C for 5 h. The obtained product was washed with water and ethanol and then dried under vacuum at 50 °C for 8 h.
2.3.4 Synthesis of alkyl-modified HBPS. First, 35 mg EDC, 20 mg NHS and 30 mg carboxyl-modified HBPS was added to 20 mL DMF, sonicated for 5 min and stirred at 35 °C for 30 min. Then, 200 μL hexylamine was added to 1 mL ethanol and the above reaction solution was added dropwise and stirred at 35 °C for 5 h. After suction filtration under reduced pressure, the obtained product was washed with water and ethanol and then dried under vacuum at 50 °C for 8 h.
2.3.5 Synthesis of β-CD-modified HBPS.
2.3.5.1 Synthesis of mono-6-deoxy-(p-toluenesulfonyl)-β-CD (β-CD-O-Ts). NaOH (2.4 g) was dissolved in 8 mL water. Then, 22.7 g β-CD and 200 mL water were added to the solution, and the mixture was stirred at 10–15 °C for 15 min. p-Toluenesulfonyl chloride (5.76 g) was dissolved in 12 mL acetonitrile, added dropwise to the above reaction solution and stirred at 12–13 °C for 4 h. 1 mL hydrochloric acid was added to terminate the reaction. The precipitate was obtained by suction filtration under reduced pressure and dried under vacuum at 50 °C for 8 h.
2.3.5.2 Synthesis of β-CD-modified HBPS. First, 0.5 g β-CD-O-Ts was added to 50 mL DMF under stirring. Then, 1.5 g amino-modified HBPS was slowly added, and 5 drops of triethylamine were added and reacted at 140 °C for 24 h. After suction filtration under reduced pressure, the obtained product was washed with water and acetone and then dried at 50 °C for 8 h.
2.4 Computational model and method for DFT research
In this study, the geometrical model of six kinds of end-modified HBPS materials was constructed by DFT. Then, all the atoms in the model were fixed with water set as the solvent and one was added at different initial positions. Similarly, the destructive urea molecule of the geometric structure model was constructed and the diflubenzuron molecule could move freely in the solvent space. After the geometric configuration optimization calculation, the stable configuration with the lowest energy at different positions of different adsorbent materials was obtained. From the optimal adsorption configuration obtained after optimization, the adsorption energy of diflubenzuron was calculated. The effective adsorption position of diflubenzuron and adsorbent was distinguished according to the size of adsorption energy, and the microstructure of each adsorption configuration was investigated. The effect of different functional groups in the end group-modified HBPS materials on the adsorption energy of diflubenzuron was evaluated.21
According to the characteristics of the material and the possible adsorption mechanism, in the case determined by the calculation method B3LYP, the basis set of 6-31G (d,p) was selected to improve the calculation accuracy. After calculation and optimization, the binding energy of the corresponding optimal position of diflubenzuron and the different end group-modified HBPS material binding configurations were obtained the different end group-modified HBPS and diflubenzuron were subtracted. The sum of the energy of the geometric configuration gave the binding energy of diflubenzuron and HBPS adsorption, which was expressed by the following formula:
| | |
ΔEads = EHBPS–BU − EHBPS − EBU
| (1) |
where
EHBPS–BU represents the energy of the HBPS material in the stable configuration of diflubenzuron and
EHBPS and
EBU represent the energy of the HBPS and diflubenzuron geometry, respectively. By comparing the energy of different positions and bonding after optimization, the relative stability of adsorption, the preferential position and the configuration of adsorption can be obtained.
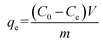
2.5 Adsorption studies
Adsorption studies for the evaluation of the adsorption of BUs from aqueous solutions onto the adsorbent were carried out in triplicate. Typically, 3.0 mg of adsorbent was dispersed in a conical flask with 30 mL of a dye solution (60–120 mg L−1). The conical flask was shaken by an oscillator (SHA-BA, Changzhou HUAO Instrument Co., China) for 6 h at a speed of 150 rpm and at the temperatures of 30 °C. The adsorptive precipitations were separated from the dye solution by an adscititious magnet.22
The concentrations of the supernatant containing residual BUs were determined by HPLC-UV. The amount of BUs adsorbed on adsorbent per unit mass, at equilibrium, qe (mg g−1), and at any time t, qt (mg g−1), was calculated by eqn (2) and (3), respectively. The BU percent adsorption was calculated using eqn (4).
| |
 | (2) |
| |
 | (3) |
| |
 | (4) |
where
C0 (mg L
−1) is the initial BU concentration;
Ce (mg L
−1) is the BU concentration at equilibrium;
Ct (mg L
−1) is the BU concentration at time
t (min);
V (L) is the volume of the solution and
m (g) is the mass of the adsorbent used.
3. Results and discussion
3.1 Characterization of end-modified HBPS
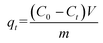
The infrared spectrum of the terminal-modified HBPS is shown in Fig. 1. The main characteristic peak of the HBPS material is the characteristic absorption peak of the Si–O bond at approximately 1045 cm−1, which exists in all end group-modified HBPS materials and proves that all of the materials are HBPS. For the hyperbranched polymer in which the terminal group is an amino group, there is an absorption peak of a C![[double bond, length as m-dash]](https://www.rsc.org/images/entities/char_e001.gif) O double bond at 1656 cm−1, which is a characteristic peak generated by the amide bond formed during the modification. For the hyperbranched polymer whose terminal group was modified with a carboxyl group, the broad peak at 3030–3600 cm−1 is the characteristic absorption peak of the hydroxyl group in the carboxyl group; in the phenyl-modified HBPS material, the characteristic absorption of the Si–O bond is very strong, which masks the characteristic absorption of the benzene ring at 1040 cm−1, but the infrared spectrum of this compound is different from the infrared spectra of the other products, as it has no hydrogen bond peak generated by surface active hydrogen atoms; when the hyperbranched end group is a hexyl chain, the polymer has a characteristic absorption peak of methylene at 2920 cm−1 and 2850 cm−1, while the HBPS with a β-CD end group has a strong hydroxyl absorption peak and sub-methyl absorption peak.23
O double bond at 1656 cm−1, which is a characteristic peak generated by the amide bond formed during the modification. For the hyperbranched polymer whose terminal group was modified with a carboxyl group, the broad peak at 3030–3600 cm−1 is the characteristic absorption peak of the hydroxyl group in the carboxyl group; in the phenyl-modified HBPS material, the characteristic absorption of the Si–O bond is very strong, which masks the characteristic absorption of the benzene ring at 1040 cm−1, but the infrared spectrum of this compound is different from the infrared spectra of the other products, as it has no hydrogen bond peak generated by surface active hydrogen atoms; when the hyperbranched end group is a hexyl chain, the polymer has a characteristic absorption peak of methylene at 2920 cm−1 and 2850 cm−1, while the HBPS with a β-CD end group has a strong hydroxyl absorption peak and sub-methyl absorption peak.23
 |
| | Fig. 1 FT-IR spectral characterization of HBPS-NH2, HBPS-Ph, HBPS-β-CD, HBPS-C6H13 and HBPS-COOH. | |
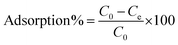
The SEM and TEM images are shown in Fig. 2. The TEM images of HBPS exhibits a distinct core–shell structure and many folds exist on the surface of the spherical structure, which increase the specific surface area.24 For the SEM images of the end-modified HBPS materials, the surfaces become denser and smoother with the introduction of the end group modifications, and the rough surfaces are still retained.25,26
 |
| | Fig. 2 SEM images of HBPS-NH2 (a), HBPS-Ph (b), HBPS-COOH (c), HBPS-C6H13 (d) and HBPS-β-CD (e) and TEM images of HBPS (f and g). | |
3.2 DFT calculation study
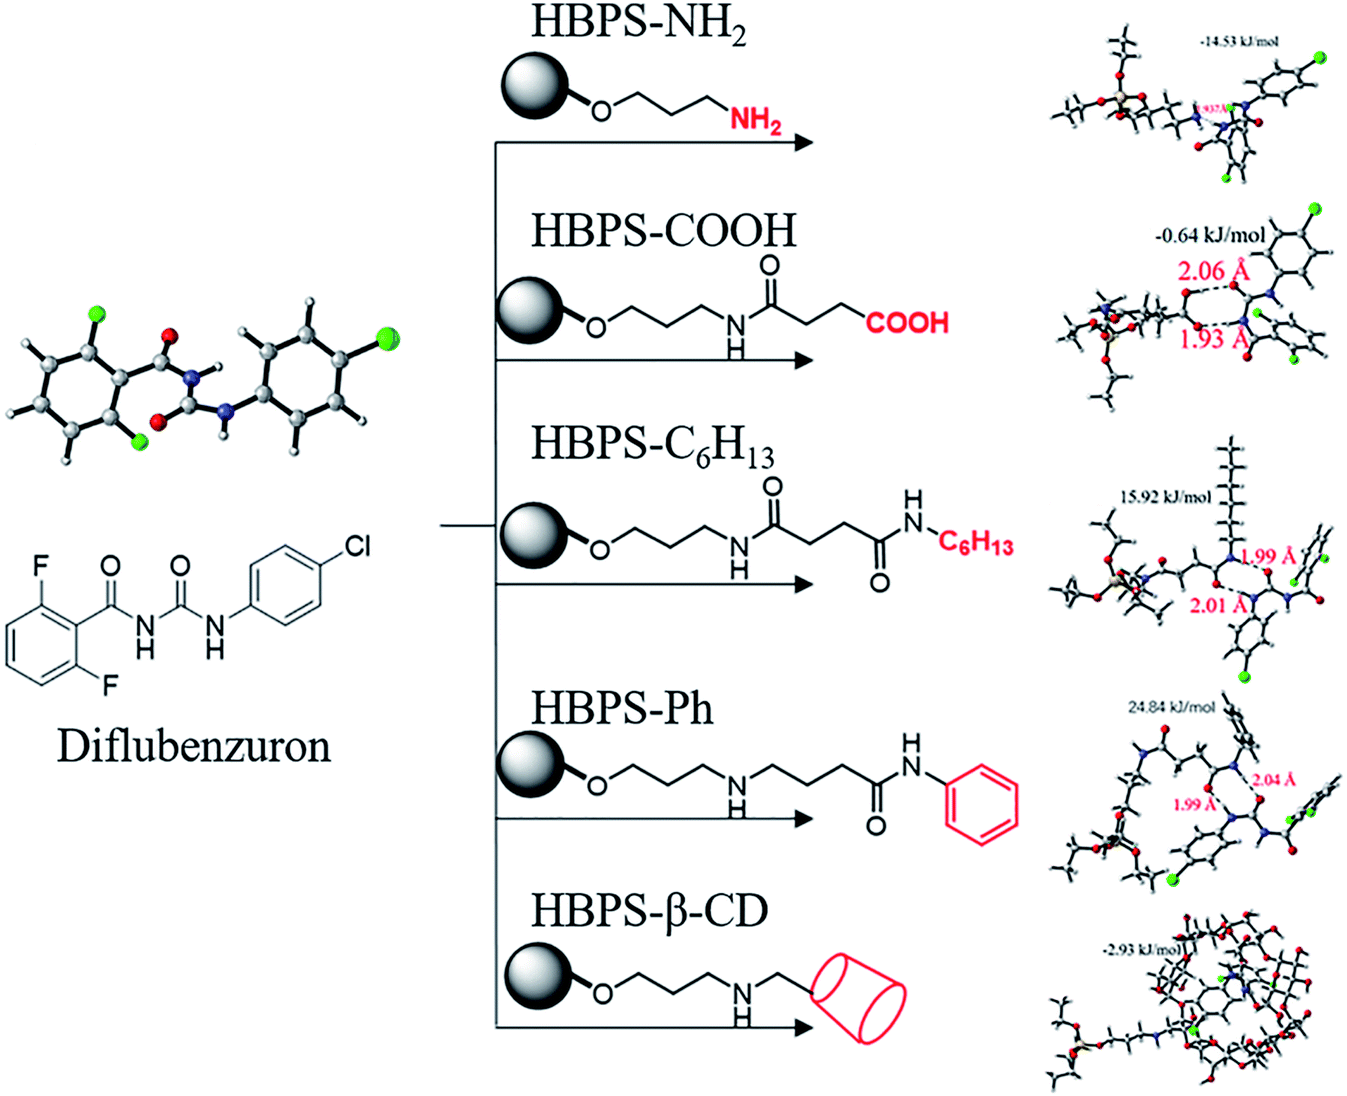
According to the calculation method described above, the geometric configurations of the six end group-modified HBPS materials and diflubenzuron molecules were calculated. Fig. 3 shows the combination of the diflubenzuron and the terminal-modified HBPS materials and the bond length. For the HBPS material whose terminal group is an amino group, the main part of the hyperbranched structure has a limited effect on the adsorption bonding and the main position of adsorption is the hydrogen bond of the amino group.27,28 Other HBPS materials can form a 6- or 8-membered ring structure by hydrogen bonding with the acyl urea skeleton in diflubenzuron due to its amide bond, so it is used as one of the main positions of adsorption simulation.29 The π–π interaction in which the phenyl group may exist. The host–guest interaction in which the terminal group is β-CD, and the carboxyl group in the terminal group are preferentially calculated. It can be seen from Fig. 3 that the HBPS material whose terminal group is an amino group, a carboxyl group, phenyl group or hexyl group is combined with diflubenzuron mainly by hydrogen bonding. When the amide bond is combined with the acyl urea skeleton in diflubenzuron to form a cyclic structure, the energy is minimal, especially in the combination with the hyperbranched silicone having a terminal phenyl groups and the expected mutual π–π interactions.30,31 The effect did not form a stable configuration. In the binding structure of HBPS with β-CD and diflubenzuron, due to hydrophobic interactions, the diflubenzuron molecule enters the internal hydrophobic cavity of β-CD to form host–guest interactions. The situation and the combined Gibbs free energy indicate that the probability of this happening is high. The calculation results of the specific Gibbs free energy and its variation values are shown in Table 1. The mode of action and results of other BUs and terminal-modified HBPS are similar to the simulation results of diflubenzuron and are not listed.
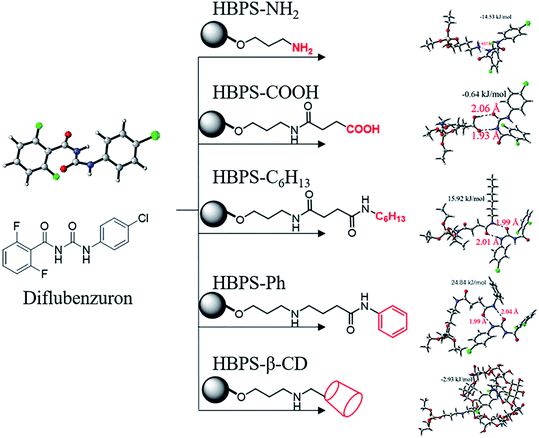 |
| | Fig. 3 Binding mode and binding energy between modified HBPS and diflubenzuron. | |
Table 1 Binding energy between diflubenzuron and modified HBPS in aqueous solvent
| Model |
Correction value |
G (Hartree) |
ΔG (kcal mol−1) |
ΔG (kJ mol−1) |
| Diflubenzuron |
0.1602 |
−1458.26 |
|
|
| HBPS-NH2 |
0.2790 |
−1001.56 |
|
|
| HBPS-COOH |
0.3471 |
−1381.94 |
|
|
| HBPS-C6H13 |
0.5172 |
−1597.64 |
|
|
| HBPS-β-CD |
1.3850 |
−5198.26 |
|
|
| HBPS-Ph |
0.4587 |
−1632.16 |
|
|
| Diflubenzuron–HBPS-NH2 |
0.4586 |
−2459.83 |
−3.4753 |
−14.5335 |
| Diflubenzuron–HBPS-COOH |
0.5269 |
−2840.21 |
−0.1546 |
−0.6464 |
| Diflubenzuron–HBPS-C6H13 |
0.7007 |
−3055.89 |
3.8065 |
15.9186 |
| Diflubenzuron–HBPS-β-CD |
1.5728 |
−6656.52 |
−0.7012 |
−2.9323 |
| Diflubenzuron–HBPS-Ph |
0.6461 |
−3090.42 |
5.9395 |
24.8390 |
3.3 Effect of initial concentration and adsorption time on the adsorption of BUs
The initial concentration and adsorption time of the target analyte in the sample solution have an important influence on the adsorption process and adsorption mechanism.32 Therefore, in the presence of different target analytes and different initial concentrations in the solution, the adsorption rate changes with the adsorption time. The experimental results are shown in Fig. 3. Taking dipyridamole as an example, when the initial concentration of the terminal amino group-modified HBPS material is 120 mg L−1, the adsorbent adsorbs the target analyte after 1 h. The adsorption rate was 85.6%, and the adsorption rate reached 92.1% at 3 h, after which the adsorption tended to plateau. At the initial concentration of 100 mg L−1, the adsorption rates at 1 h and 3 h were 83.8% and 91.1%, respectively. Other target analyte adsorption rates vary with time and initial concentration. The experimental results show that at the beginning of adsorption, the terminal amino HBPS adsorbent rapidly adsorbs the BUs and then approaches equilibrium and the active adsorption of the target analyte onto the adsorbent in the process. The sites are then combined. After a period of time, the adsorption sites on the surface of the adsorbent are reduced, and adsorption of target analyte becomes difficult, leading to an adsorption plateau. The adsorption results of six BUs onto amino-modified HBPS are shown in Fig. 4.
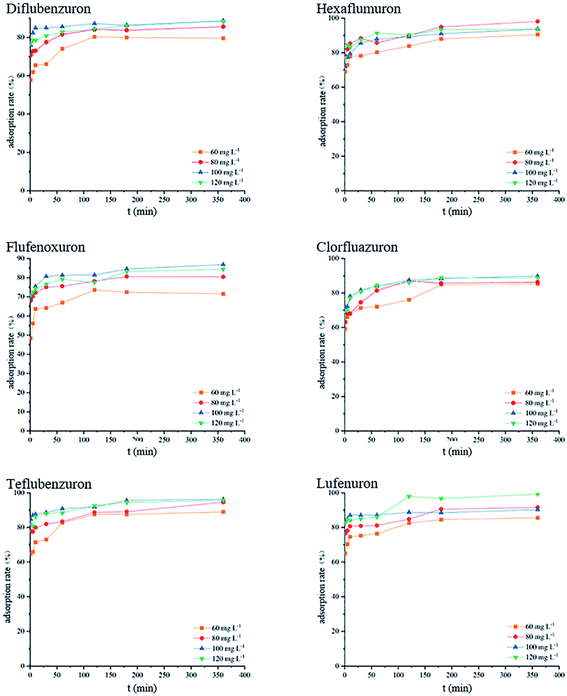 |
| | Fig. 4 The adsorption rate of each analyte at different times. | |
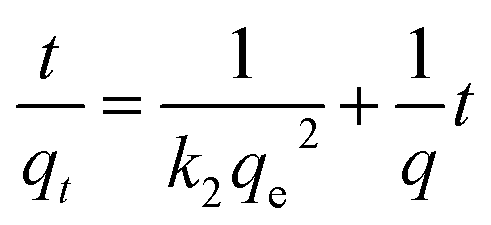
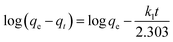
3.4 Adsorption kinetics
For further study of the adsorption kinetics, the classical adsorption model (pseudo-first order kinetic model and pseudo-second order kinetic model) were applied to simulate the adsorption kinetics of benzoylureas and the adsorbent. The formula is:| |
 | (5) |
| |
 | (6) |
where qe (mg−1) and qt (mg−1) are the amount of target compound adsorbed at equilibrium time and time t (min). k1 is the rate constant of the pseudo-first order kinetic model. k2 is the rate constant (mg g−1 min−1) of the pseudo-second order kinetic model.
The calculated dynamic parameters are shown in the Tables 2–6. The linear correlation coefficient R2 ≥ 0.999 for the pseudo-second order kinetic model. The results of qe,cal and qe,exp calculated by the pseudo-second order kinetic model are in good agreement with the experimental data. Therefore, by comparing the calculated values of the two models with the experimental values obtained in the experiment, it can be seen that the adsorption process of magnetic hyperbranched polyester adsorbent for benzoylurea compounds conforms to the pseudo-second order kinetic model, indicating that the adsorption mechanism mainly depends on the interaction between the adsorbent and the target analyte.
Table 2 Adsorption kinetics constants for diflubenzuron adsorption on HBPS-NH2 for different initial concentrations
| C0 (mg L−1) |
qe,exp (mg g−1) |
Pseudo-first order kinetic model |
Pseudo-second order kinetic model |
| qe,cal (mg g−1) |
k1 (min−1) |
R2 |
qe,cal (mg g−1) |
k2 (g mg−1 min−1) |
R2 |
| 60 |
153.29 |
34.36 |
0.0223 |
0.8557 |
156.35 |
0.0412 |
0.9998 |
| 80 |
152.23 |
49.47 |
0.0215 |
0.9393 |
158.16 |
0.0310 |
0.9999 |
| 100 |
159.31 |
56.16 |
0.0089 |
0.8918 |
160.83 |
0.0044 |
0.9995 |
| 120 |
160.12 |
82.41 |
0.0070 |
0.8137 |
161.73 |
0.0031 |
1.0000 |
Table 3 Adsorption kinetics constants for diflubenzuron adsorption on HBPS-COOH for different initial concentrations
| C0 (mg L−1) |
qe,exp (mg g−1) |
Pseudo-first order kinetic model |
Pseudo-second order kinetic model |
| qe,cal (mg g−1) |
k1 (min−1) |
R2 |
qe,cal (mg g−1) |
k2 (g mg−1 min−1) |
R2 |
| 60 |
93.74 |
26.15 |
0.0287 |
0.7315 |
94.16 |
0.0329 |
0.9999 |
| 80 |
97.66 |
34.12 |
0.0253 |
0.6834 |
96.41 |
0.0348 |
1.0000 |
| 100 |
98.16 |
42.92 |
0.0084 |
0.8352 |
98.07 |
0.0047 |
0.9993 |
| 120 |
99.48 |
47.15 |
0.0075 |
0.7517 |
100.09 |
0.0048 |
0.9995 |
Table 4 Adsorption kinetics constants for diflubenzuron adsorption on HBPS-C6H14 for different initial concentrations
| C0 (mg L−1) |
qe,exp (mg g−1) |
Pseudo-first order kinetic model |
Pseudo-second order kinetic model |
| qe,cal (mg g−1) |
k1 (min−1) |
R2 |
qe,cal (mg g−1) |
k2 (g mg−1 min−1) |
R2 |
| 60 |
77.21 |
24.25 |
0.0308 |
0.7182 |
78.31 |
0.0410 |
0.9998 |
| 80 |
84.16 |
37.09 |
0.0216 |
0.7401 |
84.23 |
0.0382 |
0.9998 |
| 100 |
86.92 |
37.74 |
0.0090 |
0.8222 |
85.82 |
0.0044 |
0.9997 |
| 120 |
87.62 |
44.96 |
0.0064 |
0.6958 |
87.55 |
0.0042 |
0.9994 |
Table 5 Adsorption kinetics constants for diflubenzuron adsorption on HBPS-β-CD for different initial concentrations
| C0 (mg L−1) |
qe,exp (mg g−1) |
Pseudo-first order kinetic model |
Pseudo-second order kinetic model |
| qe,cal (mg g−1) |
k1 (min−1) |
R2 |
qe,cal (mg g−1) |
k2 (g mg−1 min−1) |
R2 |
| 60 |
114.25 |
44.58 |
0.0269 |
0.8756 |
114.76 |
0.0278 |
0.9992 |
| 80 |
118.42 |
52.65 |
0.0244 |
0.8319 |
117.15 |
0.0350 |
1.0000 |
| 100 |
121.46 |
57.52 |
0.0083 |
0.8488 |
123.19 |
0.0048 |
0.9997 |
| 120 |
126.83 |
64.62 |
0.0065 |
0.7368 |
127.07 |
0.0040 |
0.9999 |
Table 6 Adsorption kinetics constants for diflubenzuron adsorption on HBPS-Ph for different initial concentrations
| C0 (mg L−1) |
qe,exp (mg g−1) |
Pseudo-first order kinetic model |
Pseudo-second order kinetic model |
| qe,cal (mg g−1) |
k1 (min−1) |
R2 |
qe,cal (mg g−1) |
k2 (g mg−1 min−1) |
R2 |
| 60 |
91.05 |
34.54 |
0.0209 |
0.7024 |
92.12 |
0.0317 |
0.9999 |
| 80 |
94.39 |
42.53 |
0.0220 |
0.7451 |
96.35 |
0.0415 |
0.9999 |
| 100 |
98.07 |
47.34 |
0.0089 |
0.8668 |
99.63 |
0.0048 |
0.9997 |
| 120 |
101.62 |
54.85 |
0.0090 |
0.9173 |
101.42 |
0.0032 |
0.9993 |
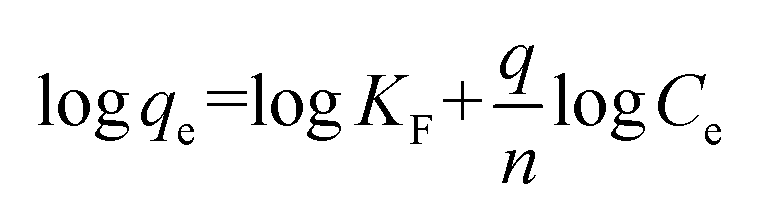
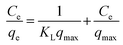
3.5 Adsorption isotherms
Isotherm studies can highlight the adsorptive characteristics of an adsorbent, which is the most important parameter for the design of adsorption processes. In this work, the two well-known Langmuir and Freundlich isotherm models were applied to determine the equilibrium adsorption of BUs on the adsorbent.
The Langmuir adsorption isotherm can be represented as follows:
| |
 | (7) |
where
Ce (mg L
−1) is the BU equilibrium concentration in the solution;
qe (mg g
−1) is the amount of BUs adsorbed at equilibrium;
qmax (mg g
−1) is the maximum theoretical adsorption capacity and
KL (L mg
−1) is the Langmuir adsorption constant related to the heat of adsorption. The slope and intercept of linear plots of
Ce/
qe versus Ce yield the values of 1/
qmax and 1/
KLqmax, respectively.
The linearized form of the Freundlich isotherm can be given as follows:
| |
 | (8) |
where
KF (mg
1−1/n L
1/n g
−1) is related to the adsorption capacity of the adsorbent and 1/
n is a constant depicting the adsorption intensity. The slope and intercept of linear plots of log
![[thin space (1/6-em)]](https://www.rsc.org/images/entities/char_2009.gif) qe versus
qe versus log
Ce yield the values of 1/
n and log
KF, respectively.
According to Langmuir theory, it assumes that adsorption occurs at a specific homogeneous site within the adsorbent. All sites are equivalent and there are no interactions between adsorbate molecules. The Freundlich isotherm is employed to describe heterogeneous systems and reversible adsorption, which is not restricted to monolayer formations.
The equilibrium adsorption isotherms of the BUs on the adsorbent were carried out at 30 °C, as shown in Fig. 3. Tables 7–11 show the values of parameters calculated by the Langmuir and Freundlich isotherms. The comparison of correlation coefficients (R2) of the linearized form of both equations indicates that the Langmuir model adequately described the adsorption of BUs on the adsorbent.
Table 7 Adsorption isotherm constants for BUs adsorption on HBPS-NH2
| T = 303 K |
Langmuir isotherm model |
Freundlich isotherm model |
| qmax (mg g−1) |
KL |
R2 |
RL |
KF (mg1−1/n L1/n g−1) |
n |
R2 |
| Diflubenzuron |
160.13 |
0.932 |
0.9910 |
0–1 |
88.185 |
4.0447 |
0.8146 |
| Hexaflumuron |
151.72 |
1.048 |
0.9945 |
0–1 |
81.502 |
4.5144 |
0.8887 |
| Flufenoxuron |
156.13 |
1.036 |
0.9971 |
0–1 |
79.326 |
4.7620 |
0.7626 |
| Clorfluazuron |
153.56 |
1.076 |
0.9907 |
0–1 |
81.309 |
4.7572 |
0.8002 |
| Teflubenzuron |
155.74 |
0.828 |
0.9985 |
0–1 |
76.122 |
4.9030 |
0.8288 |
| Lufenuron |
154.81 |
1.056 |
0.9963 |
0–1 |
81.081 |
4.9497 |
0.7936 |
Table 8 Adsorption isotherm constants for BUs adsorption on HBPS-COOH
| T = 303 K |
Langmuir isotherm model |
Freundlich isotherm model |
| qmax (mg g−1) |
KL |
R2 |
RL |
KF (mg1−1/n L1/n g−1) |
n |
R2 |
| Diflubenzuron |
100.62 |
1.068 |
0.9939 |
0–1 |
53.987 |
4.1549 |
0.7622 |
| Hexaflumuron |
92.63 |
1.014 |
0.9923 |
0–1 |
51.260 |
4.8152 |
0.8657 |
| Flufenoxuron |
82.99 |
1.064 |
0.9906 |
0–1 |
54.721 |
4.5176 |
0.8362 |
| Clorfluazuron |
94.43 |
0.952 |
0.9916 |
0–1 |
46.671 |
4.6576 |
0.7568 |
| Teflubenzuron |
96.24 |
0.992 |
0.9925 |
0–1 |
46.579 |
4.4624 |
0.8360 |
| Lufenuron |
92.17 |
0.968 |
0.9961 |
0–1 |
45.782 |
4.8544 |
0.7874 |
Table 9 Adsorption isotherm constants for BUs adsorption on HBPS-C6H13
| T = 303 K |
Langmuir isotherm model |
Freundlich isotherm model |
| qmax (mg g−1) |
KL |
R2 |
RL |
KF (mg1−1/n L1/n g−1) |
n |
R2 |
| Diflubenzuron |
87.50 |
0.968 |
0.9963 |
0–1 |
44.071 |
4.4716 |
0.8314 |
| Hexaflumuron |
82.12 |
0.932 |
0.9949 |
0–1 |
40.737 |
4.6980 |
0.8517 |
| Flufenoxuron |
85.92 |
1.144 |
0.9926 |
0–1 |
51.487 |
4.1232 |
0.7956 |
| Clorfluazuron |
85.99 |
0.844 |
0.9965 |
0–1 |
49.820 |
4.9324 |
0.8604 |
| Teflubenzuron |
87.86 |
1.207 |
0.9982 |
0–1 |
56.294 |
4.9292 |
0.7621 |
| Lufenuron |
84.83 |
1.160 |
0.9988 |
0–1 |
49.910 |
4.8564 |
0.8904 |
Table 10 Adsorption isotherm constants for BUs adsorption on HBPS-β-CD
| T = 303 K |
Langmuir isotherm model |
Freundlich isotherm model |
| qmax (mg g−1) |
KL |
R2 |
RL |
KF (mg1−1/n L1/n g−1) |
n |
R2 |
| Diflubenzuron |
127.12 |
1.096 |
0.9989 |
0–1 |
76.757 |
4.2768 |
0.8749 |
| Hexaflumuron |
111.44 |
1.148 |
0.9975 |
0–1 |
65.916 |
4.4928 |
0.7813 |
| Flufenoxuron |
123.59 |
0.828 |
0.9987 |
0–1 |
74.393 |
4.8972 |
0.8314 |
| Clorfluazuron |
120.44 |
1.088 |
0.9953 |
0–1 |
65.399 |
4.7032 |
0.7298 |
| Teflubenzuron |
125.73 |
0.849 |
0.9951 |
0–1 |
74.878 |
4.8156 |
0.8725 |
| Lufenuron |
110.75 |
1.057 |
0.9998 |
0–1 |
65.061 |
4.7536 |
0.8779 |
Table 11 Adsorption isotherm constants for BUs adsorption on HBPS-Ph
| T = 303 K |
Langmuir isotherm model |
Freundlich isotherm model |
| qmax (mg g−1) |
KL |
R2 |
RL |
KF (mg1−1/n L1/n g−1) |
n |
R2 |
| Diflubenzuron |
101.83 |
1.072 |
0.9905 |
0–1 |
53.046 |
4.1526 |
0.7788 |
| Hexaflumuron |
87.23 |
1.417 |
0.9956 |
0–1 |
54.683 |
4.7532 |
0.8583 |
| Flufenoxuron |
90.92 |
1.064 |
0.9941 |
0–1 |
60.361 |
4.9976 |
0.8326 |
| Clorfluazuron |
94.73 |
0.856 |
0.9956 |
0–1 |
62.791 |
4.8816 |
0.7929 |
| Teflubenzuron |
92.14 |
1.148 |
0.9967 |
0–1 |
54.808 |
4.8756 |
0.8077 |
| Lufenuron |
95.75 |
0.916 |
0.9944 |
0–1 |
49.645 |
4.9775 |
0.8266 |
4. Conclusions
In this study, a series of HBPS materials with different end groups were designed and prepared. The materials were applied to the adsorption of BUs and the methods for the determination of adsorption kinetics and adsorption isotherms and quantum mechanical calculations were studied. In this research, the lowest energy stable configuration and the binding energy in different binding configurations were determined. Based on the calculated binding energy, the adsorption mechanism under different binding configurations was analyzed. At the same time, the adsorption kinetics and thermodynamic mechanism of the adsorbent were studied. The adsorption kinetic model was fitted and verified by the quantum chemical results. The BUs adsorption represented by diflubenzuron was discussed. The ability of the insecticide to bind to different terminal functional groups on the hyperbranched polymer structure and the binding mechanism were evaluated. In the future research, the method can be used to calculate and screen the target analyte and the selected adsorbent first, and then study the adsorption effect on the basis of the screening results, which can greatly improve the experimental efficiency. Furthermore, the database of the lowest energy binding configuration between the adsorbent and the analyte can be established under the conditions, which provides convenience for the high-throughput screening of adsorbents.
Conflicts of interest
The authors have declared no conflict of interest.
Acknowledgements
The authors greatly appreciate the financial support from National Key R&D Program of China (Project No. 2018YFC1604402) and National Natural Science Foundation of China (Project No. 21677174 and 21507159).
References
- M. D. Gil-García, M. Martínez-Galera, T. López-López, J. L. Martínez-Vidal, M. C. Mahedero and F. Salinas, Talanta, 2001, 53, 915–925 CrossRef.
- F. Matsumura, Pestic. Biochem. Physiol., 2010, 97, 133–139 CrossRef CAS.
- M. D. Gil García, M. Martínez Galera, D. Barranco Martínez and J. Gisbert Gallego, J. Chromatogr. A, 2006, 1103, 271–277 CrossRef PubMed.
- EU Pesticides database, 2018, available online, http://ec.europa.eu/food/plant/pesticides/eu-pesticides-database/public/?event=homepage%26language=EN, accessed, September 25, 2019.
- Z. Żołek-Tryznowska and J. Izdebska, Compos. Interfaces, 2012, 19, 441–451 CrossRef.
- P. B. Pirozhnikov, I. V. Korolev, N. G. Kuzina and L. N. Mashlyakovskii, Russ. J. Appl. Chem., 2013, 86, 1549–1562 CrossRef CAS.
- Y. K. Jeong, T.-w. Kwon, I. Lee, T.-S. Kim, A. Coskun and J. W. Choi, Nano Lett., 2014, 14, 864–870 CrossRef CAS PubMed.
- X. Chen, S. G. Parker, G. Zou, W. Su and Q. Zhang, ACS Nano, 2010, 4, 6387–6394 CrossRef CAS PubMed.
- C. Aydogan, G. Yilmaz and Y. Yagci, Macromolecules, 2017, 50, 9115–9120 CrossRef CAS.
- H. Wang, Z. Wang, R. Yue, F. Gao, R. Ren, J. Wei, X. Wang and Z. Kong, J. Hazard. Mater., 2020, 384, 121288 CrossRef CAS PubMed.
- S. Grimme, J. Comput. Chem., 2004, 25, 1463–1473 CrossRef CAS PubMed.
- S. Grimme, S. Ehrlich and L. Goerigk, J. Comput. Chem., 2011, 32, 1456–1465 CrossRef CAS PubMed.
- U. Domańska and Z. Żołek-Tryznowska, J. Chem. Thermodyn., 2009, 41, 821–828 CrossRef.
- X. Wu, M. C. Vargas, S. Nayak, V. Lotrich and G. Scoles, J. Chem. Phys., 2001, 115, 8748–8757 CrossRef CAS.
- T. Mueller and G. Ceder, J. Phys. Chem. B, 2005, 109, 17974–17983 CrossRef CAS PubMed.
- J. Pang, Y. Liao, X. Huang, Z. Ye and D. Yuan, Talanta, 2019, 199, 499–506 CrossRef CAS PubMed.
- C. Gao and D. Yan, Prog. Polym. Sci., 2004, 29, 183–275 CrossRef CAS.
- D. Muscat and R. A. T. M. van Benthem, in Dendrimers III: Design, Dimension, Function, ed. F. Vögtle, Springer Berlin Heidelberg, Berlin, Heidelberg, 2001, pp. 41–80 Search PubMed.
- G. M. Dykes, J. Chem. Technol. Biotechnol., 2001, 76, 903–918 CrossRef CAS.
- H. Wang, Q. Xu, J. Wang, W. Du, F. Liu and X. Hu, Biosens. Bioelectron., 2018, 100, 105–114 CrossRef CAS PubMed.
- L. Chen, Q. Wang, R. Huang, C. Mao, J. Shang and F. Bi, J. Agric. Food Chem., 2005, 53, 38–41 CrossRef CAS PubMed.
- W. Lu, J. Li, Y. Sheng, X. Zhang, J. You and L. Chen, J. Colloid Interface Sci., 2017, 505, 1134–1146 CrossRef CAS PubMed.
- H. Liu, K. Tian, J. Ning, Y. Zhong and Y. Hu, ACS Catal., 2019, 9, 1211–1219 CrossRef CAS.
- J. Li, R. Dong, X. Wang, H. Xiong, S. Xu, D. Shen, X. Song and L. Chen, RSC Adv., 2015, 5, 10611–10618 RSC.
- G. Wu, J. Ma, S. Li, J. Guan, B. Jiang, L. Wang, J. Li, X. Wang and L. Chen, J. Colloid Interface Sci., 2018, 528, 360–371 CrossRef CAS PubMed.
- H. Zhang, C. Guo, J. Ren, J. Ning, Y. Zhong, Z. Zhang and Y. Hu, Chem. Commun., 2019, 55, 14050–14053 RSC.
- X. Cai, J. Li, Z. Zhang, F. Yang, R. Dong and L. Chen, ACS Appl. Mater. Interfaces, 2014, 6, 305–313 CrossRef CAS PubMed.
- Q. Kong, J. Wei, Y. Hu and C. Wei, J. Hazard. Mater., 2019, 363, 161–169 CrossRef CAS PubMed.
- Y. Wu, E. Hu, W. Dai, Z. Li, Y. Zhong and Y. Hu, RSC Adv., 2017, 7, 5093 RSC.
- G. Wu, J. Ma, S. Li, S. Wang, B. Jiang, S. Luo, J. Li, X. Wang, Y. Guan and L. Chen, Environ. Res., 2020, 186, 109542 CrossRef CAS PubMed.
- G. Wu, J. Ma, S. Wang, H. Chai, L. Guo, J. Li, A. Ostovan, Y. Guan and L. Chen, J. Hazard. Mater., 2020, 394, 122556 CrossRef CAS PubMed.
- H. Wang, L. Hu, W. Li, R. Lu, S. Zhang, W. Zhou and H. Gao, J. Chromatogr. A, 2016, 1471, 60–67 CrossRef CAS PubMed.
Footnote |
| † Chaoran Liu and Xiaodong Huang contributed equally to this work. |
|
| This journal is © The Royal Society of Chemistry 2020 |
Click here to see how this site uses Cookies. View our privacy policy here. 
 Open Access Article
 This Open Access Article is licensed under a Creative Commons Attribution-Non Commercial 3.0 Unported Licence
 b,
Haixiang Gao
b,
Haixiang Gao