 Open Access Article
Performance and mechanism of methylene blue degradation by an electrochemical process
Xiaolei Tenga,
Junfeng Li *a,
Zhaoyang Wang*bc,
Zhen Weia,
Cuizhong Chena,
Keqing Dua,
Chun Zhaoac,
Guang Yanga and
Yun Lid
aSchool of Water Conservancy and Architectural Engineering, Shihezi University, Shihezi 8320000, PR China. E-mail: ljfshz@126.com
bCollege of Earth and Environmental Science, Lanzhou University, Lanzhou 730000, PR China. E-mail: wangzhaoyanghit@126.om
cSchool of Urban Construction and Environmental Engineering, Chongqing University, Chongqing 400001, PR China
dWater Administration and Water Resources Management Office, Hali Barikun County 839200, PR China
First published on 29th June 2020
Abstract
An exciting electrochemical oxidation (EO) process has been developed. Compared with electro-Fenton (EF) and electro-coagulation (EC) processes, this process had more advantages in the degradation of methylene blue. It is observed that methylene blue can be quickly degraded by EO, in which an iron rod is used as an anode, graphite is used as a cathode, and fly ash–red mud particles are used as particle electrodes. Compared to EC and EF processes that are affected by specific pH values, EO has excellent performance in the pH range of 3.0–11.0. In addition, the electric energy consumption (EEC) of EF, EC and EO is 81.51, 36.55 and 21.35 kW h m−3 respectively, suggesting EO is more economical. The free radical scavenging mechanism of i-PrOH is studied, and the contribution of EC, EF and fly ash–red mud particle electrodes in EO is inferred. Particle electrodes before and after use are characterized by SEM, EDS and BET to illustrate the role of particle electrodes in the EO system. Analysis of flocs and solutions by FTIR and GC-MS proves that EO can effectively degrade methylene blue, and the degradation route of methylene blue is speculated. The particle electrode dissolution experiment shows that the prepared fly ash–red mud particle electrode is considered to be suitable and safe for wastewater treatment. Finally, in actual surface water experiments, the EO process still has great potential.
1 Introduction
With the rapid development of industry, the impact of difficult-to-treat organic pollutants on the environment has become more and more serious.1,2 These organic pollutants will cause serious pollution to surface water and groundwater.3 Nowadays, removal of dye molecules from water sources has not only become a major environmental concern but also a challenge.3 Techniques of recovering and reusing dye wastewater received attention recently as clean water sources might soon begin to deplete rapidly if no dependable solution is found. Developing a fixed solution to permanently eliminate dye particles from textile effluents would greatly benefit the environment.4,5Currently, there are many techniques for dye decolorization, for example, adsorption, biological, photochemical, ozonation, Fenton reaction, etc. However, these methods some disadvantages.6 Such as, for adsorption, non-selective method, economically non-viable for certain industries (pulp and paper, textile, etc.);4 biological methods need to be carried out in an enabling environment;7 photochemical methods are expensive and form a lot of by-products;8 the by-products formed by ozonation increase the toxicity of the formulation;9 the Fenton reaction requires a large amount of H2O2 and is only suitable for low pH.10
In recent years, the electrochemical advanced oxidation process (EAOPs) have been considered as an alternative technology for degradable organic pollutants due to its advantages such as environmental friendly, operate easily and highly effective.11,12 Among electrochemical advanced oxidation processes, electrocoagulation (EC),13 anodic oxidation (AO),14 electro-Fenton (EF),15 and three-dimensional electro-Fenton16 are widely studied.
In the electric-Fenton system, hydrogen peroxide is produced by electrochemical reduction of oxygen at the cathode (eqn (1)). Then hydrogen peroxide reacts with Fe2+ added to the solution to form strong oxidizing hydroxyl radicals (eqn (2)). Refractory organic pollutants are easily mineralized or degraded, after being attacked by hydroxyl radicals.17 But the electric-Fenton system still has some disadvantages. Iron ions containing sludge are expensive to treat at the end of wastewater treatment, requiring a large amount of chemical reagents and manpower.18 And its pH value is significant only at pH 2–3.19,20 Therefore, a more friendly EF system is needed to degrade wastewater.
| O2 + 2H+ + 2e− → H2O2 | (1) |
| Fe2+ + H2O2 → OH− + Fe2+ + ·OH | (2) |
Electrocoagulation is an emerging method dealing with suspended particles removal from wastewater by destabilization reaction of colloidal particles using in situ generated coagulants.13 These coagulants are manufactured by electrolytic oxidation of soluble anode materials. Due to its low cost, metallic iron and aluminum are the most widely used anode materials.21 However, EC technology also has problems such as high energy consumption and fast electrode consumption, which seriously affected its promotion in practice.22
The three-dimensional electrode is a kind of electrochemical oxidation technology to increase electrode surface area by adding particle electrode. Due to the addition of particle electrodes, the specific surface area of the three-dimensional electrode is greatly increased, and the electrochemical reaction rate is accelerated.23 The particle gap is small, so that the moving speed of the material is increased, thereby improving current efficiency and processing effect.24 At present, the three-dimensional electrode method has been applied in various wastewater treatments, and has achieved good results.25–27
An electrochemical oxidation (EO) process is proposed, which is a combination of EF, EC and the three-dimensional particle electrodes. The Fe2+ produced by the Fe anode and reacts with the H2O2 produced in reaction (1) to form a saturated Fe3+ solution, and then the excessive Fe3+ is precipitated as Fe(OH)3. Then, the target pollutants can be effectively removed by the combined action of the coagulation with the formed Fe(OH)3 precipitate and the generated OH.28 The particle electrode is filled into the system, and the two ends near the electrode are respectively charged with positive and negative charges. In this way, each particle is a micro-electrolysis cell, so that the area of the electrochemical reaction in the system is increased, and the effect of removing the wastewater is improved. It is worth noting that there are currently few reports on the treatment of organic pollutant wastewater by EO, which shows higher efficiency than EC and EF. In the EO, the effect of particle electrode on the treatment effect cannot be ignored.29,30 The particle electrodes are manufactured by using fly ash and red mud as raw materials. This method not only reduces the cost of wastewater treatment, but also reflects the concept of “treating waste with waste”.
In this study, EF, EC and EO methods are used to degrade the simulated pollutant methylene blue under laboratory conditions. Effects of voltage and pH on the removal efficiency of methylene blue in EO system are investigated. The contribution of EF, EC and three-dimensional electrodes in the EO is discussed. Particle electrodes before and after use are characterized to illustrate the role of particle electrodes in the EO system. And a degradation route of methylene blue is speculated. Particle electrode dissolution experiments are also tested. Finally, the degradation effect of particle electrode in actual surface water is studied.
2 Materials and methods
2.1 Chemicals and materials
Methylene blue was supplied by Tianjin Beilian Fine Chemicals Development Co., Ltd, China. Sulfuric acid (H2SO4), anhydrous sodium sulfate (Na2SO4), sodium hydroxide (NaOH), ferrous sulfate heptahydrate (FeSO4·7H2O), and isopropanol (i-PrOH) were received from Tianjin Oushengao Chemical Reagent Co., Ltd, China. The graphite rod and stainless steel were supplied by Shanghai Chuxi industry Co., Ltd and used for electrode materials. Fly ash was obtained from South Thermal Power Plant, Shihezi, red mud was provided for Jinan Mining Development Company, used as the main raw material for the preparation of particle electrodes. All solutions were prepared with deionized water.The fabrication method of the particle electrode: fly ash, red mud, montmorillonite and anhydrous sodium bicarbonate was mixed into distilled water with a weight ratio of 4![[thin space (1/6-em)]](https://www.rsc.org/images/entities/char_2009.gif) :
:![[thin space (1/6-em)]](https://www.rsc.org/images/entities/char_2009.gif) 2
2![[thin space (1/6-em)]](https://www.rsc.org/images/entities/char_2009.gif) :
:![[thin space (1/6-em)]](https://www.rsc.org/images/entities/char_2009.gif) 1
1![[thin space (1/6-em)]](https://www.rsc.org/images/entities/char_2009.gif) :
:![[thin space (1/6-em)]](https://www.rsc.org/images/entities/char_2009.gif) 1. The mixture was knead muffle furnace using programmed heating. The particles were heated into particles with a diameter of 3–10 mm, and then placed in the at normal temperature conditions 10 °C min−1 to 400 °C, heated preservation 30 min, and then heated 10 °C/min−1 to 860 °C, heated preservation 90 min.
1. The mixture was knead muffle furnace using programmed heating. The particles were heated into particles with a diameter of 3–10 mm, and then placed in the at normal temperature conditions 10 °C min−1 to 400 °C, heated preservation 30 min, and then heated 10 °C/min−1 to 860 °C, heated preservation 90 min.
2.2 Electrochemical system
The experiment was performed in a 250 mL beaker. For the EF experiments, the anode was a graphite rod electrode (0.6 cm × 12 cm), and the cathode was an iron rod electrode (0.6 cm × 12 cm). For the EC experiments, the anode was an iron rod electrode (0.6 cm × 12 cm), and the cathode was a graphite rod electrode (0.6 cm × 12 cm). For the EO trials, the selected electrode material was the same as electrocoagulation, except that the fly ash–red mud particle electrode (100 g L−1) was added to it.0.1 M Na2SO4 was used as the supporting electrolyte and added to a methylene blue solution with an initial concentration of 10 mg L−1. Diluted H2SO4 and NaOH solution were added to adjust the pH value of the solutions. And then 200 mL solution was operated under desired voltage. The cathode and anode were immersed in the methylene blue solution to a depth of 6 cm, and the distance between the two electrodes was 4 cm. The particle electrodes had reached adsorption saturation before the electrolytic test to avoid affecting the test. The above experiments were carried out under normal temperature conditions.
2.3 Analytical methods
The decolorization rate of methylene blue was analyzed by 664 nm wavelengths of ultraviolet visible spectrophotometer (DR6000). The removal of methylene blue by EF, EC and EO can be well fitted by a pseudo-first order rate (eqn (3)), where k is the pseudo-first-order rate constants of methylene blue removal.
 | (3) |
The electric energy consumption (EEC) is an important indicator that can provide preliminary information about energy consumption during processing. Eqn (4) is used to calculate the EEC:31
 | (4) |
2.4 Characterization
The flocs after the electroflocculation treatment were collected and measured by FTIR using a Thermo Nicolet 6700. Morphological and elemental analysis of the particle electrode was performed by Scanning Electron Microscopy (SEM) and Energy Dispersive X-ray Spectroscopy (EDS) (FEI Quanta 650, FEI Company, U. S. A.) analysis. The particle electrode's BET surface area was performed on Asap2020 micropore physics.The intermediates of EO treated methylene blue solution was identified by Agilent GC-MS system (Agilent 7890B-5977B-GC/MS). Prior to GC-MS analysis, the 10 mL sample solution was placed in a 15 mL headspace bottle. The aged 100 μm PDMS extraction head was inserted into the headspace of the sample vial and adsorbed at 60 °C for 120 min. After the adsorption, the extraction head was taken out and inserted into the gas chromatograph. The sample was desorbed at 250 °C for 3 min. The GC-MS was equipped with a DB-5MS (30 mm × 250 mm × 0.25 μm), and the GC column was operated in a temperature programmed mode at 60 °C for 1 min, raised to 200 °C at 12 °C min−1, and then raised to 325 °C at 5 °C min−1, and finally held at 325 °C for 8 min.
To inspect the safety of fly ash–red mud particle electrode for water treatment, lixivium of fly ash–red mud particle electrode was also examined for several metal elements. According to HJ/T299-2007, China (solid waste – extraction procedure for leaching toxicity – sulphuric acid and nitric acid method), the leachate test was done as follows: 150 g fly ash–red mud particle electrode was extracted with 1.5 L sulphuric acid and nitric acid solution (solid![[thin space (1/6-em)]](https://www.rsc.org/images/entities/char_2009.gif) :
:![[thin space (1/6-em)]](https://www.rsc.org/images/entities/char_2009.gif) liquid = 1
liquid = 1![[thin space (1/6-em)]](https://www.rsc.org/images/entities/char_2009.gif) :
:![[thin space (1/6-em)]](https://www.rsc.org/images/entities/char_2009.gif) 10, pH 3.20) shaking for 18 h at 30 rpm. And then, the concentration of heavy metals in the leaching solution was measured using an inductively coupled plasma spectrometer (Optima 7000).
10, pH 3.20) shaking for 18 h at 30 rpm. And then, the concentration of heavy metals in the leaching solution was measured using an inductively coupled plasma spectrometer (Optima 7000).
3 Results and discussion
3.1 Treatment of methylene blue by EF
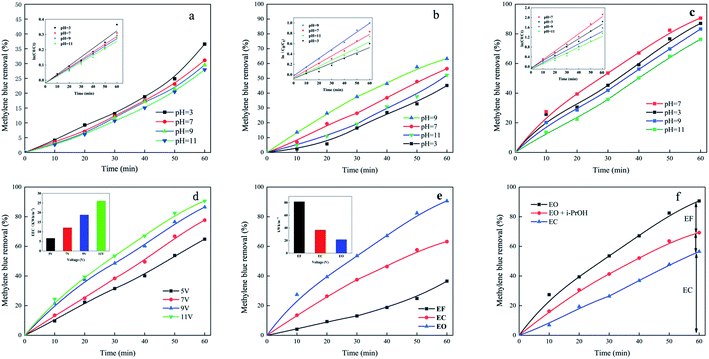
The pH is critical in the electrochemical reactions.32 As shown in Fig. 1a, in the initial pH range select for this test, the removal efficiency of methylene blue from the Fenton system gradually decrease from 36.56% to 27.93% with increasing initial pH. From the inset in Fig. 1a, it can be found that the EF system follows pseudo first-order kinetics. When the initial pH is increased from 3 to 11, the values of k decrease progressively from 0.57 to 0.46 min−1. This also confirms that the optimal pH of the EF system is about 3.33 In solution, different values of pH determine different forms of iron speciation. At pH = 3, Fe2+ in the solution can react with H2O2 to form ·OH (eqn (1) and (2)). However, when the pH is greater than 4, it is difficult for Fe2+/Fe3+ and H2O2 to generate free radicals, and iron ions will be converted into ferric hydroxides.34,353.2 Treatment of methylene blue by EC
From the inset in Fig. 1b, it can be found that the EC system follows pseudo first-order kinetics. Fig. 1b depicts that the methylene blue dye wastewater has a good decolorization effect under neutral or alkaline conditions, and the highest decolorization rate is 63.24% at pH = 9. This is because under neutral conditions, the metal cations produced by electrolysis are more easily hydrolyzed to form iron hydroxide flocs.36 Although methylene blue is a cationic basic dye, it generally exhibits a cationic state after being dissolved in water, and the iron hydroxide floc is positively charged.37,38 The dye molecules are adsorbed because the abundant H atoms in the surface hydroxyl groups are more likely to hydrogen bond with the N atoms with stronger electronegativity in the dye molecules. Under the condition of pH = 11, mainly Fe(OH)4− and Fe(OH)63− are produced in the system.39 Under acidic conditions, the formation of Fe(OH)3 and Fe(OH)2 flocs is poor because H+ in the solution neutralizes the OH− formed on the cathode.40 During the electrochemical degradation test, dark green flocs and bubbles are produced, which may occur in two electrochemical reactions:First reaction
| Anode: 2Fe − 4e− → 2Fe2+(aq) | (5) |
| 2Fe2+(aq) + 5H2O(aq) + 1/2O2(g) → 2Fe(OH)3(s) + 4H+(aq) | (6) |
| Cathode: 4H+(aq) + 4e− → 2H2(g) | (7) |
Another reaction
| Anode: Fe − 2e− → Fe2+(aq) | (8) |
| Fe2+(aq) + 2OH−(aq) → Fe(OH)2(s) | (9) |
| Cathode: 2H2O(aq) + 2e− → H2(g) + 2OH−(aq) | (10) |
After the above reaction, ferrous hydroxide and ferric hydroxide floc are formed, and methylene blue is removed by adsorption bridging or complexation. In addition, there may be a competitive oxygen evolution reaction at the anode accompanied by oxidation of water, and the reaction mainly exists in the electric-like Fenton process:41
| Anode: Fe − 2e− → Fe2+(aq) | (11) |
| Cathode: O2(g) + 2H2O + 2e− → H2O2(aq) + 2OH−(aq) | (12) |
| H2O2(aq) + Fe2+ → Fe3+ + OH−(aq) + ·OH | (13) |
3.3 Treatment of methylene blue by EO
3.4 Comparative removal by EF, EC and EO system
The removal of methylene blue by three electrochemical processes is compared under their optimum conditions. During EF, methylene blue is removed because of the OH attack in the solution. The EC system had both the action of ·OH and the adsorption of methylene blue by the generated Fe(OH)3 floes. As can be seen from Fig. 1e, EO had a more obvious advantage in removing methylene blue. That is because the particle electrodes are polarized under the electric field in the three-dimensional electrode cell, and each packed particle is equivalent to a micro-electrolysis cell, which could complete the electrochemical oxidation reaction independently. Innumerable microelectrolysis cells are combined to effectively increase the area of the three-dimensional electrolytic cell. On the surface of the particle electrode, the organic matter is directly oxidized and decomposed, which effectively increased the electrolysis area of the electrode, and the electron migration distance is greatly shortened, thereby accelerating the mass transfer rate.46,47 In addition, the particle electrode in the three-dimensional electrode can also accelerate the rate of cathode H2O2 production and diffusion, so that H2O2 react rapidly with Fe2+ to produce ·OH, ·OH rapidly degrade organic pollutants into carbon dioxide and water. Therefore, in the process of electrocatalytic degradation of the three-dimensional electrode, the organic matter is rapidly degraded, and the electrolysis efficiency is remarkably improved.48,49 Comparison of energy consumption of three electrochemical methods, the energy consumption in the EF system is the highest, and the energy consumption in the EO system is the lowest (inset Fig. 1e).3.5 Possible contribution of each process
To explore different process mechanisms, three systems are investigated, namely, EC, EO and EO + i-PrOH systems. In order to test the contribution of ·OH radicals to the system, experiments are performed with the addition of i-PrOH. In Fig. 1f, the EC removal effect is 56.49%, the EO removal effect is 86.46%, and the EO + i-PrOH removal effect is 69.22%. It can be inferred that the EF removal effect is about 17.24%. The difference between the EO + i-PrOH and the EC system is about 12.73%, and it is speculated that this difference is the contribution of the particle electrodes. The above analysis indicate that EC and EF play a major role in the EO system, but the role of particle electrodes in the system cannot be ignored.3.6 Characterization of the electrode before and after use of the particles
The particle morphology and element composition before and after use are shown in Fig. 2. Fig. 2a and b are unused particle electrodes. A large number of small pores are distributed on the surface of the particle electrodes. These pores increase the specific surface area of the particle electrode. On the other hand, the active groups on the surface of the particle electrodes can adsorb and remove organic matter. Fig. 2d and e are the particle electrodes after being used. Compared with Fig. 2a and b, it can be seen that the surface of the particle electrode is reduced, and some particles are adhered to the surface. Compared with Fig. 2c, the elements in Fig. 2f are significantly more Cl, S, N, which also confirms that the adsorption of methylene blue by the particle electrodes. This indicate that particle electrodes as a kind of bipolar polar particles, the process of removing organic matter in three-dimensional electrochemistry is: adsorption-electrolysis-resorption-reelectrolysis-process.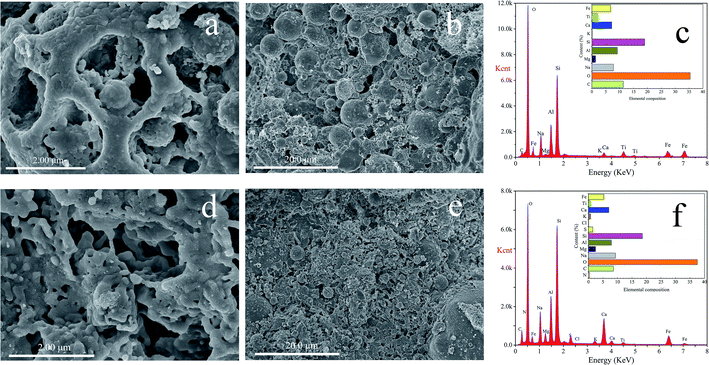 | ||
| Fig. 2 SEM images of the particle electrode, (a), (b) and (c) before used, (d), (e) and (f) after used. | ||
The specific surface areas of the particle electrodes before and after use are 54.2266 m2 g−1 and 45.2958 m2 g−1, respectively. Fig. 3a is the pore size distribution curve of the test sample, and Fig. 3b is the N2 adsorption–desorption isotherm of the test sample. It can be seen from the pore size distribution in Fig. 3a that the particle electrode is a mesoporous structure. The comparison of particle electrodes before and after use is consistent with the results of SEM characterization. According to the IUPAC classification, it can be seen from Fig. 3b that the adsorption–desorption curve of this sample is a typical IV curve with a narrow adsorption hysteresis loop and belongs to the H3 hysteresis loop.50
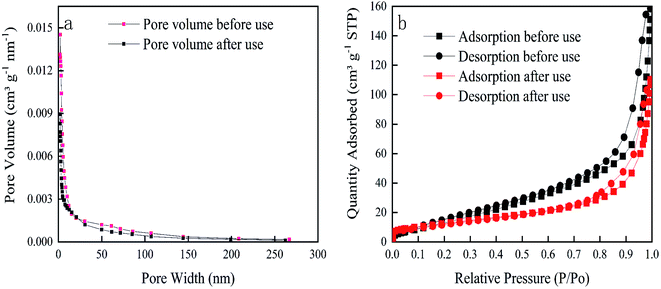 | ||
| Fig. 3 BET characterization data (a) pore-size distribution curves of particle electrodes (b) N2 adsorption–desorption isotherms. | ||
3.7 Analysis of degradation mechanism of methylene blue
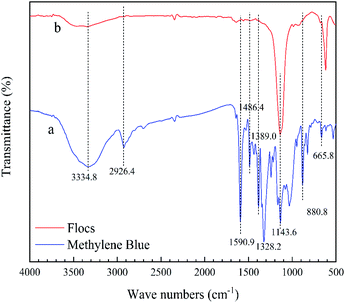
In Fig. 4, the flocs obtained after methylene blue wastewater treatment are measured by infrared spectrometer. The infrared spectrum of methylene blue powder is shown in Fig. 4a. The absorption peak near 3334.8 cm−1 belongs to the stretching vibration of the O–H bond in the water molecule. This is because the sample is wet during the measurement, so that a small amount of water is added to the sample. The strong absorption peak at 2926.4 cm−1 belongs to C–H stretching vibration in methylene. The strong absorption peak at 1590.9 cm−1 belongs to the skeleton stretching vibration of the benzene ring; the absorption peaks at 1486.4 cm−1 and 1389.0 cm−1 belong to the stretching vibration of C–N in aromatic amines; a series of absorption peaks near 1143.6 cm−1 are the stretching vibration of C–N in the aliphatic chain; the split peak near 1328.2 cm−1 belongs to the asymmetric and symmetric stretching vibration of –CH3; the peak at 880.8 cm−1 is attributed to the characteristic absorption of C–H in-plane bending vibration; the characteristic absorption peak near 665.8 cm−1 is mainly the skeleton vibration mode of C–S–C.51After treating the methylene blue wastewater with EO, the infrared spectrum of the flocs is obtained, in Fig. 4b. It is apparent from the spectrum that the vibrational absorption peak of the C–S–C framework is changed, the characteristic absorption wave number is shifted, and the vibration intensity is increased. The tensile vibration of C–N in the aliphatic chain near 1143.6 cm−1 is enhanced. Thereby inferring that the floc adsorbs a certain amount of degraded organic molecules. In addition, the remaining peaks are significantly reduced. During the bombardment of the radical species, the remaining organics have been completely cracked.
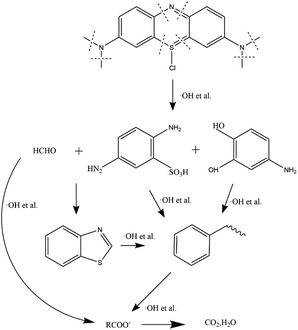
In Fig. 5, GC-MS detection results indicate the presence of benzothiazole in the solution. Analysis of flocs and solutions by FTIR and GC-MS proves that the EO can effectively remove methylene blue, and the degradation route of methylene blue is speculated, as shown in Fig. 6. When methylene blue molecules are dissolved in water, Cl− is separated first. During the bombardment of the radical species, the N–CH3 bond is first broken and the –CH3 is oxidized into HCHO or HCOOH.52,53 C–S and C–N on the central heterocycle of methylene blue are easily broken by free radical attack to produce the 2,5-diaminobenzenesulfonic acid and 4-aminocatechol.53 And then, the benzothiazole is generated from 2,5-diaminobenzenesulfonic acid and formaldehyde. Eventually, these intermediates are oxidized to a single ring structure, and finally to CO2 and H2O.
3.8 Leachability of metals from the particle electrodes
Leachability test is performed to provide information on the safety of the particle electrode. The experimental results are shown in Table 1, where it can be seen that all heavy metal contents in lixivium were much lower than thresholds determined by GB 5085.3-2007, China. This also verifies that the particle electrode has a stable structure. Thus, it is considered suitable and safe for fly ash–red mud particle electrode to be applied in wastewater treatment. But if used in drinking water treatment, it should be considered very carefully.| Heavy metal | Cu | Zn | Cd | Ba | Pb | Cr | Hg | As |
|---|---|---|---|---|---|---|---|---|
| Concentrations | 0.027 | 0.023 | 0.0035 | 0.032 | 0.059 | 0.014 | 0 | 0.011 |
| Thresholds | 100 | 100 | 1 | 100 | 5 | 15 | 0.1 | 5 |
3.9 Removal of methylene blue in real wastewater
It is a final goal that uses the EO system in real wastewater treatment. Therefore, experiments are conducted under the real surface water matrix. It is observed from Fig. 7 that for EO and EC systems, the removal rates are reduced by 18.84% and 10.13%, respectively. An important reason is the complicated components contained in real water sample, which included natural organic matter and inorganic anions. These substances can react with reactive free radicals through the electron transfer mechanism and compete with methylene blue.54 It also reflects that more active substances in the EO system. The EO system under the real surface water matrix is still superior to the EC system. In practical applications, the voltage can be increased appropriately to increase the removal rate. In brief, the EO system exhibited outstanding removal performances in both test samples.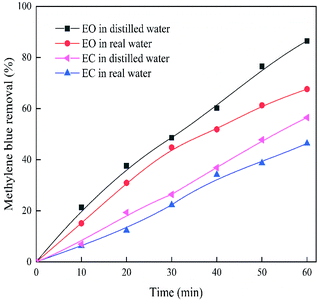 | ||
| Fig. 7 Removal rate of methylene blue by EO and EC system in real surface water. Conditions: methylene blue 10 mg L−1, 0.1 M Na2SO4, voltage 9 V, pH 7. | ||
4 Conclusions
Developed a highly efficient EO process to remove dye wastewater. Compared with EC and EF, EO are more efficient in terms of removal efficiency and energy consumption, which may be the reason for the combined action of ·OH, Fe3+ flocculation and fly ash–red mud particle electrodes. The EO process maintains excellent processing over a wide pH range. Under the optimal conditions, the removal efficiency reached 86.46% under the conditions of pH 7, voltage 9 V and initial methylene blue concentration of 10 mg L−1. By comparing the three systems, analysis of flocs and solutions by FTIR and GC-MS and characterization of the particle electrodes before and after use, it is presumed that EO combines the oxidation of ·OH in EF, electrocoagulation in EC and oxidation of target pollutants by particle electrodes. And the pathway of EO degradation of methylene blue is speculated. The particle electrode dissolution experiment shows that the prepared fly ash–red mud particle electrode is considered to be suitable and safe for wastewater treatment. Finally, in actual surface water experiments, the EO process still has great potential. In conclusion, the EO process effectively treats wastewater with the concept of “treating waste with waste”.Conflicts of interest
The authors declare that they have no conflict of interest.Acknowledgements
Financial support from the Natural Science Foundation of China (Grant no. 21906011, U1803244), the Postdoctoral Science Foundation of China (Grant no. 2018M643412) and the National Key R&D Plan (2017YFC0404303, 2017YFC0404304).References
- J. Li, Y. J. Li, Z. K. Xiong, G. Yao and B. Lai, Chin. Chem. Lett., 2019, 30, 2139–2146 CrossRef CAS
.
- X. Zhang, J. Wang, X. X. Dong and Y. K. Lv, Chemosphere, 2020, 242 DOI:10.1016/j.chemosphere.2019.125144
.
- C. R. Holkar, A. J. Jadhav, D. V. Pinjari, N. M. Mahamuni and A. B. Pandit, J. Environ. Manage., 2016, 182, 351–366 CrossRef CAS PubMed
.
- V. Katheresan, J. Kansedo and S. Y. Lau, J. Environ. Eng., 2018, 6, 4676–4697 CAS
.
- J. Wang, L. Qin, J. Lin, J. Zhu, Y. Zhang, J. Liu and B. Van der Bruggen, Chem. Eng. J., 2017, 323, 56–63 CrossRef CAS
.
- G. Crini and E. Lichtfouse, Environ. Chem. Lett., 2019, 17, 145–155 CrossRef CAS
.
- F. G. Babuna, S. Camur, I. A. Alaton, O. Okay and G. Iskender, Desalination, 2009, 249, 682–686 CrossRef
.
- Y. C. Ye, H. Yang, X. X. Wang and W. J. Feng, Mater. Sci. Semicond. Process., 2018, 82, 14–24 CrossRef CAS
.
- H. Zhang, Y. L. He, L. D. Lai, G. Yao and B. Lai, Sep. Purif. Technol., 2020, 245 DOI:10.1016/j.seppur.2019.116449
.
- L. Lyu, L. Zhang, C. Hu and M. Yang, J. Mater. Chem., 2016, 4, 8610–8619 RSC
.
- J. F. Qu, T. H. Che, L. B. Shi, Q. H. Lu and S. T. Qi, Chin. Chem. Lett., 2019, 30, 1198–1203 CrossRef CAS
.
- I. Oller, S. Malato and J. A. Sanchez-Perez, Sci. Total Environ., 2011, 409, 4141–4166 CrossRef CAS PubMed
.
- H. Zazou, H. Afanga, S. Akhouairi, H. Ouchtak, A. A. Addi, R. A. Akbour, A. Assabbane, J. Douch, A. Elmchaouri, J. Duplay, A. Jada and M. Hamdani, J. Water Process Eng., 2019, 28, 214–221 CrossRef
.
- S. Dbira, N. Bensalah, M. I. Ahmad and A. Bedoui, Materials, 2019, 12 DOI:10.3390/ma12081254
.
- B. Shen, C. C. Dong, J. H. Ji, M. Y. Xing and J. L. Zhang, Chin. Chem. Lett., 2019, 30, 2205–2210 CrossRef CAS
.
- W. Liu, Z. H. Ai and L. Z. Zhang, J. Hazard. Mater., 2012, 243, 257–264 CrossRef CAS PubMed
.
- P. V. Nidheesh and R. Gandhimathi, Desalination, 2012, 299, 1–15 CrossRef CAS
.
- J. H. Ramirez, C. A. Costa, L. M. Madeira, G. Mata, M. A. Vicente, M. L. Rojas-Cervantes, A. J. Lopez-Peinado and R. M. Martin-Aranda, Appl. Catal., B, 2007, 71, 44–56 CrossRef CAS
.
- J. H. Deng, J. Y. Jiang, Y. Y. Zhang, X. P. Lin, C. M. Du and Y. Xiong, Appl. Catal., B, 2008, 84, 468–473 CrossRef CAS
.
- X. M. Chen, D. R. da Silva and C. A. Martinez-Huitle, Chin. Chem. Lett., 2010, 21, 101–104 CrossRef CAS
.
- F. Ilhan, U. Kurt, O. Apaydin and M. T. Gonullu, J. Hazard. Mater., 2008, 154, 381–389 CrossRef CAS PubMed
.
- P. P. Song, Z. H. Yang, G. M. Zeng, X. Yang, H. Y. Xu, L. K. Wang, R. Xu, W. P. Xiong and K. Ahmad, Chem. Eng. J., 2017, 317, 707–725 CrossRef CAS
.
- E. Fockedey and A. Van Lierde, Water Res., 2002, 36, 4169–4175 CrossRef CAS PubMed
.
- B. L. Hou, H. J. Han, S. Y. Jia, H. F. Zhuang, P. Xu and K. Li, J. Taiwan Inst. Chem. Eng., 2016, 60, 352–360 CrossRef CAS
.
- M. Sun, Y. Zhang, S. Y. Kong, L. F. Zhai and S. B. Wang, Water Res., 2019, 158, 313–321 CrossRef CAS PubMed
.
- B. G. Zhang, Y. P. Hou, Z. B. Yu, Y. X. Liu, J. Huang, L. Qian and J. H. Xiong, Sep. Purif. Technol., 2019, 210, 60–68 CrossRef CAS
.
- Y. S. Zheng, S. Qiu, F. X. Deng, Y. S. Zhu, G. J. Li and F. Ma, Sep. Purif. Technol., 2019, 224, 463–474 CrossRef CAS
.
- G. B. Ren, M. H. Zhou, P. Su, L. Liang, W. L. Yang and E. Mousset, Chem. Eng. J., 2018, 343, 467–476 CrossRef CAS
.
- Z. Y. Wang, J. Y. Qi, Y. Feng, K. Li and X. Li, Catal. Commun., 2014, 46, 165–168 CrossRef CAS
.
- H. F. Zhuang, S. D. Shan, J. B. Guo, Y. X. Han and C. R. Fang, Environ. Sci. Pollut. Res., 2017, 24, 27136–27144 CrossRef CAS PubMed
.
- X. L. Teng, Z. Y. Wang, X. R. Wu, Y. Jiang, J. F. Li, C. Zhao and X. L. He, Sci. Adv. Mater., 2019, 11, 88–92 CrossRef CAS
.
- H. Ouriache, J. Arrar, A. Namane and F. Bentahar, Chemosphere, 2019, 232, 377–386 CrossRef CAS PubMed
.
- C. C. Su, A. T. Chang, L. M. Bellotindos and M. C. Lu, Sep. Purif. Technol., 2012, 99, 8–13 CrossRef CAS
.
- I. Gulkaya, G. A. Surucu and F. B. Dilek, J. Hazard. Mater., 2006, 136, 763–769 CrossRef CAS PubMed
.
- G. Ren, M. Zhou, P. Su, L. Liang, W. Yang and E. Mousset, Chem. Eng. J., 2018, 343, 467–476 CrossRef CAS
.
- F. Ghanbari and M. Moradi, J. Environ. Eng., 2015, 3, 499–506 CAS
.
- K. Govindan, Y. Oren and M. Noel, Sep. Purif. Technol., 2014, 133, 396–406 CrossRef CAS
.
- A. Samide, B. Tutunaru, C. Tigae, R. Efrem, A. Moanta and M. Dragoi, Environ. Prot. Eng., 2014, 40, 93–104 Search PubMed
.
- C. Gong, Z. Zhang, H. Li, D. Li, B. Wu, Y. Sun and Y. Cheng, J. Hazard. Mater., 2014, 274, 465–472 CrossRef CAS PubMed
.
- C. A. Martinez-Huitle and E. Brillas, Appl. Catal., B, 2009, 87, 105–145 CrossRef CAS
.
- E. Neyens and J. Baeyens, J. Hazard. Mater., 2003, 98, 33–50 CrossRef CAS PubMed
.
- D. G. Bassyouni, H. A. Hamad, E. S. Z. El-Ashtoukhy, N. K. Amin and M. M. Abd El-Latif, J. Hazard. Mater., 2017, 335, 178–187 CrossRef CAS PubMed
.
- B. Boye, M. Marième Dieng and E. Brillas, Electrochim. Acta, 2003, 48, 781–790 CrossRef CAS
.
- S. Garcia-Segura, M. Eiband, J. V. de Melo and C. A. Martinez-Huitle, J. Electroanal. Chem., 2017, 801, 267–299 CrossRef CAS
.
- Z. Qiang, J.-H. Chang and C.-P. Huang, Water Res., 2003, 37, 1308–1319 CrossRef CAS PubMed
.
- A. Fakhri, S. Shahidi, S. Agarwal and V. K. Gupta, Int. J. Electrochem. Sci., 2016, 11, 1530–1540 CAS
.
- W. Q. Sun, Y. J. Sun, K. J. Shah, H. L. Zheng and B. Ma, J. Environ. Manage., 2019, 241, 22–31 CrossRef CAS PubMed
.
- Z. Wang, X. He, J. Li, J. Qi, C. Zhao and G. Yang, J. Ind. Eng. Chem., 2018, 58, 18–23 CrossRef CAS
.
- T. Wang, T. Ma, T. Ge, S. Shi, H. Ji, W. Li and G. Yang, J. Alloys Compd2E, 2018, 750, 428–435 CrossRef CAS
.
- C. B. D. Marien, C. Marchal, A. Koch, D. Robert and P. Drogui, Environ. Sci. Pollut. Res., 2017, 24, 12582–12588 CrossRef CAS PubMed
.
- G. N. Xiao and S. Q. Man, Chem. Phys. Lett., 2007, 447, 305–309 CrossRef CAS
.
- F. M. Huang, L. Chen, H. L. Wang and Z. C. Yan, Chem. Eng. J., 2010, 162, 250–256 CrossRef CAS
.
- P. Song, Z. Yang, G. Zeng, X. Yang, H. Xu, L. Wang, R. Xu, W. Xiong and K. Ahmad, Chem. Eng. J., 2017, 317, 707–725 CrossRef CAS
.
- G. Wen, Z. H. Chen, Q. Q. Wan, D. Zhao, X. Q. Xu, J. Y. Wang, K. Li and T. L. Huang, Chem. Eng. J., 2020, 382 DOI:10.1016/j.cej.2019.123003
.
| This journal is © The Royal Society of Chemistry 2020 |

