
 Open Access Article
 This Open Access Article is licensed under a Creative Commons Attribution-Non Commercial 3.0 Unported Licence
Effect of the polarity of KTa1−xNbxO3 on the dielectric performance of the KTN/PVDF nanocomposites
Jiaqi Linab,
Yang Lia,
Xinmei Liua,
Yuanshuo Lia,
Weijie Zhenga and
Wenlong Yang *a
*a
aDepartment of Applied Science, Harbin University of Science and Technology, Harbin 150080, P. R. China. E-mail: yangwenlong1983@163.co; Tel: +86-451-8639-2428
bKey Laboratory of Engineering Dielectrics and Its Application, Ministry of Education, Harbin University of Science and Technology, Harbin 150080, P. R. China
First published on 13th July 2020
Abstract
KTa1−xNbxO3 with different Ta/Nb ratios (x = 0.15, 0.25, 0.5, 0.75, 0.85) were engineered and prepared by a facile hydrothermal synthesis method to acquire KTN nanoparticles with varied polarity. To investigate the effect of KTN filler with varied polarity on the dielectric performance of polymer matrix composites, KTN/PVDF films were fabricated. The experiment demonstrated the polarity of KTN affected the dielectric performance of the composites. KTa0.5Nb0.5O3 possesses larger polarity with permittivity of 3780 at 1 kHz due to its Curie temperature is closer to room temperature, which contributes 30 wt% doped KTa0.5Nb0.5O3/PVDF composite achieving higher permittivity of 19.5 at 1 kHz than those of the others. Additionally, KTa0.75Nb0.25O3/PVDF composite presents higher breakdown strength than those of the others with an Eb value of 164 kV mm−1 when 20 wt% filler is doped. The significant improved dielectric performance by Ta/Nb ratio engineering has the potential of providing new insight on enhancing the energy storage in ceramic-polymer nanocomposites.
Introduction
Dielectric materials with high dielectric permittivity have attracted more and more attention for their promising application in the fields of microelectronic devices, including gate dielectric, electro-active materials, embedded capacitors, memories, and energy storage devices.1–3 Polymer materials with superior breakdown strength and flexibility are of consideration in the applications of electronic devices, but their dielectric parameters limit the electric application under extreme conditions. To overcome the difficulty, the introduction of high permittivity inorganic nanoparticles into the polymer matrix has been widely adopted. The polymer composites combine both the advantages of organic polymers and inorganic ceramics, which is of significance to acquire dielectric materials with high energy density.4–6 A great deal of attempt has been made in fabricating composites of inorganic nanoparticles and polymer. Yash Thakur designed a nanocomposite of alumina/polyetherimide and demonstrated that dielectric response can be enhanced by the introduction of a small number of low permittivity fillers, which reduced the constraints on the dipole response to the applied electric field.4 Tang et al. fabricated a nanocomposite capacitor with high energy density and fast discharge speed by incorporating high aspect ratio TiO2 nanowires into the PVDF (polyvinylidene fluoride) matrix.7 Hao et al. utilized ultimate sized ferroelectric nanofillers, 6.9 nm BaTiO3 nanocrystals to synthesize BaTiO3/PVDF-HFP to impede the deterioration of energy density via enhancing both the high dielectric permittivity and breakdown strength.8 Moharana et al. employed the method of surface hydroxylation treatment to modify Na0.5Bi0.5TiO3 and improved the dielectric properties of h-NBT/PVDF composites.9 Luo et al. synthesized Ag-deposited BaTiO3 particles for PVDF composites to create an interfacial electrical double layer around Ag nanoparticle, which reinforced the interface polarization and improved dielectric permittivity of the composites.10 The majority of current research has been focusing on the effect of the filler's nanosize, morphology, doped content, modification method on the dielectric properties of the composites, for which demonstrate that the varied polarization characteristics of polar and non-polar ceramic fillers achieved the distinction of the dielectric performance of the composites. Nevertheless, the effect of the polarity of identical ceramic fillers on the dielectric properties of the composites has been barely investigated. And it is inevitably requested to further explore the functional mechanism of the fillers polarization characteristics on the dielectric performance of the composites.In this contribution, we place emphasis on the effect of the polarity of identical ceramic fillers on the dielectric properties of nanocomposites. As a typical ABO3 perovskite ferroelectric material, potassium tantalite-niobate (KTa1−xNbxO3, KTN) is widely used due to its remarkable piezoelectric, acoustic-optic, and nonlinear optical properties. KTN is a complete solid solution of KTaO3 and KNbO3, which possesses high chemical stability and mechanical stability.11 By engineering the content ratio of Ta/Nb, the phase transition temperature of KTN is available to be modulated. Meanwhile, the dielectric properties of KTN differ from different Curie points.12–17 Therefore, we found that the polarity of KTN is available to be modulated via engineering Ta/Nb ratio. Hence, we designed the composition of KTN and polymer matrix to study the function essence of KTN with varied polarity on the dielectric performance of the composite.
We designed KTa1−xNbxO3 with different Ta/Nb ratios (x = 0.15, 0.25, 0.5, 0.75, 0.85) to alter the polarization characteristics. KTN nanoparticles were prepared by the hydrothermal synthesis method. A portion of KTN nanoparticles was compressed into ceramic plates to facilitate the test of the dielectric parameters of KTN. In addition, we fabricated KTN/PVDF composite films by the solution casting to investigate the influence of KTN filler with varied polarity on the dielectric performance of the KTN/PVDF composites. The dielectric parameters of permittivity, dielectric loss, and breakdown strength were tested. The morphology of KTN particles was characterized by scanning electron microscopy.
Experimental procedures
Preparation of KTN powder
The KTa1−xNbxO3 nanoparticles with varied ratios of Ta/Nb were synthesized based on the hydrothermal method. (1) The mineralizer of KOH (AR, Guangfu Fine Chemical Research Institute) was dissolved in 60 mL of distilled water. (2) Tantalum pentoxide (Ta2O5 99.99%, Guangfu Fine Chemical Research Institute) and niobium pentoxide (Nb2O5 99.99%, Guangfu Fine Chemical Research Institute) with corresponding stoichiometric ratios were weighed and added to the KOH solution. (3) The neutral surfactant PVA (polyvinyl acetate, 98%, Shanghai 3F New Materials Co., LTD) was added to the solution for improving the dispersibility of KTN nanoparticles. (4) The mixture solution was stirred for 1 h and then enclosed into the 100 mL teflon vessel. (5) The vessel was placed in the reactor and heated at 200 °C for 24 h. (6) The reactor was cooled down to room temperature naturally. (7) The obtained precipitates were washed with distilled water and ethanol, then dried at 60 °C for 8 h.Fabrication of KTN ceramics
The PVA was added into the KTN powder and then KTN powder was ground to the state of average grain size. After that, the powder was compressed to a flake by the tablet press for the convenience of the dielectric measurement. Finally, the flakes were sintered at 1010 °C for 4 hours.14Synthesis of KTN/PVDF composites
KTN powder was first dissolved in the dimethylformamide (DMF, AR, Fuyu reagent Co., LTD) then vibrated ultrasonically for 1 h. The neutral PVDF (FR903, Shanghai 3F New Materials Co., LTD) was weighed and added to the solution gradually. After that, the mixture solution was stirred mechanically for 2 h. The solution was cast on a clean glass plate to acquire the composite films using a film coating machine. Then the films were heated at 80 °C for 12 h. Finally, the composites with gradient fractions of KTN/PVDF were fabricated. The schematic diagram of the synthesis procedure for the composite film was exhibited as Fig. 1. | ||
| Fig. 1 The schematic diagram of the synthesis procedure for KTa1−x NbxO3/PVDF composite film. | ||
Characterization
The crystalline phase detection was performed by X-ray diffraction (XRD, Quanta 200FEG, FEI, America) using Cu Kα radiation. The morphology of KTN particles and films' cross-section was observed by scanning electron microscopy (SEM, S-4700, Hitachi, Japan). The films were plated Al on both sides to investigate the dielectric properties with the impedance analyzer (Agilent 4294A, America). The breakdown strength was tested on the dielectric withstand voltage test (HT-50, Guilin Electrical Equipment Scientific Research Institute, China) under the direct current voltage of 200 V s−1.Results and discussion
The XRD (X-ray diffraction) pattern of the synthesized KTN with varied Ta/Nb ratios was shown in Fig. 2. The crystallographic diffraction peaks indexing match the PDF standard card, which indicates standard perovskite phase KTN without pyrochlore was successfully fabricated.15 The sharp peaks indicate that the KTN has a preferable crystalline state.11 It can be seen from the XRD pattern that the phase structure of KTa0.15Nb0.85O3 is orthorhombic (PDF: 32-0822). The depressed asymmetric diffraction peak at 2θ ≈ 45.5° indicates the phase structure of KTa0.25Nb0.75O3 is tetragonal. The cubic and tetragonal phases exist in the KTa0.5Nb0.5O3 simultaneously. The phase structure of KTa0.85Nb0.15O3 and KTa0.75Nb0.25O3 are all pseudo cubic (PDF: 38-1470).16,17 | ||
| Fig. 2 XRD pattern of the KTN with varied Ta/Nb ratio. | ||
In general, KTa1−xNbxO3 KTN is a compatible solid solution of potassium tantalite (KTaO3) and potassium niobate (KNbO3), the phase structures and the properties can be modulated by controlling the composition, and the Curie temperature of paraelectric–ferroelectric phase transition varies with the Ta/Nb ratio. The phase state, orthorhombic, tetragonal, and cubic at room temperature, can be modulated by varying Ta/Nb substitution. When Nb concentration is less than 20%, x = 0–0.2, the phase of KTN is mainly cubic. While Nb concentration falls in between 20% and 52%, x = 0.2–0.52, the tetragonal phase KTN can be obtained. Once Nb concentration exceeds 52%, x > 0.52, KTN exists as orthorhombic phase.18,19 The regularity demonstrates that KTN phase will change from orthorhombic to tetragonal as the Ta/Nb ratio is close to 0.2![[thin space (1/6-em)]](https://www.rsc.org/images/entities/char_2009.gif) :0.8, from tetragonal to cubic as the Ta/Nb ratio is close to 0.48:0.52 at room temperature.
:0.8, from tetragonal to cubic as the Ta/Nb ratio is close to 0.48:0.52 at room temperature.
Fig. 3 shows the SEM (scanning electron microscope) images of KTN nanoparticles with different Ta/Nb ratios. It can be seen that the micro shapes of all the KTa1−xNbxO3 are cubes with average grain size of 280 nm, 230 nm, 250 nm, 310 nm, 470 nm, respectively. While KTa0.15Nb0.85O3 nanocubes have inferior crystallinity and larger grain size. Fig. 3(f) displays the cross-section of KTa0.25Nb0.75O3/PVDF, which indicates fillers were well dispersed into the matrix uniformly.
 | ||
| Fig. 3 SEM images of KTN nanoparticles: (a) KTa0.85Nb0.15O3; (b) KTa0.75Nb0.25O3; (c) KTa0.5Nb0.5O3; (d) KTa0.25Nb0.75O3; (e) KTa0.15Nb0.85O3; (f) cross-section of KTa0.25Nb0.75O3/PVDF composite. | ||
The frequency-dependent dielectric properties for the five component KTN ceramics with varied Ta/Nb ratios were displayed in Fig. 4. It was found that KTa0.5Nb0.5O3 has the highest permittivity of value 3780 at 1 kHz due to its Curie temperature is closer to room temperature. Curie temperature represents a critical state when KTN transit from ferroelectric to paraelectric phase, electric polarization changed abruptly and dielectric permittivity rose to reach a peak value. While KTa0.25Nb0.75O3 ranks the second with a value of 1532 at 1 kHz for the phase transition from orthorhombic to tetragonal at room temperature. The phase transition temperature reduces as Nb substitution of KTa1−xNbxO3 decreases. It demonstrates that the polarity of KTN is available to be modulated by altering Nb substitution. As presented in Fig. 4(b), KTa0.85Nb0.15O3 has the lowest dielectric loss with a value of 0.08 at 1 kHz, the dielectric loss of KTa0.5Nb0.5O3 is 0.14 at 1 kHz. Thereby, it can be concluded that KTa0.5Nb0.5O3 possesses the most favorable dielectric permittivity and relatively lower dielectric loss compared with the counterparts. The dielectric loss of KTa0.5Nb0.5O3 at 106 Hz reaches a low value of 0.06, which indicates the application of KTa0.5Nb0.5O3 ceramic in relatively high frequency capacitor.
 | ||
| Fig. 4 Frequency dependence of (a) permittivity; (b) dielectric loss of KTN varied Ta/Nb ratios. | ||
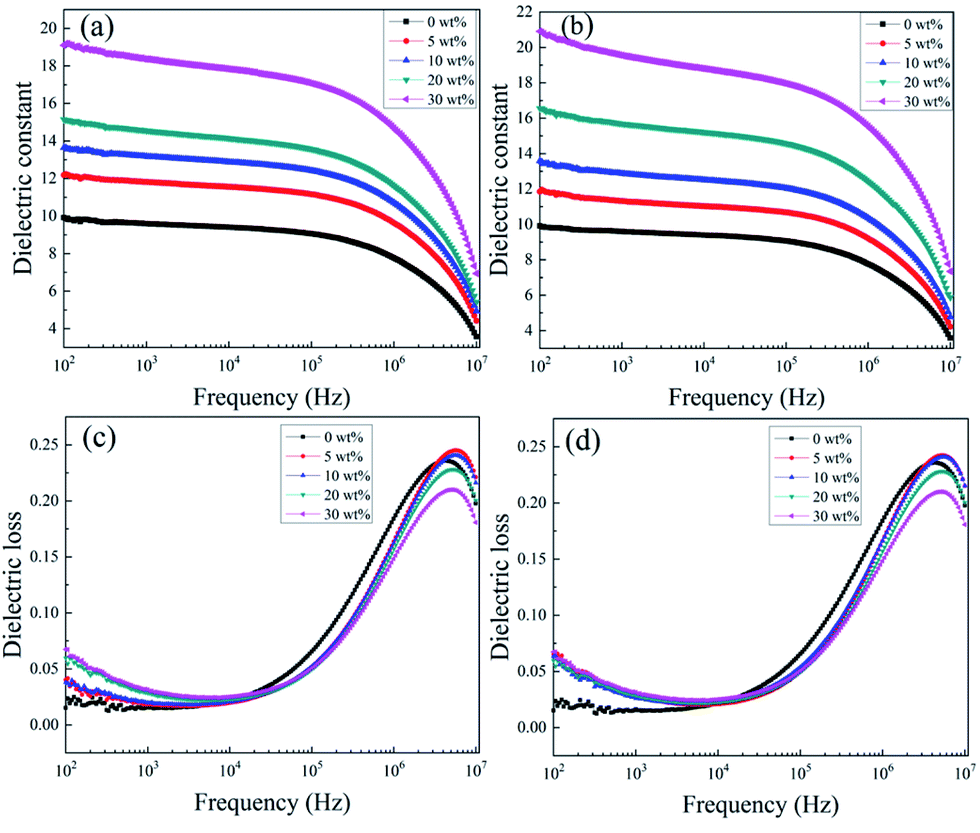
Fig. 5(a) demonstrates the variation in the dielectric permittivity of five component KTa1−xNbxO3/PVDF composites as a function of frequency at room temperature. As expected, KTa0.5Nb0.5O3/PVDF possesses the largest dielectric permittivity of 19.5 at 1 kHz, which is attributed to the high permittivity of filler KTa0.5Nb0.5O3. The permittivity of KTa0.25Nb0.75O3/PVDF is the second with a value of 18.8 at 1 kHz. Fig. 5(c) and (d) exhibit the changing trend of dielectric loss on frequency for five KTN/PVDF composites. The comparison of the five KTN/PVDF composites is consistent with that of the dielectric permittivity in low frequency (102–104 Hz).
 | ||
| Fig. 5 Frequency dependence of dielectric permittivity of (a) 20 wt% (b) 30 wt% KTa1−xNbxO3/PVDF nanocomposites with varied Ta/Nb ratios. Frequency dependence of dielectric loss of (c) 20 wt% (d) 30 wt% KTa1−xNbxO3/PVDF nanocomposites with varied Ta/Nb ratios. | ||
The results in Fig. 6(a) and (b) show the permittivity of the composites enhances as an increase on loaded KTN over the whole frequency region because of the KTN has larger permittivity than neat PVDF. With the content of KTN fillers increasing, stronger interfacial polarization is produced, where a value of 19.5 at 1 kHz of 30 wt% KTa0.5Nb0.5O3/PVDF is nearly double than that of neat PVDF. The permittivity of 30 wt% (≈10 vol%) KTa0.5Nb0.5O3/PVDF is 1.3 times higher than that of 10 vol% BaTiO3/PVDF and this value is higher than those of many previous reports listed in Table 1.23–30 The sharply decreased dielectric permittivity in higher frequency (105–106 Hz) is ascribed to that interfacial polarization can't follow the changing of the external electric field timely and then declines, while the relaxation polarization played a dominant role in higher frequency region (105–107 Hz). The variation of dielectric loss for the composites with increased KTN content follows the regularity of that of dielectric permittivity. The dielectric loss of both neat PVDF and the composites enlarges sharply along with incremental frequency from 104 to 106 Hz, which is responsible for the relaxation polarization of polar organic medium PVDF. In addition, the incorporation of KTN decreases the loss tangent of the nanocomposites at higher frequency (104–107 Hz). The interaction between KTN and PVDF can restrain the segmental motion of the polymer matrix, which is contributed to the C–F dipole orientation polarization of the PVDF matrix. It is noted the dielectric loss maintains a low value of less than 0.07 in the frequency from 102 Hz to 105 Hz, which is favorable for the improvement of charge–discharge efficiency.
 | ||
| Fig. 6 Frequency dependence of dielectric permittivity of (a) KTa0.25Nb0.75O3/PVDF; (b) KTa0.5Nb0.5O3/PVDF nanocomposites with gradient incremental KTN; dielectric loss of (c) KTa0.25Nb0.75O3/PVDF; (d) KTa0.5Nb0.5O3/PVDF nanocomposites with gradient incremental KTN. | ||
| Composites | εr | tanδ |
f (vol%) | Ref. |
|---|---|---|---|---|
| Ba0.6Sr0.4TiO3/PVDF | 17 | 0.275 | 10 | 23 |
| Ba0.6Sr0.4TiO3@PDA/PVDF | 15 | 0.024 | 10 | 24 |
| SiCN/PVDF | 13 | 0.15 | 10 | 25 |
| TiO2/PVDF | 23 | 0.05 | 10 | 26 |
| TiO2@BaTiO3/PVDF | 19.5 | 0.05 | 10 | 1 |
| BaTiO3/PVDF | 15 | 0.07 | 10 | 1 |
| BaTiO3@Fe3O4/PVDF | 16 | 0.1 | 10 | 27 |
| BaZr0.3Ti0.7O3/PVDF | 17 | 0.02 | 7.5 | 28 |
| CaCu3Ti4O12@Al2O3/PVDF | 17 | 0.025 | 6 | 29 |
| Pb(Mg1/3Nb2/3)O3–PbTiO3/PVDF-HFP | 13 | 0.02 | 10 | 30 |
| KTa0.5Nb0.5O3/PVDF | 19.5 | 0.14 | 11 (≈30 wt%) | Our work |
The breakdown strength is regarded as a vital characteristic of the dielectric materials, which determines the energy density of nanocomposites. The Weibull distribution was utilized to analyze the breakdown strength.
| P(E) = 1 − exp[−(E/Eb)β] |
Fig. 7 exhibits the Weibull distribution of breakdown strength for the composite loaded with gradient concentrations of KTN, where (a) and (b) correspond to the breakdown strength of KTa0.25Nb0.75O3/PVDF and KTa0.15Nb0.85O3/PVDF composites, respectively. As shown in Fig. 7, the breakdown strength for both KTa0.25Nb0.75O3/PVDF and KTa0.15Nb0.85O3/PVDF composites decreases as the loaded content of KTN increases from 0 wt% to 30 wt%. The results can be explained by several reasons. First, a high inhomogeneous electric field generates on account of the great disparity of permittivity between KTN filler and PVDF matrix once the dielectrics with high permittivity were doped into the polymer, which makes the electric field among the KTN much higher than the average field in the composites. Second, the agglomeration of the filler and defects take a passive effect on the breakdown strength of the composites. The more KTN filler added, the more agglomeration and defects introduced, leading to the evident decline of the breakdown strength of the composites since electric breakdown currently occurs in the weakest part of the material.22
 | ||
| Fig. 7 Weibull plots of the breakdown strength of (a) KTa0.25Nb0.75O3/PVDF; (b) KTa0.15Nb0.85O3/PVDF composites. | ||
Fig. 8 exhibits the Weibull distribution of breakdown strength for the five component KTa1−xNbxO3/PVDF composites with varied Ta/Nb ratio. Comparing the breakdown strength of the KTN/PVDF composites with varied Ta/Nb ratios, Eb of KTa0.75Nb0.25O3/PVDF is relatively higher than those of the others. The results could be attributed to its weaker inherent polarization that is adverse to the motion of carriers. Moreover, the small size of KTa0.75Nb0.25O3 nanoparticles generated weaker agglomeration, which leads to feeble local field distortion in the composites.5 The Eb of loading 20 wt% KTa0.75Nb0.25O3/PVDF composite reaches the value of 164 kV mm−1.
 | ||
| Fig. 8 Weibull plots of the breakdown strength of the KTa1−xNbxO3/PVDF composites loaded with (a) 20 wt%; (b) 30 wt% filler. | ||
Conclusions
In summary, five component KTa1−xNbxO3 ceramics (x = 0.15, 0.25, 0.5, 0.75, 0.85) and corresponding KTa1−xNbxO3/PVDF composite films with varied polarity were fabricated. The dielectric properties of the KTN ceramics and KTN/PVDF composites were investigated. It was demonstrated that KTa0.5Nb0.5O3 ceramic has the highest permittivity and relatively lower dielectric loss among five KTN ceramics. The reason is that Curie temperature of KTa0.5Nb0.5O3 is closer to room temperature. The permittivity of KTa0.25Nb0.75O3 ranks the second due to its phase transition from orthorhombic to tetragonal at room temperature. The results demonstrate the polarity of KTN is available to be modulated by altering Nb substitution. The low dielectric loss with a value of 0.06 at 106 Hz indicates KTa0.5Nb0.5O3 ceramic is available to be applied in the relatively high frequency capacitor. The loading 30 wt% KTa0.5Nb0.5O3/PVDF composite possesses a higher dielectric permittivity with a value of 19.5 at 1 kHz compared with the counterparts, which results from the stronger polarity of the KTa0.5Nb0.5O3 ceramic. The dielectric permittivity of 30 wt% KTa0.25Nb0.75O3/PVDF was the second with a value of 18.8 at 1 kHz. In addition, the KTa0.75Nb0.25O3/PVDF achieves a higher breakdown strength than the others for its weaker inherent polarization and smaller particle size, Eb value of KTa0.75Nb0.25O3/PVDF reaches 164 kV mm−1 when 20 wt% KTN is doped. All the improved properties of the composites have demonstrated the great potential to provide an effective pathway to fabricate high performance dielectric applications.Conflicts of interest
There are no conflicts to declare.Acknowledgements
This work was financially supported by the University Nursing Program for Young Scholars with Creative Talents in Heilongjiang Province (No. UNPYSCT-2017095), the Natural Science Foundation of Heilongjiang Province (Grant No. YQ2019A004), the National Natural Science Foundation of China (No. 11444004 and No. 61372013).Notes and references
- P. H. Hu, Z. Y. Jia, Z. H. Shen, P. Wang and X. R. Liu, Appl. Surf. Sci., 2018, 441, 824–831 CrossRef CAS.
- Q. Huang, H. Luo, C. Chen, X. F. Zhou, K. C. Zhou and D. Zhang, J. Alloys Compd., 2017, 696, 1220–1227 CrossRef CAS.
- F. H. Liu, Q. Li, Z. Y. Li, Y. Liu, L. J. Dong, C. X. Xiong and Q. Wang, Compos. Sci. Technol., 2017, 142, 139–144 CrossRef CAS.
- Y. Thakur, T. Zhang, C. Lacob, T. N. Yang, J. Bernholc, L. Q. Chen, J. Runt and Q. M. Zhang, Nanoscale, 2017, 9(31), 10992–10997 RSC.
- Z. Zhang, H. Yang, H. Wang, X. G. Ding, Q. L. Zhang and Z. C. Zhu, J. Mater. Sci.: Mater. Electron., 2019, 30(3), 2501–2511 CrossRef CAS.
- Z. M. Dang, J. K. Yuan, S. H. Yao and R. J. Liao, Adv. Mater., 2013, 25(44), 6334–6365 CrossRef CAS PubMed.
- H. X. Tang and H. A. Sodano, Appl. Phys. Lett., 2013, 102(6), 063901 CrossRef.
- Y. N. Hao, X. H. Wang, K. Bi, J. M. Zhang, Y. H. Huang, L. W. Wu, P. Y. Zhao, K. Xu, M. Lei and L. T. Li, Nano Energy, 2017, 31, 49–56 CrossRef CAS.
- S. Moharana, S. Sai and R. N. Mahaling, J. Adv. Dielectr., 2018, 8(03), 1850017 CrossRef.
- S. B. Luo, S. H. Yu, R. Sun and C. P. Wong, ACS Appl. Mater. Interfaces, 2014, 6(1), 176–182 CrossRef CAS PubMed.
- H. J. Yu, Y. Y. Hu, H. D. Zhang, C. Zhang, C. C. Qiu, X. P. Wang, B. Liu, L. Wei, Q. G. Li and Y. G. Yang, Mater. Lett., 2018, 216, 77–80 CrossRef CAS.
- Y. M. Hu, H. S. Gu, Z. L. Hu, W. N. Di, Y. Yuan, J. You, W. Q. Cao, Y. Wang and H. L. W. Chan, Cryst. Growth Des., 2008, 8(3), 832–837 CrossRef CAS.
- Y. M. Hu, H. S. Gu, D. Zhou, Z. Wang, H. L. W. Chan and Y. Wang, J. Am. Ceram. Soc., 2010, 93(3), 609–613 CrossRef CAS.
- W. L. Yang, Z. X. Zhou, B. Yang, R. Zhang, Z. Wang, H. Z. Chen and Y. Y. Jiang, J. Am. Ceram. Soc., 2011, 94(8), 2489–2493 CrossRef CAS.
- K. Y. Zheng, D. M. Zhang, Z. C. Zhong, F. X. Yang and X. Y. Han, Appl. Surf. Sci., 2009, 256(5), 1317–1321 CrossRef CAS.
- H. H. Gu, K. J. Zhu, J. H. Qiu, Y. Cao and H. L. Ji, Adv. Powder Technol., 2012, 23(5), 558–561 CrossRef CAS.
- N. Wei, D. M. Zhang, X. Y. Han, F. X. Yang, Z. C. Zhong and K. Y. Zheng, J. Am. Ceram. Soc., 2007, 90(5), 1434–1437 CrossRef CAS.
- D. Rytz and H. J. Scheel, J. Cryst. Growth, 1982, 59(3), 468–484 CrossRef CAS.
- X. P. Wang, J. Y. Wang, Y. G. Yu, H. J. Zhang and R. I. Boughton, J. Cryst. Growth, 2006, 293(2), 398–403 CrossRef CAS.
- X. Zhang, Y. Shen, Z. H. Shen, J. Y. Jiang, L. Q. Chen and C. W. Nan, ACS Appl. Mater. Interfaces, 2016, 8(40), 27236–27242 CrossRef CAS PubMed.
- G. R. Chen, W. L. Yang, J. Q. Lin, X. Wang, D. P. Li, Y. Wang, M. F. Liang, W. M. Ding, H. D. Li and Q. Q. Lei, J. Mater. Chem. C, 2017, 5(32), 8135–8143 RSC.
- S. H. Liu, S. X. Xue, S. M. Xiu, B. Shen and J. W. Zhai, Sci. Rep., 2016, 6, 26198 CrossRef CAS PubMed.
- G. X. Hu, F. Gao, J. Kong, S. J. Yang, Q. Q. Zhang, Z. T. Liu, Y. Zhang and H. J. Sun, J. Alloys Compd., 2015, 619(619), 686–692 CrossRef CAS.
- J. W. Chen, X. M. Yu, Y. Fan, Z. K. Duan, Y. W. Jiang and F. Q. Yang, J. Mater. Sci.: Mater. Electron., 2017, 28, 18200–18206 CrossRef CAS.
- D. D. Sun, S. J. Huang, Y. Gao, B. S. Ma and Y. G. Wang, J. Alloys Compd., 2019, 256–262 CrossRef CAS.
- W. J. Ji, H. Deng, C. Guo, C. X. Sun, X. Guo, F. Chen and Q. Fu. Composites Part A-applied Science and Manufacturing, 2019, pp. 336–343 Search PubMed.
- C. H. Zhang, Q. G. Chi, J. F. Dong, Y. Cui, X. Wang, L. Z. Liu and Q. Q. Lei, Sci. Rep., 2016, 6, 33508 CrossRef CAS PubMed.
- Y. Song, Y. Shen, P. H. Hu, Y. H. Lin, M. Li and C. W. Nan, Appl. Phys. Lett., 2012, 15, 101 Search PubMed.
- Q. G. Chi, X. B Wang, C. H. Zhang, Q. G. Chen, M. H. Chen, T. D. Zhang, L. Gao, Y. Zhang, Y. Cui, X. Wang and Q. Q. Lei, ACS Sustainable Chem. Eng., 2018, 10, 1021 Search PubMed.
- H. Luo, C. Chen, K. Zhou, X. Zhou, Z. Wu and D. Zhang, RSC Adv., 2015, 10, 1039 Search PubMed.
| This journal is © The Royal Society of Chemistry 2020 |