
 Open Access Article
 This Open Access Article is licensed under a Creative Commons Attribution-Non Commercial 3.0 Unported Licence
Ni foam electrode solution impregnated with Ni-FeX(OH)Y catalysts for efficient oxygen evolution reaction in alkaline electrolyzers†
Dipanjan Sengupta ,
Stefania M. S. Privitera*,
Rachela Gabriella Milazzo,
Corrado Bongiorno,
Silvia Scalese and
Salvatore Lombardo
,
Stefania M. S. Privitera*,
Rachela Gabriella Milazzo,
Corrado Bongiorno,
Silvia Scalese and
Salvatore Lombardo
Institute for Microelectronics and Microsystems (IMM), National Research Council (CNR), Zona Industriale Ottava Strada, 5, 05121, Catania, Italy. E-mail: stefania.privitera@imm.cnr.it
First published on 3rd July 2020
Abstract
Oxygen evolution reaction (OER) is a demanding step within the water splitting process for its requirement of a high overpotential. Thus, to overcome this unfavourable kinetics, an efficient catalyst is required to expedite the process. In this context, we report on Ni foam functionalised with low cost iron (Fe) and iron hydroxide (Fe(OH)X), wet chemically synthesized as OER catalysts. The prepared catalyst based on iron hydroxide precipitate shows a promising performance, exhibiting an overpotential of 270 mV (at a current density of 10 mA cm−2 in 1 M KOH solution), an efficient Tafel slope of ∼50 mV dec−1 and stable chronopotentiometry. The promising performance of the anode was further reproduced in the overall water splitting reaction with a two electrode cell. The overall reaction requires a lower potential of 1.508 V to afford 10 mA cm−2, corresponding to 81.5% electrical to fuel efficiency.
Introduction
High energy demand and subsequent rapid depletion of fossil fuels have directed researchers to search for alternative as well as abundant clean energy resources. A possible solution is to electrolyse water to generate hydrogen as a clean fuel.1 Hydrogen is considered as one of the most promising energy carriers for future energy storage. Water electrolyzers driven by renewable energy sources, mostly solar or wind energy, are with no doubt an attractive technique to obtain economically and environment-friendly highly pure hydrogen.2 At present, alkaline electrolyzers and polymer electrolyte membranes (PEMs) are the mainly adopted technologies to achieve water splitting. However, the use of expensive components within the PEMs make it a limiting issue with respect to large scale industrial applications. On the other hand, alkaline water electrolyzers are more attractive because low-cost, earth abundant metal based electrocatalysts can be used in alkaline media.3,4 Technology based on the alkaline water electrolyzers is also considered as one of the most simple ways to produce hydrogen as a clean fuel.5The overall water splitting consists of hydrogen evolution reaction (HER) and oxygen evolution reaction (OER).6 For HER, highly active electrocatalysts are required to drive the cathodic hydrogen evolution reaction. However, the efficiency of electrochemical water electrolysis is restricted by the oxygen evolution reaction (OER) due to its intrinsically sluggish reaction kinetics, which imposes serious overpotential requirement of the whole water splitting reaction.7–9 In the OER process, four protons conjugation and oxygen–oxygen bond formation ((OER: 2H2O → O2 + 4H+ + 4e−) occurs, which makes it kinetically adverse and requires suitable catalysts to expedite the reaction.10 In this regard, to achieve the highly efficient water splitting, the OER electrocatalysts is of great importance to determine the conclusive efficiency.
To date, some noble metal oxides like RuOX and IrOX, show excellent OER performances but their high-cost and deficiency in nature restrict their application in the future large-scale economical hydrogen production.11 In this scenario, some 3d transition metals, such as Ni, Mn, Fe, Co and their various oxide and hydroxide salts, have shown superior performance as OER electrocatalyst.12–19 But most of the fabrication methods of such electrocatalysts proceed via some complicated route and eventually not beneficial in large scale industrial water splitting process. Thus to sustain in this aspect, an extremely simple procedure must be followed for the development of a superior, scalable and cost-effective electrocatalyst for the oxygen evolution process. Ni based materials, now-a-days are more attracting due to their abundance, cost-effectiveness and promising red-ox characteristics.20–23 Some recent literature survey clears that Ni-Fe based materials have stimulated great interest in water oxidation as a potential catalyst towards the OER process.24–28 Among these catalysts, nickel iron oxide/oxo-hydroxide (NiFeOX(OH)Y) is widely considered as the benchmark catalyst.27–29 The dual contribution of Ni and Fe results a superior catalytic activity may be due to the generation of redox-active metal center.27,30 Some literature dictates that betterment of the activity of nickel oxyhydroxides (NiOOH) can be done by incorporating Fe to NiOOH phase lattice.31–33 Furthermore, Ni2+–O and Fe3+–O bond distances closely matched in a Fe coupled NiOOH compound, which may be a probable reason for proper substitution by one metal ion by the other.34 But whether Fe or Ni is the active metal site in this compound, it is still a subject to argument.35,36
Aiming to develop a commercially viable, high-performing and environmentally friendly OER catalysts, we report superior oxygen-evolving electrocatalyst based on Fe-hydroxide on Ni foam, synthesized by simple wet-chemical impregnation technique. In this work, we report on the synthesis of Fe-hydroxide catalysts and their incorporation into Ni foams by two different procedures. The OER electrocatalytic properties of the modified Ni foams functionalised with Fe-hydroxide were evaluated and compared with unmodified Ni foams.
Experimental
Fabrication of functionalised Ni foam electrodes
Prior to the fabrication of OER electrode, Ni foam (MTI Corporation, thickness 1.6 mm with a porosity of 95%, 80–110 pores per inch) is ultrasonically cleaned by acetone and then dried at room temperature. After that, two kinds of samples are prepared. For the first sample, named Ni-Fe, the foam is immersed in a 1![[thin space (1/6-em)]](https://www.rsc.org/images/entities/char_2009.gif) :1 (v/v) solution of iron(III) chloride hexahydrate (FeCl3·6H2O) and HCl 0.05 mM for 5 minutes at room temperature. After the FeCl3 treatment the foam is washed thoroughly in deionized water and dried at room temperature. For the second sample we prepared a 1:1 (v/v) solution of iron(III) chloride hexahydrate (FeCl3·6H2O) and HCl 0.05 mM (the same as used for sample Ni-Fe); then few drops of ethanol are added and the solution is heated at 50 °C. During heating the colour changes from yellow to orange-red. The Ni foam is immersed in this solution for 5 minutes. Subsequently, 5 ml 1 M of KOH is added slowly. This step is finalized to the formation of dark green precipitate of iron hydroxide. The Ni foam is kept for 5 minutes more in the solution with the precipitate and then taken outside. It is further heated directly on a hot plate, wrapped in an aluminium foil, at 150 °C for 2 hours. The annealed sample is then washed and dried. This second sample is termed as Ni-FeX(OH)Y. The pictures of the three electrodes (unmodified Ni foam, Ni-Fe and Ni-FeX(OH)Y) are shown in Fig. S1, in the ESI.† The appearance of the Ni foam is observed to change from silver gray to steel gray and finally to dark gray after the treatment with iron chloride solution. The entire synthesis procedure has been depicted in Fig. 1.
:1 (v/v) solution of iron(III) chloride hexahydrate (FeCl3·6H2O) and HCl 0.05 mM for 5 minutes at room temperature. After the FeCl3 treatment the foam is washed thoroughly in deionized water and dried at room temperature. For the second sample we prepared a 1:1 (v/v) solution of iron(III) chloride hexahydrate (FeCl3·6H2O) and HCl 0.05 mM (the same as used for sample Ni-Fe); then few drops of ethanol are added and the solution is heated at 50 °C. During heating the colour changes from yellow to orange-red. The Ni foam is immersed in this solution for 5 minutes. Subsequently, 5 ml 1 M of KOH is added slowly. This step is finalized to the formation of dark green precipitate of iron hydroxide. The Ni foam is kept for 5 minutes more in the solution with the precipitate and then taken outside. It is further heated directly on a hot plate, wrapped in an aluminium foil, at 150 °C for 2 hours. The annealed sample is then washed and dried. This second sample is termed as Ni-FeX(OH)Y. The pictures of the three electrodes (unmodified Ni foam, Ni-Fe and Ni-FeX(OH)Y) are shown in Fig. S1, in the ESI.† The appearance of the Ni foam is observed to change from silver gray to steel gray and finally to dark gray after the treatment with iron chloride solution. The entire synthesis procedure has been depicted in Fig. 1.
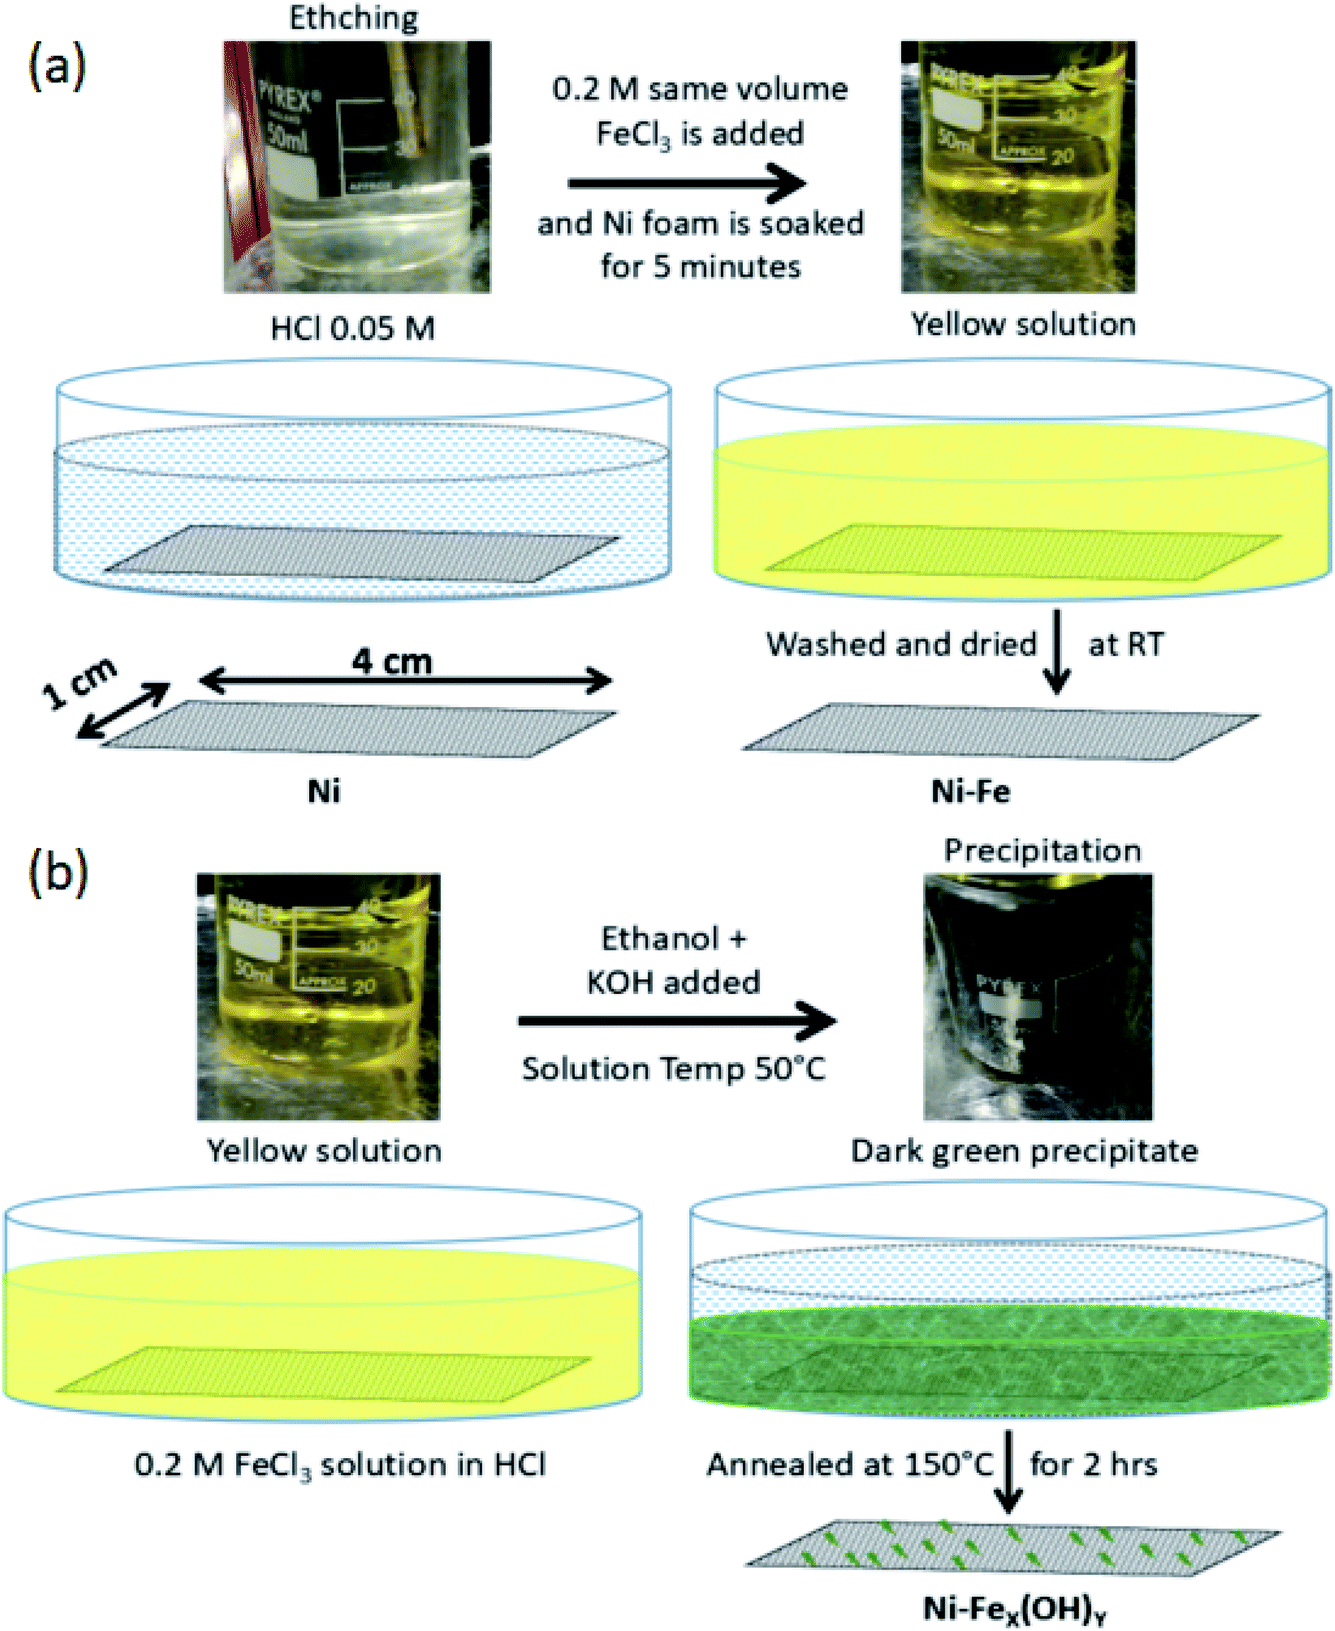 | ||
| Fig. 1 (a) Preparation procedure for Ni-Fe samples. (b) Preparation procedure for Ni-FeOH samples. | ||
Material characterizations
Scanning electron microscopy (SEM) is performed by ZEISS SUPRA™ 35 at 3 kV to study the morphological characteristics of the Ni-Fe electrodes. Elemental distribution is investigated by energy dispersive X-ray spectroscopy (EDS) using a X-MAX, 80 mm2 system by Oxford Instruments. Additionally, atomic scale morphology and chemical information is gained combining cross-sectional Transmission Electron Microscopy (TEM) and Scanning Transmission Electron Microscopy (STEM), coupled with Electron Energy Loss Spectroscopy (EELS), using a JEOL JEM 2010F electron microscope with a 200 kV accelerating voltage.Electrochemical measurements
All electrochemical characterizations and the current–voltage measurements are performed using a Keithley 2602 source current unit connected with a standard three-electrode configuration at room temperature. The fabricated OER electrodes are used as the working electrode, saturated calomel electrode (SCE) is used as the reference and a platinum wire as the counter electrode. The potential of the SCE reference electrode was routinely calibrated before and after experiments and, when not used for the experiments, the SCE electrode was constantly kept in saturated KCl solution. 1.0 M KOH (pH ∼ 14) is used as the electrolyte solution. Tafel slopes of the electrodes are derived from polarization curves. To check the stability of the electrochemical cell, chronopotentiometric measurements using two electrodes in different conditions have been also acquired. In this case a Ni foam functionalised with Pt has been used for the HER. The procedure to prepare Ni foam electrodes as HER, with Pt by spontaneous galvanic displacement, has been previously reported in ref. 37.The electrical response of the electrodes was also investigated by electrochemical impedance spectroscopy (EIS) in the frequency range from 20 Hz to 1 MHz, by applying 20 mV small signal amplitude and 0 V bias, using a E4980A Precision LCR Meter. During the measurement the electrodes are mounted and secured on an electrode stage which assures a fixed distance of 3 mm between the electrodes and it is made of plastic, to avoid artifacts in the EIS current measurements due to interference in the transfer of the electrons during the measurements. The LCR system was calibrated by measuring the impedance in open and short configuration.
Results and discussion
The detailed morphology characteristics of the as-prepared electrodes are revealed by SEM and TEM. Fig. 2(a) and (b) shows SEM images of the Ni-Fe samples from low to higher magnification. The image at highest magnification (Fig. 2(b)) puts in evidence the presence of many bulges on the Ni foam surface. Such a structured morphology has not been observed in the bare Ni foam which instead appears flat (not shown). Fig. 2(c) shows the EDX spectrum acquired on the Ni-Fe sample. The iron is detectable, although only in a small amount (0.8 wt%). | ||
| Fig. 2 SEM images of Ni-Fe sample (a) and (b) at different magnification. (c) EDS spectrum acquired on the same sample. | ||
It is worth to note that such a Ni-Fe sample is the starting point for the preparation of the second type of sample (Ni-FeX(OH)Y), with the addition of ethanol and KOH to the solution, in order to obtain precipitation. Fig. 3(a) and (b) shows the SEM images of the Ni-FeX(OH)Y sample. The images have been obtained after sample annealing at 150 °C for 2 h. On the Ni foam surface very small spherical aggregates (uniformly distributed spherical nanoparticles) are visible. The average diameter is of ∼20 nm. Similar findings are also documented by Owusu et al.38 Fig. 3(c) reports the EDX spectrum of the Ni-FeX(OH)Y sample. Because of the precipitation, a much higher amount of iron (6 wt%) is detected at the Ni foam surface.
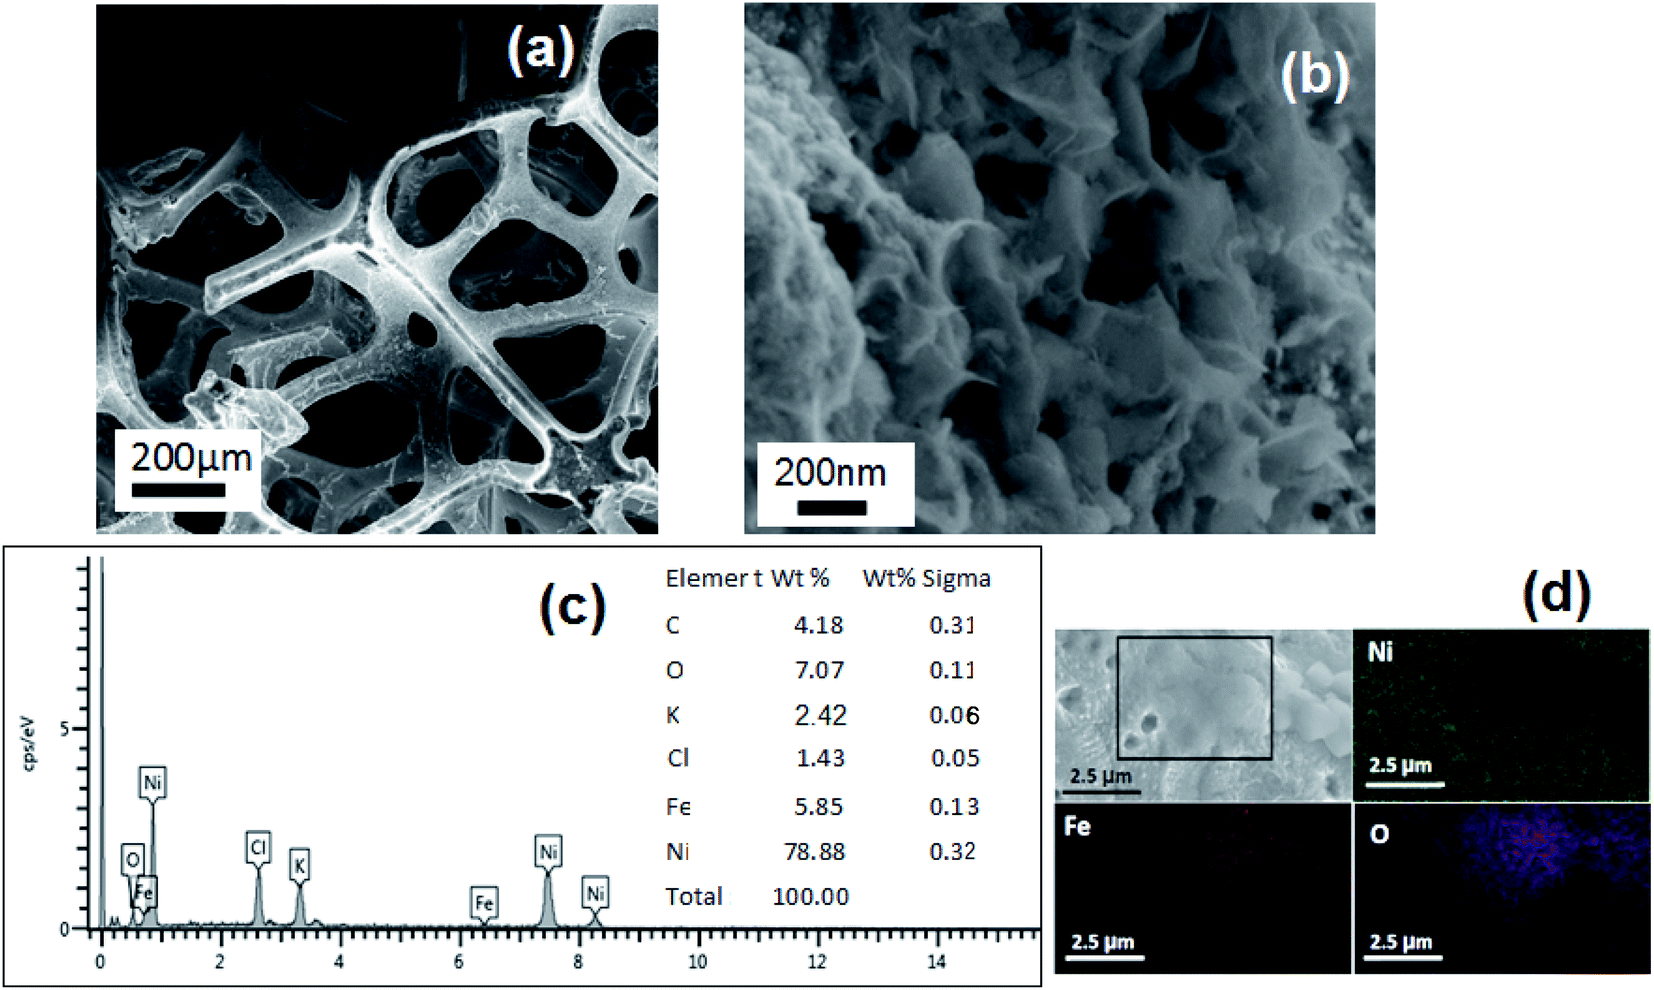 | ||
| Fig. 3 SEM images of Ni-FeX(OH)Y sample (a) and (b) at different magnification. (c) EDS spectrum acquired on the same sample. (d) EDS elemental mapping images of Ni, Fe and O for Ni-FeX(OH)Y sample. | ||
The elemental mapping in EDX analysis has been also carried out for Ni-FeX(OH)Y sample, as shown in Fig. 3(d). In the low intensity regions of the Ni map, we observe a higher intensity of Fe and O signals.
TEM analyses of the Ni-Fe and Ni-FeX(OH)Y samples have been carried out in order to evaluate the morphology and crystal structure, as well as to obtain more information on the elemental distribution at the nanoscale. Samples for TEM analysis have been prepared following the same procedures already described, but instead of using a Ni foam as substrate, we employed a flat Ni film, sputter deposited on Si (100) wafer. Fig. 4 displays the cross sectional TEM images of the Ni-Fe sample. The bulges on top of the Ni surface already observed by SEM on Ni foam, are clearly visible also by TEM, as shown in Fig. 4(a). The electron diffraction pattern acquired by selecting such a region is shown in the inset. Three rings are observed, indicating the presence of a polycrystalline structure, with interplanar distances of 2.54 Å, 2.12 Å and 1.48 Å, that can be attributed to the (100), (101) and (110) planes, respectively, of the feroxyhyte δ-FeOOH phase.39 Fig. 4(b) shows the sample surface at higher magnification. On top of the Ni substrate, a Ni oxide film is observed, about 10 nm thick. Above the NiO, several over imposed layers, with thickness of about 3–6 nm, are also observed. The live fast Fourier transform (FFT), taken in such thin layers, reported in Fig. 4(c), shows the presence of a crystalline pattern, characterized by atomic planes with spacing 2.55 Å, the same as shown in the inset of Fig. 4(a) and compatible with the (100) planes of the δ-FeOOH phase.39,40
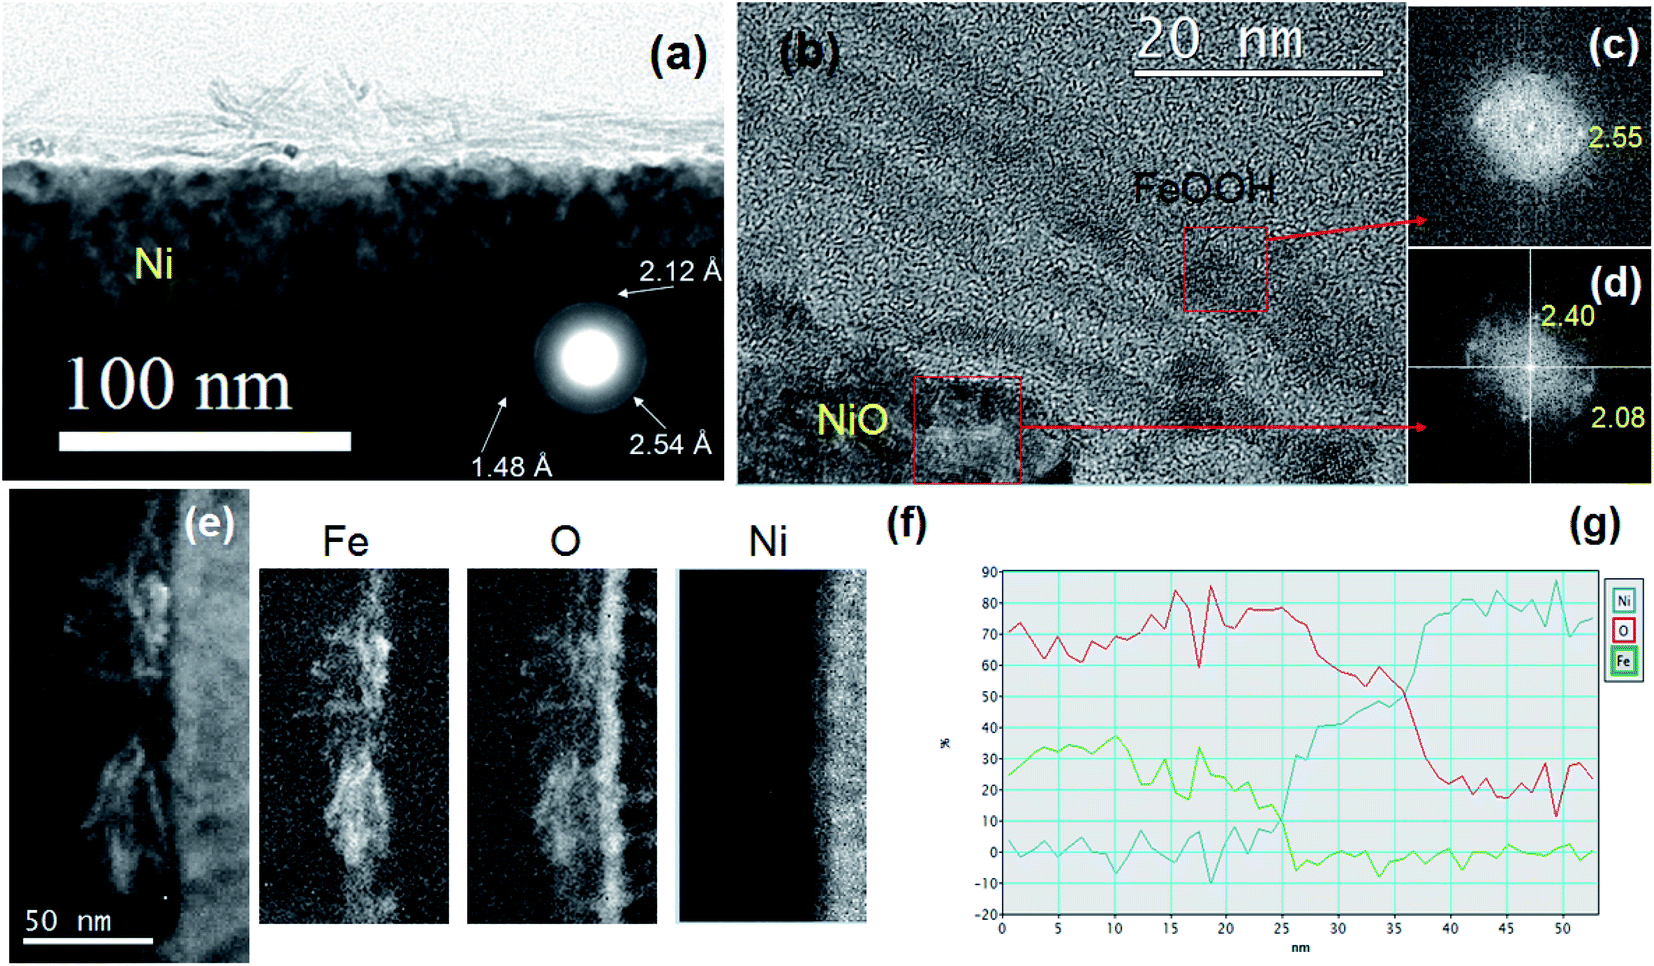 | ||
| Fig. 4 (a) Cross section TEM micrograph of Ni-Fe sample at low magnification, showing as inset the selected area electron diffraction pattern, acquired at the sample surface. (b) The sample surface at higher magnification. (c) and (d) Fast Fourier transform (FFT) taken in different regions, as indicated by the arrows. (e) STEM image in dark field of a region with several overlapping thin layers. (f) Elemental maps obtained from EELS spectroscopy. (g) Profile of the relative composition, from the surface towards the bulk Ni. | ||
The FFT acquired in the NiO layer, shown in Fig. 4(d), exhibits spots at 2.40 Å and 2.08 Å, characteristic of the (111) and (200) planes, respectively, of the NiO cubic crystalline structure. However, the thin layers seem to be not fully adhered to the NiO surface (see Fig. 4(b)) and throughout the sample, either regions with no thin surface layer or with superimposition of several layers can be found. Fig. 4(e) shows a STEM image in dark field configuration of a region with several overlapping thin layers. EELS spectroscopy has been employed to determine the composition. The distribution of the elements in the sample can be seen as elemental maps in Fig. 4(f). The thin layers at the surface mainly contain Fe and O. The line profile of the composition is shown in Fig. 4(g). The relative Fe–O composition confirms the formation of iron hydroxide, and of NiO below the iron layer.
Fig. 5(a) and (b) shows the HRTEM images in cross section acquired in the Ni-FeX(OH)Y sample, after precipitation and annealing. In this case the thin surface layer appears more uniformly distributed, and has a thickness of about 5 nm. The FFT acquired in different regions at the surface shows the presence of NiO (indicated by the rings in the insets of Fig. 5(b).
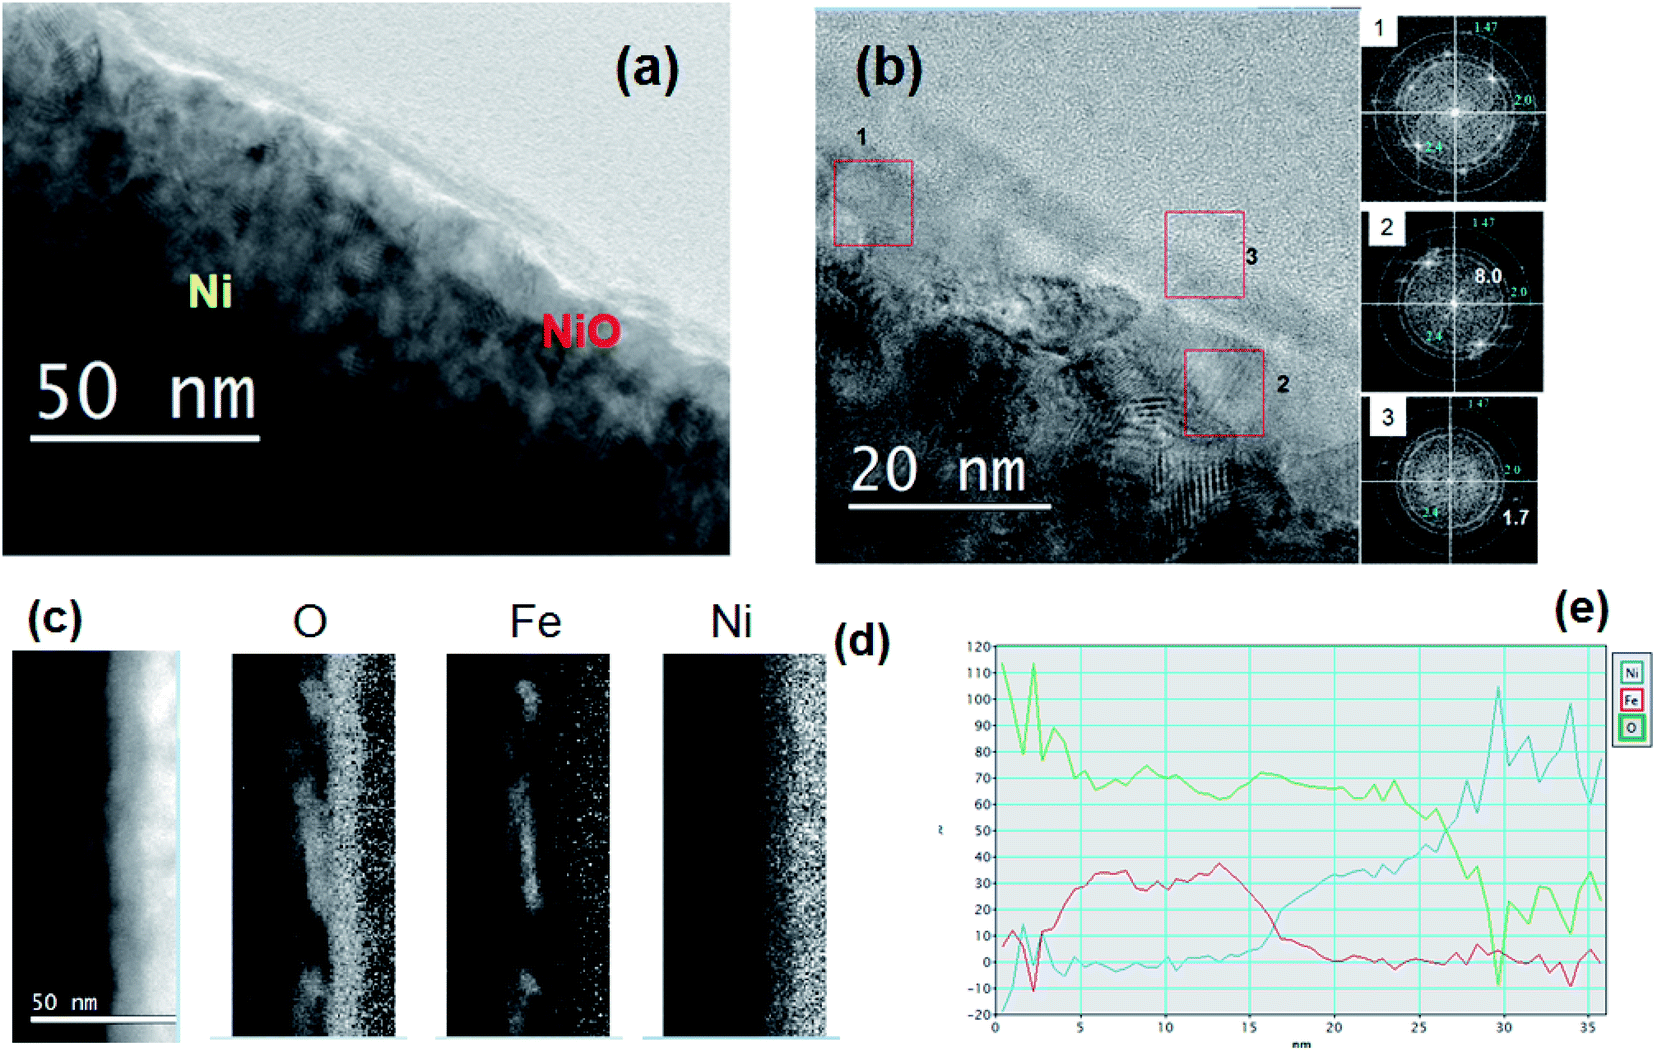 | ||
| Fig. 5 (a) TEM image in cross section of Ni-FeX(OH)Y sample. (b) HRTEM image showing the thin surface layer and, in the insets on the right, the FFT acquired in 3 different regions, as indicated in the micrograph. (c) STEM image in dark field. (d) Elemental maps. (e) Profile of the relative composition. | ||
In region 1, mainly NiO is detected. In region 2 two spots corresponding to a plane distance of 8.0 Å are visible. These can be ascribed to the α-NiOOH as well as to Fe(OH)2 (goethite). The FFT spots detected in region 3 correspond to plane distance of 2.5 Å and 1.7 Å, compatible with (δ-FeOOH), as already observed in the Ni-Fe sample. These results are confirmed by the EELS analysis. Fig. 5(c) and (d) show the STEM image in dark field and the corresponding elemental maps. Fig. 5(e) shows the profile of the relative composition. The relative amount of Fe and O is the same as observed in the Ni-Fe sample (iron hydroxide), while the relative Ni-O composition suggests the formation of a Ni compound more rich in oxygen than NiO, such as NiOOH. The Ni hydroxide formation is reasonably triggered by the addition of KOH in the deposition solution. The presence of such a layer has a relevant effect on the catalytic properties, as shown by the electrochemical characterization.
Electrochemical impedance spectroscopy
Fig. 6(a) and (b) shows the module and the phase of the impedance, respectively, as a function of frequency, as measured for the studied samples using a two electrodes configuration and 1.0 M KOH electrolyte. Ionic transport and charge conductance in porous electrodes is mathematically analogue to the diffusion of a wave in the finite distributed RC transmission line model, which is theoretically expected to give rise to a 45° phase angle of the impedance. Application of general transmission line model to porous electrodes41 has shown a decrease in the phase angle to 22.5° and 11.25° in the case of double-pores (macropores and mesopores) and triple-pores (macropores, mesopores and micropores).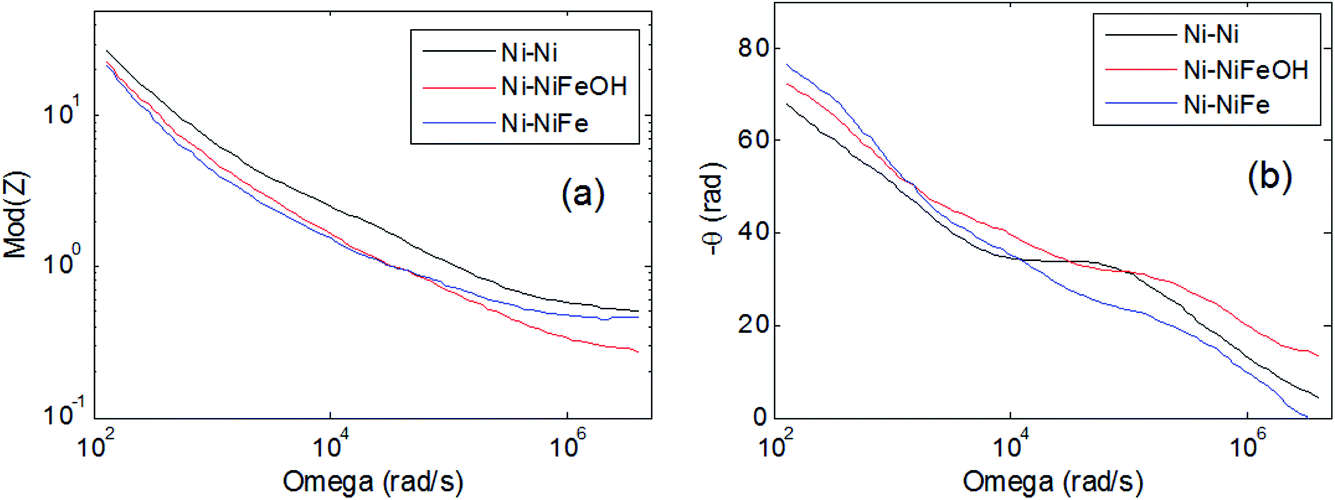 | ||
| Fig. 6 Bode plots of the measured impedance: (a) module, (b) phase of the impedance versus frequency. | ||
The experimentally measured impedance shown in Fig. 6, at low frequency, is dominated by a capacitive behaviour (1/ωC). The lower module obtained at low frequency for the Ni foam functionalised with Fe and FeX(OH)Y clearly indicates higher capacitance, suggesting, in agreement with the morphological analyses, a larger effective area.
At intermediate frequencies the phase (Fig. 6(b)) exhibits angles between 45° and 22.5°, indicating the presence of a structure made of double-pores. At high frequency the module of the impedance corresponds to the resistance of the electrolyte solution, around 0.4 ohm.
Oxygen evolution reaction (OER)
The electrocatalytic performances of the studied electrodes for OER in alkaline media are shown in Fig. 6. Oxygen evolution reaction behaviour, including polarization curves and relative Tafel plots, are determined for all the samples including the unmodified Ni foam. Data shown in Fig. 7(a)–(c) are recorded in a standard three-electrode electrochemical cell using the aforesaid electrodes as the working electrode individually, a saturated calomel electrode (SCE, saturated KCl) as the reference electrode and a Pt wire as the counter electrode. Fig. 7(a) shows the polarization curves at a scan rate of 50 mV s−1. In order to obtain a current density of 10 mA cm−2, the overpotential values on Ni-Fe and Ni foam samples are 325 mV and 433 mV, respectively, whilst the overpotential on Ni-FeX(OH)Y sample is 271 mV. It is now clear that Ni foam functionalised with FeX(OH)Y by precipitation shows superior performance with respect to the other samples. In this work, Tafel slopes on different catalyst materials are also analyzed and illustrated in Fig. 7(b). Generally, Tafel slope is an important parameter to estimate the performance of an OER catalyst. It manifests how the current density changes with increasing overpotential values and contains important information about the reaction mechanism. The shown Tafel plots are derived from the polarisation curves obtained at very slow voltage step (1 mV s−1 with measure delay of 1.5 seconds in each step). The Ni-FeX(OH)Y sample gives a Tafel slope of 50 mV dec−1, while the other samples along with the unmodified Ni foam shows higher slope values of 60.98 mV dec−1 (Ni-Fe) and 114 mV dec−1 (Ni) respectively.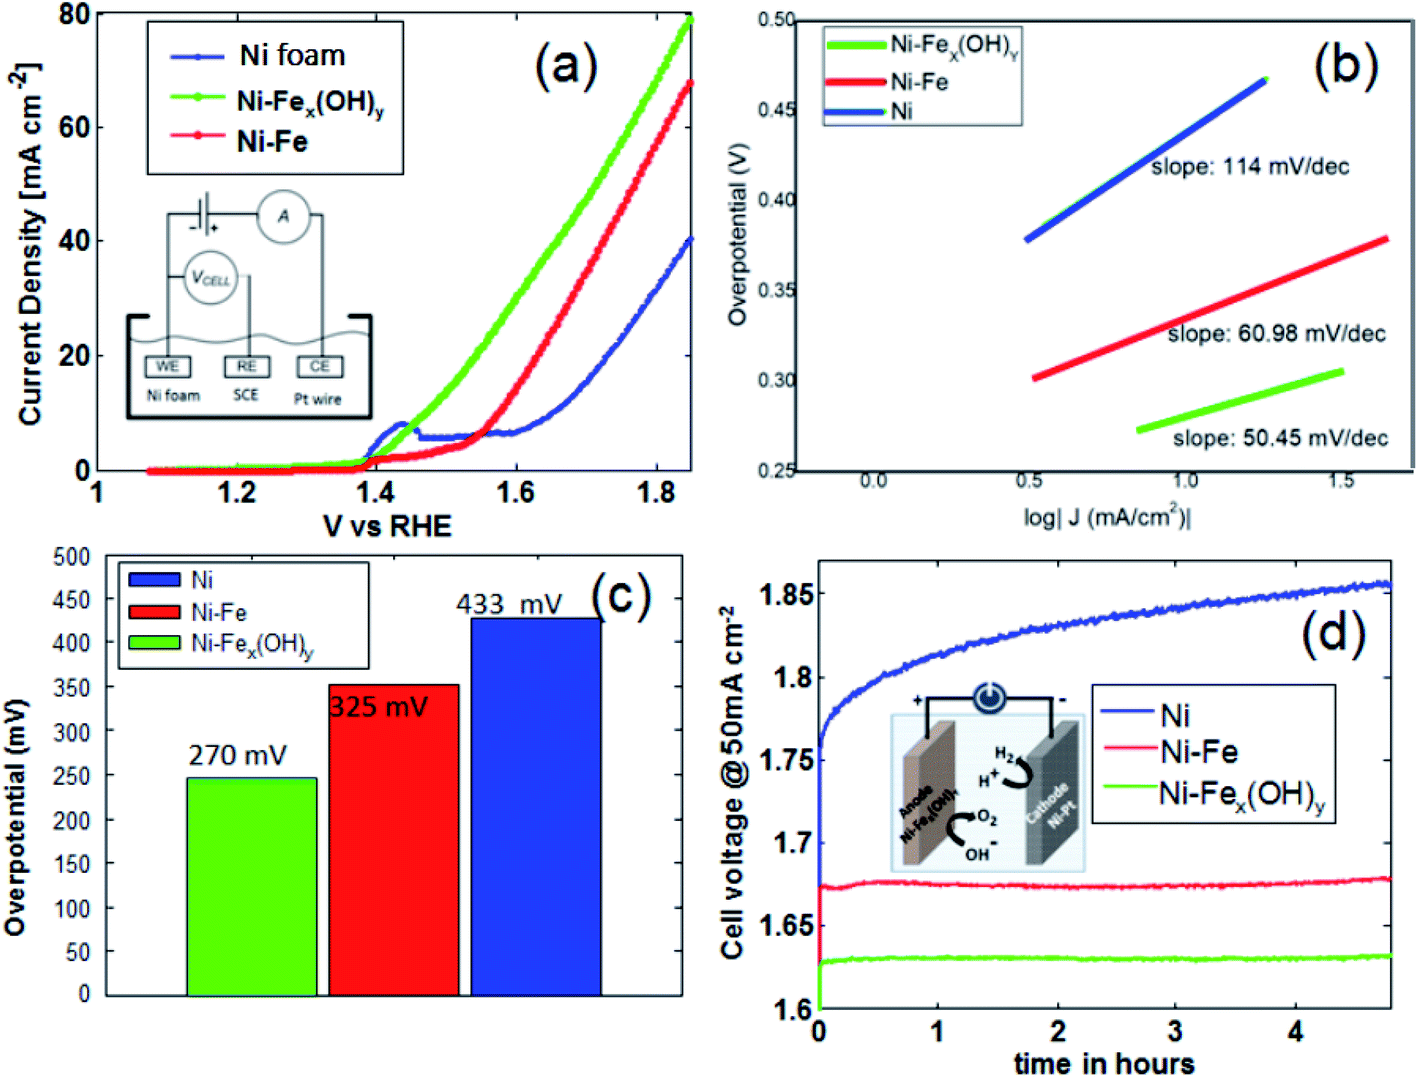 | ||
| Fig. 7 (a) Polarization curves of the electrodes at a scan rate of 50 mV s−1 in 1 M KOH; (b) Tafel plots acquired from the polarization curves. (c) OER activity comparison of the electrodes with respect to overpotentials at 10 mA cm−2. (d) Chronopotentiometric curves obtained under constant current stress (50 mA cm−2) in the two electrode system. | ||
The corresponding overpotentials at 10 mA cm−2 (η10) and Tafel slope values of different Ni-Fe samples are abridged in Table S1.† OER activity comparison of the samples with respect to the overpotential values are portrayed in Fig. 7(c). The two electrodes stability is investigated by chronopotentiometry, as shown in Fig. 7(d). Under the current density of 50 mA cm−2, using two electrodes in 1 M KOH, higher stability is obtained by iron doping, compared to the bare Ni foam, with the lowest operating potential of 1.63 V obtained for the Ni-FeX(OH)Y sample. Such a potential is maintained almost constant for all the investigated time range.
After the stress, the morphology and composition of the samples have been checked by SEM analyses. Fig. 8(a–d) show the Ni-Fe and the Ni-FeX(OH)Y on Ni foam after the stability test and the corresponding EDS spectra. The edges of the bulges and the layered structures appear to be more rounded than in the fresh samples. Moreover, after stress the relative wt% ratio between oxygen and iron in the Ni-Fe sample decreases while in the Ni-FeX(OH)Y sample remains almost constant.
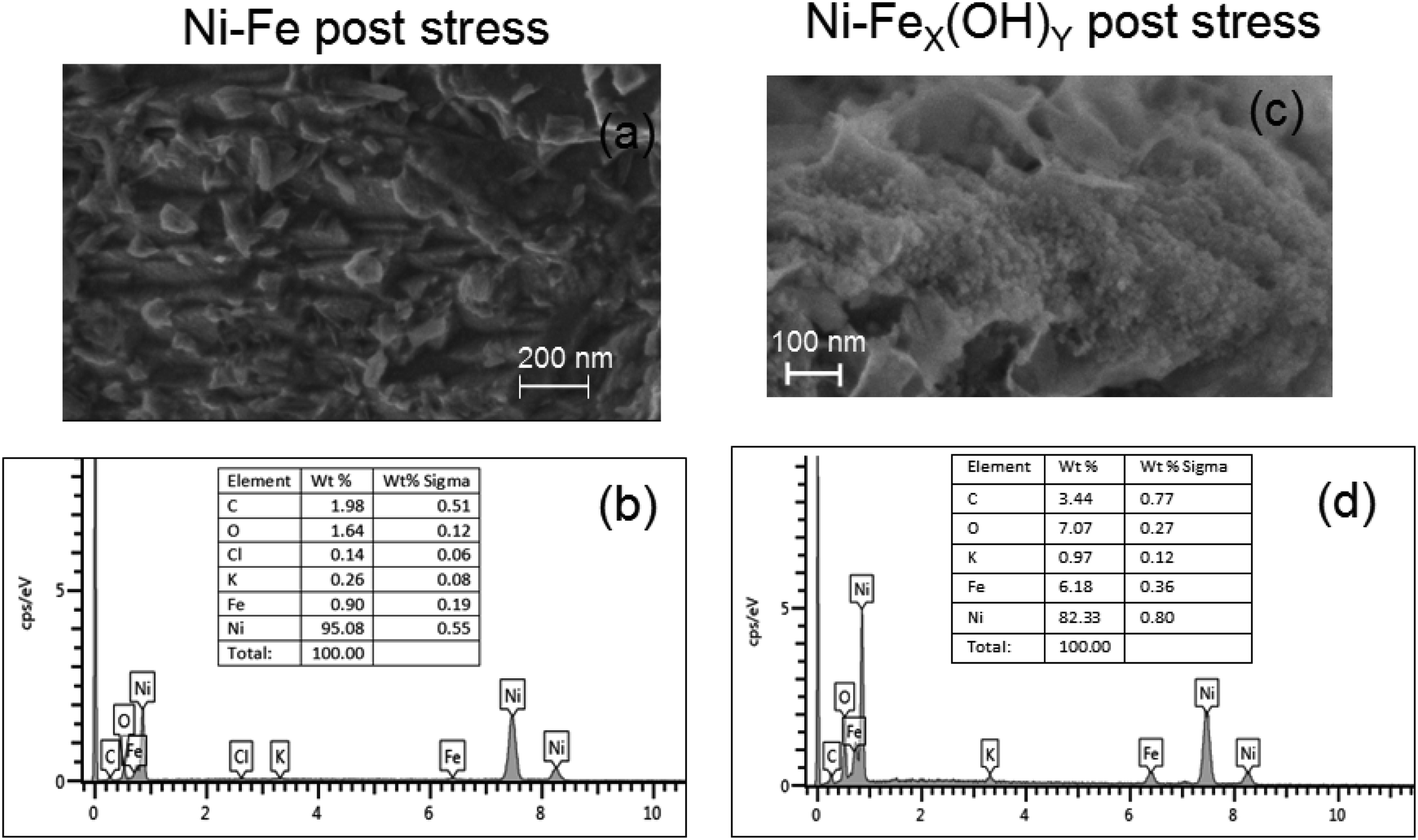 | ||
| Fig. 8 (a) SEM images of Ni-Fe sample after stress. (b) EDS spectrum acquired on the Ni-Fe sample after stress. (c) SEM images of Ni-FeX(OH)Y sample after stress. (d) EDS spectrum of the Ni-FeX(OH)Y sample after stress. | ||
Since the two studied samples, although prepared using different procedures, exhibit the formation of the same iron compound (FeOOH in the δ phase), the better performance observed in the Ni-FeX(OH)Y has to be related to the presence of the NiOOH. It is known in literature that the Fe doped NiOOH [(Ni,Fe)OOH], is one of the most efficient electrocatalysts for OER in alkaline conditions.42 However, the catalytic site (Ni or Fe) still remains under debate.34,43,44 It has been shown by a theoretical study25 that, Fe substitution in Ni(OOH) drastically changes the rate determining step, shifting the Ni4+ resting state in Ni(OOH) to a more reduced Ni3+ resting state in Ni-Fe(OOH). The presence of more available Ni3+ in the present study seems to improve the catalytic performance.
Conclusions
In summary, we report an electrocatalyst for OER process wet chemically synthesized by a facile impregnation method on Ni foam, functionalised with low cost iron and iron hydroxide (FeX(OH)Y). The modified Ni foams are characterized in terms of their morphology, crystallinity, elemental recognition and electrical behaviour. Precipitated FeX(OH)Y on Ni foam shows a promising performance by delivering an overpotential of 271 mV (at current density of 10 mA cm−2 in 1 M KOH solution), an efficient Tafel slope of ∼50 mV dec−1 and a stable chronopotentiometry with no certain degradation in OER performance. The superior electrochemical performance has been ascribed to the formation of a NiOOH layer, together with the iron hydroxide. The formation of the mixed Ni-Fe(OOH) layer, known as one of the most efficient electrocatalysts for OER in alkaline conditions, is promoted by the wet impregnation procedure.Conflicts of interest
There are no conflicts to declare.Acknowledgements
D. Sengupta would like to acknowledge ICTP (International Centre for Theoretical Physics) for the TRIL fellowship. The authors are really grateful to Mr Salvatore Pannitteri, CNR-IMM, for the assistance during cross-sectional TEM preparation. The work has been supported by the European Project PECSYS. The project has received funding from the Fuel Cells and Hydrogen 2 Joint Undertaking under grant agreement No 735218. This Joint Undertaking receives support from the European Union’s Horizon 2020 Research and Innovation program and Hydrogen Europe and N.ERGHY.References
- F. Qin, Z. Zhao, M. K. Alam, Y. Ni, F. Robles-Hernandez, L. Yu, S. Chen, Z. Ren, Z. Wang and J. Bao, ACS Energy Lett., 2018, 3, 546–554 CrossRef CAS.
- Z. W. Seh, J. Kibsgaard, C. F. Dickens, I. Chorkendorff, J. K. Nørskov and T. F. Jaramillo, Science, 2017, 355, aad4998 CrossRef PubMed.
- F. A. Garcés-Pineda, M. Blasco-Ahicart, D. Nieto-Castro, N. López and J. R. Galán-Mascarós, Nat. Energy, 2019, 4, 519–525 CrossRef.
- C. C. L. McCrory, S. Jung, J. C. Petersand and T. F. Jaramillo, J. Am. Chem. Soc., 2013, 135, 16977–16987 CrossRef CAS PubMed.
- K. Zeng and D. Zhang, Prog. Energy Combust. Sci., 2010, 36, 307–326 CrossRef CAS.
- J. Yang, Q. Shao, B. Huang, M. Sun and X. Huang, iScience, 2019, 11, 492–504 CrossRef CAS PubMed.
- H. Zhou, F. Yu, Q. Zhu, J. Sun, F. Qin, L. Yu, J. Bao, Y. Yu, S. Chen and Z. Ren, Energy Environ. Sci., 2018, 11, 2858–2864 RSC.
- Z. Liu, H. Yu, B. Dong, X. Yu and L. Feng, Nanoscale, 2018, 10, 16911–16918 RSC.
- A. Li, Y. Sun, T. Yao and H. Han, Chem.–Eur. J., 2018, 24, 18334–18355 CrossRef CAS PubMed.
- K. Zhu, X. Zhu and W. Yang, Angew. Chem., Int. Ed., 2019, 58, 1252–1265 CrossRef CAS PubMed.
- H. Kim, J. Park, I. Park, K. Jin, S. E. Jerng, S. H. Kim, K. T. Nam and K. Kang, Nat. Commun., 2015, 6, 8253 CrossRef CAS PubMed.
- H. Osgood, S. V. Devaguptapu, H. Xu, J. Cho and G. Wu, Nano Today, 2016, 11, 601–625 CrossRef CAS.
- G. Wu and P. Zelenay, Acc. Chem. Res., 2013, 46, 1878–1889 CrossRef CAS PubMed.
- X. Yu, T. Hua, X. Liu, Z. Yan, P. Xu and P. Du, ACS Appl. Mater. Interfaces, 2014, 6, 15395–15402 CrossRef CAS PubMed.
- D. González-Flores, K. Klingan, P. Chernev, S. Loos, M. R. Mohammadi, C. Pasquini, P. Kubella, I. Zaharieva, R. D. L. Smith and H. Dau, Sustainable Energy Fuels, 2018, 2, 1986–1994 RSC.
- B. Han, A. Grimaud, L. Giordano, W. T. Hong, O. Diaz-Morales, L. Yueh-Lin, J. Hwang, N. Charles, K. A. Stoerzinger, W. Yang, M. T. M. Koper and Y. Shao-Horn, J. Phys. Chem. C, 2018, 122, 8445–8454 CrossRef CAS.
- J. Yu, G. Cheng and W. Luo, Nano Res., 2018, 11, 2149–2158 CrossRef CAS.
- M. Huynh, C. Shi, S. J. L. Billinge and D. G. Nocera, J. Am. Chem. Soc., 2015, 137, 14887–14904 CrossRef CAS PubMed.
- M. Huynh, D. K. Bediako and D. G. Nocera, J. Am. Chem. Soc., 2014, 136, 6002–6010 CrossRef CAS PubMed.
- X. Yan, C. Yuan, J. Bao, S. Li, D. Qi, Q. Wang, B. Zhao, T. Hu, L. Fan, B. Fan, R. Li, F. (Feng) Tao and Y.-X. Pan, Catal. Sci. Technol., 2018, 8, 3474–3483 RSC.
- S. De, J. Zhang, R. Luque and N. Yan, Energy Environ. Sci., 2016, 9, 3314–3347 RSC.
- T. Sun, L. Xu, Y. Yan, A. A. Zakhidov, R. H. Baughman and J. Chen, ACS Catal., 2016, 6, 1446–1450 CrossRef CAS.
- T. Zhou, Z. Cao, P. Zhang, H. Ma, Z. Gao, H. Wang, Y. Lu, J. He and Y. Zhao, Sci. Rep., 2017, 7, 46154 CrossRef CAS PubMed.
- F. Song, M. M. Busch, B. Lassalle-Kaiser, C.-S. Hsu, E. Petkucheva, M. Bensimon, H. M. Chen, C. Corminboeuf and X. Hu, ACS Cent. Sci., 2019, 5, 558–568 CrossRef CAS PubMed.
- H. Xiao, H. Shin and W. A. Goddard III, Proc. Natl. Acad. Sci. U. S. A., 2018, 115, 5872–5877 CrossRef CAS PubMed.
- B. Li, Q. Feng, F. Jiang, L. Peng and T. Liu, Int. J. Electrochem. Sci., 2019, 14, 4878–4890 CrossRef CAS.
- D. Drevon, M. Görlin, P. Chernev, L. Xi, H. Dau and K. M. Lange, Sci. Rep., 2019, 9, 1532 CrossRef PubMed.
- M. Görlin, P. Chernev, P. Paciok, C.-W. Tai, J. F. de Araújo, T. Reier, M. Heggen, R. Dunin-Borkowski, P. Strasser and H. Dau, Chem. Commun., 2019, 55, 818–821 RSC.
- M. Asnavandi, Y. Yin, Y. Li, C. Sun and C. Zhao, ACS Energy Lett., 2018, 3, 1515–1520 CrossRef CAS.
- M. K. Bates, Q. Jia, H. Doan, W. Liang and S. Mukerjee, ACS Catal., 2016, 6, 155–161 CrossRef CAS.
- Q. Zhang, C. Zhang, J. Liang, P. Yin and Y. Tian, ACS Sustainable Chem. Eng., 2017, 5, 3808–3818 CrossRef CAS.
- F. Dionigi and P. Strasser, Adv. Energy Mater., 2016, 6, 1600621 CrossRef.
- L. Trotochaud, S. L. Young, J. K. Ranney and S. W. Boettcher, J. Am. Chem. Soc., 2014, 136, 6744 CrossRef CAS PubMed.
- D. Friebel, M. W. Louie, M. Bajdich, K. E. Sanwald, Y. Cai, A. M. Wise, M.-J. Cheng, D. Sokaras, T.-C. Weng, R. Alonso-Mori, R. C. Davis, J. R. Bargar, J. K. Nørskov, A. Nilsson and A. T. Bell, J. Am. Chem. Soc., 2015, 137, 1305–1313 CrossRef CAS PubMed.
- M. S. Burke, L. J. Enman, A. S. Batchellor, S. Zou and S. W. Boettcher, Chem. Mater., 2015, 27, 7549–7558 CrossRef CAS.
- M. B. Stevens, C. D. M. Trang, L. J. Enman, J. Deng and S. W. Boettcher, J. Am. Chem. Soc., 2017, 139, 11361–11364 CrossRef CAS PubMed.
- R. G. Milazzo, S. M. S. Privitera, D. D'Angelo, S. Scalese, S. Di Franco, F. Maita and S. Lombardo, Int. J. Hydrogen Energy, 2018, 43, 7903–7910 CrossRef CAS.
- K. A. Owusu, L. Qu, J. Li, Z. Wang, K. Zhao, C. Yang, K. M. Hercule, C. Lin, C. Shi, Q. Wei, L. Zhou and L. Mai, Nat. Commun., 2017, 8, 14264 CrossRef PubMed.
- T. Jurkin, G. Štefanić, G. Dražić and M. Gotić, Mater. Lett., 2016, 173, 55–59 CrossRef CAS.
- H. Fan, X. Huang, O. Kähler, J. Folke, F. Girgsdies, D. Teschner, Y. Ding, K. Hermann, R. Schlögl and E. Frei, ACS Sustainable Chem. Eng., 2017, 5, 10900–10909 CrossRef CAS.
- M. Itagaki, Y. Hatada, I. Shitanda and K. Watanabe, Electrochim. Acta, 2010, 55, 6255–6262 CrossRef CAS.
- N.-T. Suen, S.-F. Hung, Q. Quan, N. Zhang, Y.-J. Xu and H. M. Chen, Chem. Soc. Rev., 2017, 46, 337–365 RSC.
- N. Li, D. K. Bediako, R. G. Hadt, D. Hayes, T. J. Kempa, F. von Cube, D. C. Bell, L. X. Chen and D. G. Nocera, Proc. Natl. Acad. Sci. U. S. A., 2017, 114, 1486–1491 CrossRef CAS PubMed.
- Z. K. Goldsmith, A. K. Harshan, J. B. Gerken, M. Vörös, G. Galli, S. S. Stahl and S. Hammes-Schiffer, Proc. Natl. Acad. Sci. U. S. A., 2017, 114, 3050–3055 CrossRef CAS PubMed.
Footnote |
| † Electronic supplementary information (ESI) available. See DOI: 10.1039/d0ra03856c |
| This journal is © The Royal Society of Chemistry 2020 |