 Open Access Article
Concentration–composition-isotherm for the ammonia absorption process of zirconium phosphate
Masakuni Yamaguchia,
Hiroki Miyaokaab and
Yoshitugu Kojima *ab
*ab
aGraduate School of Advanced Sciences of Matter, Hiroshima University, 1-3-1, Kagamiyama, Higashi-Hiroshima, Hiroshima 739-8530, Japan. E-mail: kojimay@hiroshima-u.ac.jp
bNatural Science Center for Basic Research and Development, Hiroshima University, 1-3-1, Kagamiyama, Higashi-Hiroshima, Hiroshima 739-8530, Japan
First published on 2nd June 2020
Abstract
The ammonia absorption process of zirconium phosphate has been studied using the concentration-composition-isotherm (CCI), X-ray diffraction and thermogravimetry-mass spectrometry (TG-MS). It was clarified that the equilibrium plateau concentration appeared due to two phase coexistence.
The world is shifting toward a society that reaches zero CO2 emissions due to environmental issues.1,2 Ammonia is a CO2 free fuel and easily liquefied by compression at 1 MPa and 298 K, and has a high gravimetric hydrogen density of 17.8 wt% and a highest volumetric hydrogen density that is above 1.5 times that of liquid hydrogen.3 Ammonia is also a burnable substance. Therefore, ammonia has advantages as a hydrogen and energy carrier for renewable energy. Unfortunately, ammonia is a deleterious substance. As the demand for ammonia increases, it is necessary to ensure safety. A large amount of water is used as an ammonia absorbent when leakage of ammonia occurs by accidents because of large solubility in water.4–6 However, ammonia water has the higher ammonia equilibrium vapour concentration.7 Many solid-state ammonia storage materials such as metal halides, complex hydrides, proto-based materials and porous materials have been studied to decrease the vapour concentration of ammonia.4
Recently we have focused on zirconium phosphate to suppress the release of ammonia vapour concentration because of stable in air and water. The large ammonia absorption capacity 10.2 wt% and low ammonia vapour concentration below 2 ppm have been reported.4 The low vapour concentration follows from acid–base reaction. X-ray diffraction indicated that zirconium phosphate undergoes a structural change by ammonia absorption.8,9 The large capacity of zirconium phosphate will be based on the structural phase transition by ammonia absorption. In general, ammonia pressure–composition-isotherm (PCI) has been used to characterize the phase transition behaviour by ammonia absorption.4 However, this phase transition cannot be observed by ammonia PCI measurement for zirconium phosphate because the practical lower detection limit of the measuring system is 1 Pa (10 ppm).10 The ammonia vapour concentration and the ammonia concentration in the water solution have similar values.4
In this study, ammonia absorption process of zirconium phosphate was investigated by using ammonia concentration–composition-isotherm (CCI), X-ray diffraction (XRD) and thermogravimetry-mass spectrometry (TG-MS).
We used zirconium phosphate (ZrP) with layer structure (α-zirconium phosphate, CZP-100 manufactured by Daiichi Kigenso Kagaku Kogyo Co., Ltd., Japan). Montmorillonite also has a layer structure. Unfortunately, the silicate layers of montmorillonite are dispersed in water and wasn't used as a reference. Therefore, insoluble proton-exchanged zeolite (HSZ-331HSA, silica/alumina ratio: 6 mol mol−1, specific surface area: 600 m2 g−1, particle size: 2–3 μm, manufactured by TOSOH Co., Ltd., Japan) was used as a reference. Those samples were used as received without further purification. The proton exchange capacities for ZrP and the zeolite are 6.6 mmol g−1 and 2.0 mmol g−1, respectively. The dilute ammonia water [200 (0.02 wt%) to 3000 ppm (0.3 wt%)] was prepared using the 10 wt% solution supplied from KENEI Pharmaceutical Co., Ltd. with ion-exchanged water.
The following experiment was performed to evaluate the ammonia storage capacity. ZrP was added to the ammonia water having various concentrations at about 298 K. The NH3 concentration and the potential of hydrogen (pH) were measured using ammonia meter (Orion Star A324 and Orion 9512 manufactured by Thermo Scientific Orion) and pH meter (CyberScan pH310 manufactured by EUTECH Ins.). Lower detection limit of the ammonia meter is 0.01 ppm.
Here, ammonia has two kinds of forms which are NH3 and NH4+ in ammonia water. NH3 concentration ([NH3]) was measured by the ammonia meter. Then, NH4+ concentration ([NH4+]) was calculated using the following equation:11
 | (1) |
| Cst = ([NH3]af + [NH4+]af − [NH3]be + [NH4+]be) × L | (2) |
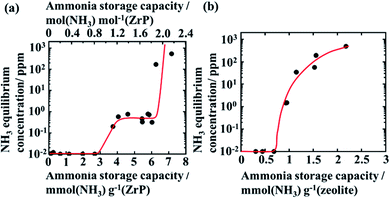
Fig. 1(a) shows the ammonia CCI of ZrP. The ammonia equilibrium concentration is lower than 0.01 ppm below the ammonia storage capacity about 3 mmol g−1 (1 mol NH3 per mol ZrP).
ZrP has the ammonia equilibrium plateau concentration of ca. 1 ppm in the range from 4–6 mmol g−1 (1 to 2 mol NH3 per mol ZrP), so we found that two phases coexist in this plateau region. The increase in the equilibrium concentration of ammonia from 3–4 mmol g−1 will be based on the appearance of Zr(NH4PO4)2·H2O phase. Subsequently, the ammonia equilibrium concentration drastically increases when ZrP is absorbed ammonia above 6 mmol g−1 (2 mol NH3 per mol ZrP). This capacity corresponds to the proton exchange capacity of ZrP (6.6 mmol g−1). It is suggested that ammonia is bonded to the proton site of ZrP and form ammonium ion below 6 mmol g−1 (2 mol NH3 per mol ZrP). Ammonia equilibrium concentration increases above 6 mmol g−1, since the proton site is absent.
According to ammonia CCI, we can interpret that two kinds of ammonia absorption sites exist in zirconium phosphate, which is shown in the formula,
| Zr(HPO4)2·H2O + NH3 ⇌ Zr(NH4PO4)(HPO4)·H2O | (3) |
| Zr(NH4PO4)(HPO4)·H2O + NH3 ⇌ Zr(NH4PO4)2·H2O | (4) |
Fig. 1(b) shows ammonia CCI of the zeolite as a reference. Ammonia equilibrium concentration is lower than 0.01 ppm below the ammonia storage capacity of 0.7 mmol g−1. The ammonia concentration increases with the storage capacity above this value. When ammonia is adsorbed up to the proton exchange capacity (2 mmol g−1), the ammonia concentration becomes about 500 ppm. The plateau concentration is not observed for the zeolite. This may be due to the fact that the zeolite has a porous structure and structural phase change does not occur by ammonia adsorption. Ammonia can be absorbed in ZrP by the structure change, because ZrP has interlayer spacing and interlayer proton for ammonia movement and the reaction.
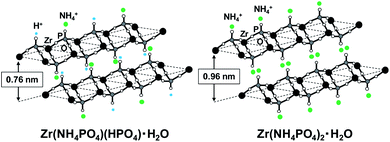
It has been reported that the Zr(HPO4)2·H2O and Zr(NH4PO4)2·H2O has two-dimensional crystals.8,9 Zr(HPO4)2·H2O and Zr(NH4PO4)2·H2O have the interlayer distance of 0.76 nm![[thin space (1/6-em)]](https://www.rsc.org/images/entities/char_2009.gif) 8 and 0.96 nm,9 respectively.
8 and 0.96 nm,9 respectively.
XRD measurement was made in order to characterize the structures of the ZrP before and after ammonia absorption. XRD patterns were recorded on a Bragg–Brentano diffractometer (Rigaku RINT-2500V manufactured by Rigaku Co.) and CuKα at tube current of 200 mA and tube potential of 40 kV. All samples were evacuated at room temperature for 20 hours to remove water from the surface of ZrP before XRD measurements. Each sample was pressed at a constant load on a glass holder before XRD measurement.
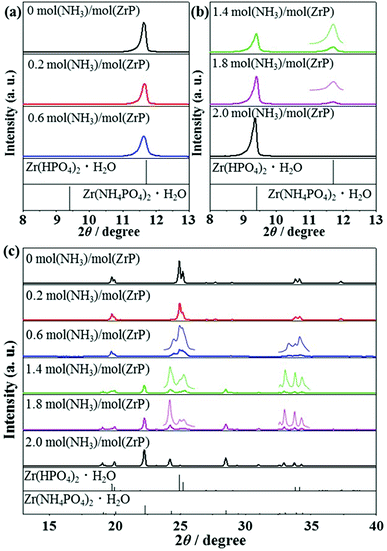
Fig. 2(a–c) show XRD patterns of ZrP, ZrP absorbed ammonia, Zr(HPO4)2·H2O (JCPDS 00-019-1489) and Zr(NH4PO4)2·H2O (JCPDS 01-071-1633) of the International Center for Diffraction Data (ICDD). Two peaks are observed for ZrP absorbed ammonia at 1.4 and 1.8 mol NH3 per mol ZrP as shown in Fig. 2(b). The peak around 2θ of 9.4° is the same as (002) diffraction of Zr(NH4PO4)2·H2O having an interlayer distance of 0.96 nm. Bragg peaks of the ZrP absorbed ammonia (1.4, 1.8 and 2.0 mol NH3 per mol ZrP) scattered to wide angle at 2θ of 13–40° include all diffraction peaks of Zr(NH4PO4)2·H2O (see Fig. 2(c)). We confirmed the presence of Zr(NH4PO4)2·H2O in the ZrP absorbed ammonia. The interplanar spacing calculated by the broad peaks around 2θ of 11.6° at 1.4 and 1.8 mol NH3 per mol ZrP is similar to the interlayer distance 0.76 nm of ZrP in Fig. 2(a). However, according to Fig. 1(a) in the range from 4–6 mmol g−1 (1 to 2 mol NH3 per mol ZrP) and eqn (4), the broad peak around 2θ of 11.6° can be explained by the presence of Zr(NH4PO4)(HPO4)·H2O having smaller crystallites and defects.13 The wide angle XRD patterns of the ZrP absorbed ammonia (1.4 mol NH3 per mol ZrP) show new shoulder at 2θ of 24.5° which are absent in ZrP and Zr(NH4PO4)2·H2O (Fig. 2(c)). This new shoulder may come from the structure of Zr(NH4PO4)(HPO4)·H2O. One possible explanation is that two phases observed by ammonia CCI are Zr(NH4PO4)(HPO4)·H2O and Zr(NH4PO4)2·H2O in the range from 1 to 2 mol NH3 per mol ZrP.
Fig. 2(a) shows the small angle XRD patterns of ZrP and ZrP absorbed ammonia at 0.2 and 0.6 mol NH3 per mol ZrP. Only one peak is observed for ZrP absorbed ammonia. XRD patterns of ZrP and ZrP absorbed NH3 are similar except for the XRD peaks at 2θ of 24.5° and 33.3° of the ZrP absorbed ammonia (0.6 mol NH3 per mol ZrP). The new peaks suggest the presence of Zr(NH4PO4)(HPO4)·H2O. These results can be understood by the coexistence of ZrP and Zr(NH4PO4)(HPO4)·H2O in the range from 0 to 1 mol NH3 per mol ZrP.
Schematic representation of the two crystal phases in the ammonia equilibrium plateau concentration is shown in Fig. 3. The ratio of these two phases will be changed depending on the ammonia storage capacity from 1 to 2 mol NH3 per mol ZrP.
 | ||
| Fig. 3 Schematic representation of two-phase co-existence in zirconium phosphate absorbed ammonia (NH3/ZrP: 1–2 mol mol−1). | ||
TG-MS measurement was carried out in order to obtain the desorbed gas, desorption temperature, and the weight loss of ZrP absorbed ammonia. TG-MS spectra were recorded on a TG (Rigaku plus RS-8200 manufactured by Rigaku Co.) and MS (M-QA200TS manufactured by Anelva Co.) in a flowing Ar gas (300 cm3 min−1) with a heating rate of 5 K min−1. All samples were evacuated at room temperature for 20 hours to remove water from the surface of ZrP before TG-MS measurements.
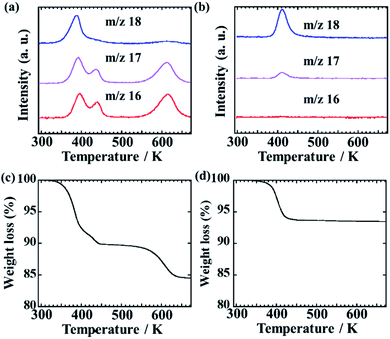
Fig. 4(a) and (b) show the temperature dependences of mass spectra with m/z 16 and 18 for Zr(NH4PO4)2·H2O and Zr(HPO4)2·H2O. Here, the signal of m/z 18 indicates a mainly water (H2O) and the signal of m/z 16 indicates an ammonia (NH2+). It is noted that m/z 16 is defined as ammonia rather than m/z 17 due to the water fragment ion effect on m/z 17. The peaks of m/z 16 for Zr(NH4PO4)2·H2O are observed around 390 K, 440 K and 610 K. It is indicated that Zr(NH4PO4)2·H2O desorbs ammonia around these temperatures. Then, the peak area of ammonia based on m/z 16 from 350 to 460 K is the same as the peak area of ammonia from 550 to 650 K. The peak area corresponds to the amount of ammonia desorption. Thus, Zr(NH4PO4)2·H2O is suggested to release 1 mol of ammonia from 350 to 460 K and 1 mol of ammonia from 550 to 650 K. The water desorption peaks of m/z 18 for Zr(NH4PO4)2·H2O and Zr(HPO4)2·H2O are observed around 390 K and 410 K, respectively. The peak shift toward lower temperature of Zr(NH4PO4)2·H2O may be based on the interaction between water and ammonia.
 | ||
| Fig. 4 MS spectra of (a) Zr(NH4PO4)2·H2O and (b) Zr(HPO4)2·H2O. Blue, purple and red lines are m/z 18, 17 and 16 curves. TG spectra of (c) Zr(NH4PO4)2·H2O and (d) Zr(HPO4)2·H2O. | ||
Fig. 4(c) and (d) show the TG curves of Zr(NH4PO4)2·H2O and Zr(HPO4)2·H2O. In Fig. 3(c), two main weight losses are observed in this process. The weight loss of Zr(NH4PO4)2·H2O from 330 to 460 K is 10.5 wt% and the weight loss from 550 to 650 K is 5.1 wt%. These weight losses come from the desorption of ammonia and water. In Fig. 3(d), the weight loss of Zr(HPO4)2·H2O is 6.0 wt% from 330 to 460 K. Thus, Zr(NH4PO4)2·H2O desorbs 1 mol water and 1 mol ammonia from 330 to 460 K, and desorbs 1 mol ammonia from 550 to 650 K by TG-MS measurement. Therefore, two kinds of ammonia absorption sites can exist in Zr(NH4PO4)2·H2O, as shown in the formula,
| Zr(NH4PO4)2·H2O → Zr(NH4PO4)(HPO4) + H2O + NH3 | (5) |
| Zr(NH4PO4)(HPO4) → Zr(HPO4)2 + NH3 | (6) |
We have demonstrated that the structural phase transition was observed using ammonia concentration–composition-isotherm (CCI) measurement for the first time. The structural phase transition was confirmed by the X-ray diffraction (XRD). In addition two kinds of ammonia absorption sites were observed by TG-MS. Therefore, CCI is a useful method for investigating structural phase transition as well as PCI.
Conflicts of interest
There are no conflicts to declare.Acknowledgements
This work was partially supported by Council for Science, Technology and Innovation (CSTI), Cross-ministerial Strategic Innovation Promotion Program (SIP), “energy carrier” (funding agency: JST). The author is greatly indebted to Professor T. Ichikawa of Hiroshima University for his help and discussion.Notes and references
- IPCC, Climate Change 2013: The Physical Science Basis Intergovernmental Panel on Climate Change, 2013, https://www.ipcc.ch/report/ar5/wg1/ Search PubMed.
- F. Birol, The Future of Hydrogen, Seizing today's opportuinities, report prepared by the IEA for the G20, 82-83, Japan, June 2019 Search PubMed.
- Y. Kojima, Int. J. Hydrogen Energy, 2019, 44, 18179 CrossRef CAS.
- Y. Kojima and M. Yamaguchi, Int. J. Hydrog. Energy, 2020, 45, 10233 CrossRef CAS.
- NIST Chemistry WebBook, SRD 69, Thermophysical Properties of Ammonia, http://webbook.nist.gov/cgi/fluid.cgi?ID=C7664417%26Action=Page Search PubMed.
- Chemical Engineering Handbook, rev. 6 Edition, The Society of Chemical Engineers, Maruzen Co., Ltd., Japan, 1999, p. 81. http://ebw.eng-book.com/pdfs/879040e33a05a0e5f1cb85580ef77ad1.pdf Search PubMed.
- E. P. Perman, J. Chem. Soc., 1903, 83, 1168 RSC.
- L. Sedlakova and V. Pekarek, J. Less-Common Met., 1966, 10, 130 CrossRef CAS.
- A. Clearfield and J. M. Troup, J. Phys. Chem., 1973, 77, 243 CrossRef CAS.
- H. Miyaoka, H. Miyaoka, T. Ichikawa, T. Ichikawa and Y. Kojima, Int. J. Hydrogen Energy, 2018, 43, 14486 CrossRef CAS.
- P. Atkins, T. Overton, J. Rourke, M. Weller and F. Armstrong, Shriver and Atkins' Inorganic chemistry, 5th revised edn, 2009 Search PubMed.
- W. M. Burke, J. Am. Chem. Soc., 1920, 42, 2500 CrossRef CAS.
- B. D. Cullity, Elements of X-ray Diffraction, Addison-Wesley Publishing Company, Inc., Reading, Massachusetts, USA, 2nd edn, 1977 Search PubMed.
| This journal is © The Royal Society of Chemistry 2020 |


