 Open Access Article
Design of a p–n heterojunction in 0D/3D MoS2/g-C3N4 composite for boosting the efficient separation of photogenerated carriers with enhanced visible-light-driven H2 evolution†
Biao Zhoua,
Bo Yang *a,
Muhammad Waqas
 a,
Ke Xiaoa,
Caizhen Zhu
 a and
Ling Wub
aCollege of Chemistry and Environmental Engineering, Shenzhen University, Shenzhen 518060, P. R. China. E-mail: boyang@szu.edu.cn
bShenzhen Senior High School, Shenzhen 518040, P. R. China
First published on 20th May 2020
Abstract
Constructing a 0D/3D p–n heterojunction is a feasible strategy for accelerating photo-induced charge separation and promoting photocatalytic H2 production. In this study, a 0D/3D MoS2/g-C3N4 (0D/3D-MCN) photocatalyst with a p–n heterojunction was prepared via a facile light-assisted deposition procedure, and the 3D spongy-like g-C3N4 (3D-CN) was synthesized through simple thermolysis of NH4Cl and melamine mixture. For comparison, 2D-MoS2 nanosheets were also embedded in 3D-CN by a solution impregnation method to synthesize a 2D/3D-MCN photocatalyst. As a result, the as-prepared 0D/3D-MCN-3.5% composite containing 3.5 wt% 0D-MoS2 QDs exhibited the highest photocatalytic H2 evolution rate of 817.1 μmol h−1 g−1, which was 1.9 and 19.4 times higher than that of 2D/3D-MCN-5% (containing 5 wt% 2D-MoS2 nanosheets) and 3D-CN, respectively. The results of XPS and electrochemical tests confirmed that a p–n heterojunction was formed in the 0D/3D-MCN-3.5% composite, which could accelerate the electron and hole movement in the opposite direction and retard their recombination; however, it was not found in 2D/3D-MCN-5%. This study revealed the relationship among the morphologies of MoS2 using g-C3N4 as a substrate, the formation of a p–n heterojunction, and the H2 evolution activity; and provided further insights into fabricating a 3D g-C3N4-based photocatalyst with a p–n heterojunction for photocatalytic H2 evolution.
1. Introduction
H2 is considered to be an ideal carbon-free and green clean fuel to resolve the problem of fossil fuel exhaustion and environment pollution.1,2 The photocatalytic decomposition of water into H2 is an eco-friendly and promising approach.3 In order to achieve the practical application of photocatalytic H2 production, a large number of efforts have been put into developing various semiconductor photocatalysts, such as TiO2, CdS and ZnO. Graphitic carbon nitride (g-C3N4), as a nontoxic n-type semiconductor photocatalyst, has gained wide attention because of its graphite-like structure and suitable bandgap position, as well as remarkable visible light response capability.4 However, the photocatalytic performance of bulk g-C3N4 is still unsatisfactory due to its low specific surface area and the rapid recombination of photocarriers. Therefore, various strategies for overcoming above defects have been attempted, such as nanostructure design,5,6 element doping,7 coupling with cocatalysts8,9 and constructing heterojunctions.10,11 Among these strategies, coupling with cocatalysts is a widely adopted method. In fact, the co-catalysts can increase the amount of reaction active sites; moreover, it can act as the mediator of electrons or holes to promote their separation.Generally, noble metals such as Pt, Au, Ag, etc., are often used as co-catalysts to decorate g-C3N4 for improving its photocatalytic performance.12 However, the cost and scarcity of precious metals restrict their use on a large scale. Recently, many cost-effective and noble-metal-free co-catalysts were reported to replace noble metal and also realized superior photocatalytic H2 productivity. Such as transition metal phosphides (Ni2P, Co2P, and FeP), they have attracted special attention because their properties are similar to precious metals. Zeng et al.13 used Ni12P5 nanoparticles to modify 2D g-C3N4 nanosheets by a facile solution impregnation approach, the prepared Ni12P5/g-C3N4 composite displayed excellent photocatalytic activity under visible light illumination, and its apparent quantum efficiency (AQE) was estimated as 4.67%. In addition, as a typical layered transition metal sulfide, molybdenum sulfide (MoS2) is often reported as photocatalyst for hydrogen evolution reaction (HER) due to its unique structure, high activity, earth-abundant composition and low-cost.14,15 The layered structure of MoS2 is similar to g-C3N4, which makes their lattice matching better, resulting in the growth of MoS2 on the surface of g-C3N4 easily.16 Besides, unsaturated Mo and S atoms at the exposed edges of MoS2 provide more active sites for H+ reduction.17,18 These excellent characteristics of MoS2 made it suitably to use as a non-noble metal co-catalyst.
On the other hand, shapes and structures of MoS2 also affected its photocatalytic activity remarkably. Shi et al.19 used 3.2 wt% 0D-MoS2 QDs coupling with 2D-g-C3N4 to synthesize 0D–2D MoS2/g-C3N4 photocatalyst by photo-reduction method, achieving the H2 evolution rate of 660 μmol h−1 g−1. Yuan et al.20 reported that 2D–2D MoS2/g-C3N4 composites synthesized by solvent-thermal method achieved its best photocatalytic H2 evolution rate as 1155 μmol h−1 g−1 when the amount of 2D-MoS2 nanosheets was 0.75 wt%. In addition, Liu et al.21 reported a 3D–2D MoS2/g-C3N4 composite containing 0.5 wt% 3D-MoS2 nanoflowers to carrier out H2 production under simulate solar irradiation, which achieved the highest photocatalytic H2 evolution rate of 78 μmol h−1 g−1. The above works indicated that the morphology of the MoS2 covering 2D g-C3N4 had the effect on photocatalytic H2 production. However, few reports revealed the comparative effects of MoS2 with different morphologies and deposition modes on the formation of heterojunction and the related charge transfer mechanism. In addition, to our knowledge, there was no report using NH4Cl as simple bubble template to synthesize 3D-high-porous g-C3N4 with spongy-like structure and then combing with MoS2 for photocatalytic H2 production. In fact, transforming g-C3N4 morphology from 2D structure to 3D porous is conducive to obtain larger specific surface area, higher mass transfer efficiency and more active sites.22,23
Inspired by the above consideration, this work used NH4Cl as simple bubble template to synthesize 3D g-C3N4 with spongy-like structure and named it as 3D-CN. Then, the 0D-MoS2 QDs and 2D-MoS2 nanosheets were first introduced on 3D-CN to construct 0D–3D structure (0D/3D-MCN) and 0D–2D structure (2D/3D-MCN) for visible-light-driven water splitting to produce H2, respectively. The 0D/3D-MCN composites were synthesized by a facile photo-assisted reduction method with mild preparation conditions;24,25 moreover, the morphology of MoS2 obtained by this method was nanodot instead of layers.26 The 2D/3D-MCN composites were obtained via a simple impregnation method. The photocatalytic H2 evolution efficiencies were compared among these prepared 0D/3D-MCN hybrids, 2D/3D-MCN and 3D-CN. Moreover, the XPS and photoelectrochemical analysis were conducted to deeply understand the charge transportation and then confirmed that a p–n heterojunction was constructed between 0D-MoS2 QDs and 3D-CN. In addition, the proper photocatalytic mechanisms for 0D/3D-MCN and 2D/3D-MCN were proposed and compared, which provided new insights into the relationship between the formation of p–n heterojunction and the morphology of photocatalysts.
2. Experiments section
2.1. Materials
All chemicals including melamine (C3H6N6, 99%), ammonium chloride (NH4Cl, 99.8%), ammonium tetrathiomolybdate ((NH4)2MoS4, 99%), sodium molybdate (Na2MoO4·2H2O, 99%), thiourea (CH4N2S, 99%), deionized-water, lactic acid, and anhydrous ethanol were purchased from Aladdin Reagent (Shanghai) Co. Ltd. without further treatment.2.2. Synthesis of 3D sponge-like g-C3N4 (3D-CN)
The 3D-CN was synthesized according to our previous research.12 Firstly, 1 g of melamine and 8 g of NH4Cl were fully ground for 20 min; then, the mixture was heated at 550 °C for 4 hours in air, and the heating speed was 2 °C min−1. After natural cooling, the sponge-like product with porous structure was obtained and named as 3D-CN. As comparison, the bulk g-C3N4 (BCN) was prepared only by calcinating the melamine under the same operation.2.3. Synthesis of 0D-MoS2 QDs/3D-CN (0D/3D-MCN)
The 0D/3D-MCN composites were prepared according to the reported method.27 The 0D-MoS2 QDs were obtained by the reduction of (NH4)2MoS4 under light irradiation. Firstly, 200 mg 3D-CN, 100 mL deionized-water, and 10 mL lactic acid were mixed under continuous stirring for 2 hours; then, a certain volume of 1 mg mL−1 (NH4)2MoS4 solution was added. The above mixed solution was vacuumed and irradiated (365 nm) for 2 hours. The products were obtained by centrifugation and washing by deionized water and ethanol three times. The added volume of (NH4)2MoS4 solution was 1.6, 4.8, 11.2, and 16 mL, respectively. The as-prepared samples were named as 0D/3D-MCN-X (X = 0.5%, 1.5%, 3.5%, and 5%), where X represented the percentage of the weight of the loaded MoS2 QDs.2.4. Synthesis of 2D-MoS2 nanosheets/3D-CN (2D/3D-MCN)
The 2D/3D-MCN composites were prepared by a facile solution impregnation method. A certain weight of bulk MoS2 were firstly dispersed in 10 mL ethanol solution with ultrasonic exfoliation for 2 hours to obtain 2D-MoS2 nanosheets. At the same time, 200 mg 3D-CN was added into 50 mL deionized-water at uninterrupted stirring for 2 hours. After that, the obtained 2D-MoS2 nanosheet solution was transferred into 3D-CN suspension with stirring 2 hours. The mass of the bulk MoS2 was 3, 7, 10 or 15 mg. The mixture was centrifuged and dried under 75 °C overnight. The obtained composites were named as 2D/3D-MCN-Y (Y = 1.5%, 3.5%, 5% and 7.5%) and were saved after drying, where Y represented the weight percentage of the loaded 2D-MoS2 nanosheets. The mentioned bulk MoS2 was synthesized according to another report.28 First, 100 mg of Na2MoO4·2H2O and 20 mg of CH4N2S were dissolved in 35 mL deionized water with stirring for 1 h. Then, the mixed solution heated as a hydrothermal reaction at 210 °C for 24 hours. The black precipitate undergone centrifugation and washing by deionized water and ethanol three times; and finally, the bulk MoS2 was obtained by drying at 75 °C overnight.2.5. Characterization instruments
The BET surface areas of the BCN and 3D-CN were conducted by N2 adsorption–desorption isotherms (ASAP 2460 Micromeritics, USA) method at 77 K. The X-ray diffraction (XRD, Bruker D8) using a Cu Kα radiation source was performed to characterize the crystal structure (the 2θ ranges of 10–80°). The UV-vis DRS was recorded by a UV-vis spectrophotometer instrument (UV-3600, Shimadzu, Japan) using BaSO4 as reflectance standard. The FT-IR spectrum was collected by an infrared spectrometer with KBr as blank sample (Affinity-1, Shimadzu, Japan, the wavenumber ranges of 4000–500 cm−1). The X-ray photoelectron spectroscopy (XPS, Escalab 250, USA) was analyzed by ThermoFisher's photoelectron spectrometer with Al Kα X-ray as radiation source. The morphologies and microstructures of the photocatalyst were observed by FE-SEM (JSM-7800F JEOL, Japan) and TEM, as well as high-resolution TEM (HR-TEM, JEM-2100 JEOL, Japan). The photoluminescence (PL) spectrum was performed at room temperature on the fluorescence spectrophotometer (F-7000, Hitachi, Japan) with the excitation wavelength of 325 nm.2.6. Photocatalytic H2 evolution experiments
The photocatalytic performance tests for H2 production were performed in a 150 mL quartz reactor, equipped with a closed Labsolar-III AG gas-circulation system. Typically, 50 mg of sample powder was dispersed in a 100 mL mixed solution containing 10 vol% of lactic acid (as hole scavenging agent), and followed with stirring for 1 h. The 300 W xenon lamp with a cut-off filter (λ > 400 nm) was selected as the irradiation source. Prior to each test, the reaction solution and reactor were degassed by a vacuum pump to completely remove the air, and the reactor was kept at 5 °C using circulating cooling water during every reaction. The generated H2 was calculated by a gas chromatograph with TCD (9790 II Fuli, Zhejiang), and the carrier gas was high-purity Ar. All the photocatalytic H2 production experiments were performed under the same condition.2.7. Photoelectrochemical performance test
The photoelectrochemical activity of as-prepared samples was examined on the CHI660E electrochemical workstation (Chenhua, Shanghai). A standard three-electrode cell was used by Pt plate as the counter electrode, Ag/AgCl electrode (3 M KCl as electrolyte) as the reference electrode, the fluorine-dope tin oxide (FTO) substrate with photocatalyst as working electrode; and the Na2SO4 (0.05 M, pH = 6.6) solution as the electrolyte. The working electrode was prepared as follows: 2 mg photocatalyst powder, 200 μL ethanol, and 10 μL Nafion were mixed by sonication for 15 min. Then, 50 μL suspension was dispersed uniformly on a clean 1 cm × 1 cm FTO substrate, followed by drying at 80 °C for 10 hours. The light source of transient photocurrent responses experiments was a 300 W xenon lamp (λ > 400 nm). The electrochemical impedance spectroscopy (EIS) analysis of as-prepared sample was recorded on the frequency range of 0.1–105 Hz with 0.135 V bias potential. The Mott–Schottky (M–S) curve was measured in the dark and the frequency was 1000 Hz.3. Results and discussion
3.1. Formation, crystal structure and morphology
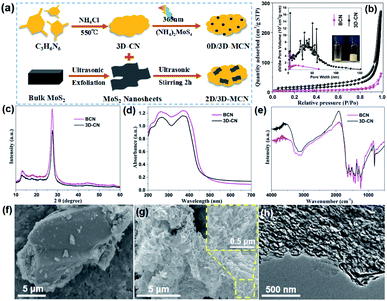
The synthetic process of the 0D/3D-MCN and 0D/3D-MCN composite is briefly displayed in Fig. 1a. Firstly, to confirmed that our prepared g-C3N4 (3D-CN) possessed 3D porous structure, the SBET and pore-size distribution of 3D-CN and BCN were measured by BET instrument. As exhibited in Fig. 1b the BET curves of 3D-CN and BCN show the unique isotherm (between type II and IV) with a distinct hysteresis loops, which indicates that the mesopores and macropores existed in 3D-CN and BCN. Meanwhile, the 3D-CN shows the higher adsorption capability at the same P/P0 compared with BCN, indicating that there are so many meso and macroporous in 3D-CN. This result is good consistent with the pore-size distribution (inset of Fig. 1b) of 3D-CN. Specifically, the SBET of 3D-CN is 60.41 m2 g−1, which is about 4.25 times higher than that of BCN (14.22 m2 g−1). Besides, for further testifying that the 3D-CN is highly porous, a comparison is performed as inset in Fig. 1b, which shows that the volume of 3D-CN was about 5 times of that of BCN under the same weight (20 mg). This result is good agreement with the results of SBET. Subsequently, the crystal structures of 3D-CN and BCN were obtained by XRD test. As shown in Fig. 1c, both 3D-CN and BCN exhibit two distinct diffraction peaks at 13.0° and 27.5°, which correspond to the (100) and (002) crystal plane of typical g-C3N4 (JCPDS no. 87-1526), respectively. Generally, the in-plane ordering of the tri-s-triazine units in g-C3N4 leads to the (100) peak; and interlayer stacking of conjugated aromatic results in the strong (002) peak.29 The 3D-CN shows the same position of the diffraction peaks with BCN, indicating that its crystal structure was unchanged. However, the intensity of (002) peak of the 3D-CN decrease significantly compared to that of BCN, the decrease of intensity indicates that the length of interlayer periodicity of 3D-CN is reduced,30 and also implying that the 3D porous as a new structure could be formed.In addition, the optical properties of 3D-CN and BCN were evaluated according to the UV-vis DRS to reveal the relationship between morphology and structure of g-C3N4 and light-adsorption capability. As displayed in Fig. 1d, an obvious blue-shift for 3D-CN is observed compared with that of BCN. This could be attributed to the formation of 3D porous structure, leading to the gradual decrease of interlayer periodicity length and weakening of the π-conjugated system, thus narrowing their visible-light responsive range and enlarging the bandgap.31 However, compared to the BCN, the 3D-CN shows the enhancement of the capability of visible-light absorption (λ > 460 nm), which could result from the formation of 3D porous structure, facilitating the capture and scattering of incident-photons.32 The optical bandgap value of 3D-CN and BCN are obtained according to the Kubelka–Munk method (the bandgap energy (Eg) vs. the photo energy (hν)), and estimated to be approximately 2.83 and 2.79 eV, respectively (in Fig. S1†). Furthermore, the FT-IR spectra of 3D-CN and BCN are showed in Fig. 1e to analyze their molecular structure. It can be clear seen that there is no difference in the position of peaks except for their intensity, indicating that the functional group structure of 3D-CN is the same as that of BCN. The morphology and microstructure of the 3D-CN and BCN are directly observed by the FE-SEM and TEM. The SEM image of the BCN is showed in Fig. 1f, the BCN exhibits stone-like morphology and its size is more than 10 μm. Unlike the lumpy structure of BCN, 3D-CN clearly shows 3D porous spongy-like structure after adding NH4Cl as a foaming agent (Fig. 1g), this special structure enabled H2O molecule to contact more active sites, and thus gained more photo-generated carriers to efficiently reduce H+.17,18 Additionally, The TEM image of 3D-CN (Fig. 1h) further proves that a lot of meso and macroporous structures existed in 3D-CN with pore size around 100 nm. Based on the analysis of BET, XRD, UV-DRS, FT-IR, FE-SEM and TEM, it could be confirmed that the 3D-CN with porous spongy-like structure was prepared successfully by the introduction of NH4Cl as gaseous template; and the visible light adsorption capability of 3D-CN was enhanced during the morphology transformation of BCN to 3D-CN; moreover, its crystal structure and the surface functional groups were not changed.
Subsequently, to further enhance the photocatalytic activity of 3D-CN, the 0D-MoS2 QDs and 2D-MoS2 nanosheets were introduced as a co-catalyst, respectively. Fig. 2a shows the TEM image of the 0D/3D-MCN-3.5% composite (the 3.5 wt% 0D-MoS2 QDs loading on 3D-CN), from which it can be found that the composite exhibits the similar shape to pristine 3D-CN and the 0D-MoS2 QDs are homogenously dispersed on the 3D-CN, implying that the structure of 3D-CN unchanged after introduction of MoS2 QDs. Meanwhile, some typical lattice fringe belonging to the (100) planes of the MoS2 QDs are observed in HR-TEM of the 0D/3D-MCN-3.5% composite (see Fig. 2b), and their lattice spacing is measured to be 0.27 nm.33 This result indicated that the 0D-MoS2 QDs was successfully loaded on 3D-CN. In addition, as a comparison, the TEM and HR-TEM image of the 2D/3D-MCN-5% composite are also displayed. As shown in Fig. 2c, some typical structure of MoS2 nanosheets are detected, and its interlayer distance is further observed in Fig. 2d as 0.61 nm, which corresponded to the (001) plane of the MoS2. This result suggested that the bulk MoS2 was successfully peeled to 2D lamellar structure and the 2D-MoS2 nanosheets were successfully introduced to 3D-CN.20 Besides, the morphology of 2D/3D-MCN-5% composite remained the same as that of 3D-CN.
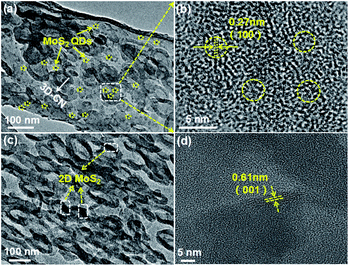 | ||
| Fig. 2 (a) TEM and (b) HR-TEM image of 0D/3D-MCN-3.5%, (c) TEM and (d) HR-TEM image of 2D/3D-MCN-5%. | ||
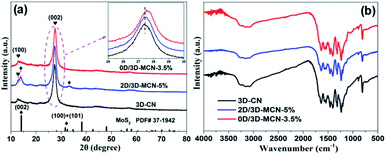
The XRD patterns of 3D-CN, 2D/3D-MCN and 0D/3D-MCN are showed in Fig. 3a. Two apparent typical diffraction peaks (around 13.0° and 27.5°) of 3D-CN are observed in all samples, indicating that the introduction of the MoS2 did not cause the obvious change of 3D-CN structure. However, it is worth to notice that the position of characteristic peak at 27.5° for 0D/3D-MCN-3.5% composite appears slightly right shift compared with that of 3D-CN. But it does not happen in 2D/3D-MCN-5% composite. This phenomenon suggested that there was a stronger interaction existed in the contact interface of 3D-CN and 0D-MoS2 QDs in 0D/3D-MCN-3.5% composite.19 Apart from strong diffraction peaks for 3D-CN are exhibited in the spectrogram of 2D/3D-MCN-5%, some tiny peaks for 2D-MoS2 nanosheets are also observed. However, the peaks for 0D-MoS2 QDs are not detected in spectrogram of 0D/3D-MCN-3.5%, which might be attributed to that the 0D-MoS2 QDs possessed low crystallinity and highly dispersion. The XRD results were well in accordance with the above TEM and HR-TEM results.
To further illustrate the surface structure and stability of the photocatalyst, the FT-IR spectra of 3D-CN, 2D/3D-MCN-5% and 0D/3D-MCN-3.5% are showed in Fig. 3b. The spectra for all samples exhibit similar shapes, indicating no change for the chemical functional groups of 3D-CN after introduction of the MoS2. Specifically, the wavenumber at 3100–3300 cm−1 could be allotted to the stretching vibrations of N–H and O–H bands, which belong to uncondensed NH2 and NH groups as well as the slight adsorbed H2O molecules.25 Another a series of adsorption peaks at the ranges of 1000–1700 cm−1 could be assigned to the C![[double bond, length as m-dash]](https://www.rsc.org/images/entities/char_e001.gif) N and C–N stretching vibration of aromatic modes and the repetitive unites of heptazine, respectively. Besides, the distinct sharp peak at around 808 cm−1 is detected, which pertained to the bending vibration of triazine units.34 In addition, no peaks related to S are detected in all composites, indicating that the sulfur was mainly presented in form of MoS2, rather than doped into 3D-CN.35
N and C–N stretching vibration of aromatic modes and the repetitive unites of heptazine, respectively. Besides, the distinct sharp peak at around 808 cm−1 is detected, which pertained to the bending vibration of triazine units.34 In addition, no peaks related to S are detected in all composites, indicating that the sulfur was mainly presented in form of MoS2, rather than doped into 3D-CN.35
The XPS analysis was used to further confirm whether the MoS2 was successfully loaded on 3D-CN. The XPS total spectra of 0D/3D-MCN-3.5% and 2D/3D-MCN-5% are showed in Fig. S2,† where the only signals of C, N, O, Mo and S are detected, indicating that the MoS2 existed in this two composites. Besides, the presence of O suggested that the composites were easily affected by H2O molecules. Meanwhile, the signals of Mo and S in 0D/3D-MCN-3.5% are weaker than 2D/3D-MCN-5%, which might be affected by the degree of distribution and crystallization of 0D-MoS2 QDs. This result was good agreement with XRD analysis. In addition, to further observe the chemical states of the related elements, the high-resolution C 1s, N 1s, Mo 3d, and S 2p XPS spectra were examined. As shown in Fig. 4a, there are two obvious peaks located at 284.1 and 287.7 eV for 0D/3D-MCN-3.5% in C 1s spectrum, which are assigned to graphite sp2 C–C and sp2 N–C![[double bond, length as m-dash]](https://www.rsc.org/images/entities/char_e001.gif) N for aromatic ring, respectively.36 The N 1s spectrum of 0D/3D-MCN-3.5% is exhibited in Fig. 4b, four typically peaks located at 398.5, 399.4, 401.0 and 404.3 eV are marked out, which are assigned to sp2 C
N for aromatic ring, respectively.36 The N 1s spectrum of 0D/3D-MCN-3.5% is exhibited in Fig. 4b, four typically peaks located at 398.5, 399.4, 401.0 and 404.3 eV are marked out, which are assigned to sp2 C![[double bond, length as m-dash]](https://www.rsc.org/images/entities/char_e001.gif) N–C in triazine units, tertiary N (N–(C)3), amino function C–N–Hx (x = 1, 2), and the charge effect, respectively.37 Compared with 3D-CN, the position of C 1s and N 1s peaks for 0D/3D-MCN-3.5% show about −0.5 eV movement in binding energy. However, there is almost no change for peaks position in 2D/3D-MCN-5%. This phenomenon indicated that the chemical state for the 3D-CN in 0D/3D-MCN-3.5% was different with that of the 2D/3D-MCN-5%. Then, for further detecting the chemical state of MoS2 in 0D/3D-MCN-3.5%, the Mo 3d and S 2p spectra were showed in Fig. 4c and d. From the Mo 3d spectrum, two distinct peaks located at 229.8 and 232.8 eV are marked out for 0D/3D-MCN-3.5%, they could be ascribed to the Mo 3d5/2 and Mo 3d3/2, respectively. This results indicated that the Mo existed in 0D/3D-MCN-3.5% composite was +4,21 and confirmed the 0D-MoS2 QDs was successfully prepared by the photoirradiation reduction process.38 Fig. 4d shows the S 2p spectrum for 0D/3D-MCN-3.5%, in which two peaks, located at 163.9 and 162.5 eV, are vested to S 2p3/2 and S 2p1/2, respectively.39 Similarly, compared with bulk MoS2, the position of Mo 3d and S 2p peaks for 0D/3D-MCN-3.5% also appear the movement of binding energy about 0.1–0.3 eV. However, there is also no movement in 2D/3D-MCN-5%. Generally, the movement of the binding energy is related to the electron density. The positive shift represents the decrease of the electron density; conversely, the electron density increase.40 Based on this theory and the motion of the binding energy of C 1s, N 1s, Mo 3d, and S 2p, there was an efficient migration of electrons from 0D-MoS2 QDs to 3D-CN for 0D/3D-MCN-3.5% composite, which was beneficial to form a weak internal electric field in their contact interface. Therefore, the migration of electrons and holes in opposite directions was promoted, and the recombination of electron–hole pairs could be delayed in 0D/3D-MCN-3.5% composite.
N–C in triazine units, tertiary N (N–(C)3), amino function C–N–Hx (x = 1, 2), and the charge effect, respectively.37 Compared with 3D-CN, the position of C 1s and N 1s peaks for 0D/3D-MCN-3.5% show about −0.5 eV movement in binding energy. However, there is almost no change for peaks position in 2D/3D-MCN-5%. This phenomenon indicated that the chemical state for the 3D-CN in 0D/3D-MCN-3.5% was different with that of the 2D/3D-MCN-5%. Then, for further detecting the chemical state of MoS2 in 0D/3D-MCN-3.5%, the Mo 3d and S 2p spectra were showed in Fig. 4c and d. From the Mo 3d spectrum, two distinct peaks located at 229.8 and 232.8 eV are marked out for 0D/3D-MCN-3.5%, they could be ascribed to the Mo 3d5/2 and Mo 3d3/2, respectively. This results indicated that the Mo existed in 0D/3D-MCN-3.5% composite was +4,21 and confirmed the 0D-MoS2 QDs was successfully prepared by the photoirradiation reduction process.38 Fig. 4d shows the S 2p spectrum for 0D/3D-MCN-3.5%, in which two peaks, located at 163.9 and 162.5 eV, are vested to S 2p3/2 and S 2p1/2, respectively.39 Similarly, compared with bulk MoS2, the position of Mo 3d and S 2p peaks for 0D/3D-MCN-3.5% also appear the movement of binding energy about 0.1–0.3 eV. However, there is also no movement in 2D/3D-MCN-5%. Generally, the movement of the binding energy is related to the electron density. The positive shift represents the decrease of the electron density; conversely, the electron density increase.40 Based on this theory and the motion of the binding energy of C 1s, N 1s, Mo 3d, and S 2p, there was an efficient migration of electrons from 0D-MoS2 QDs to 3D-CN for 0D/3D-MCN-3.5% composite, which was beneficial to form a weak internal electric field in their contact interface. Therefore, the migration of electrons and holes in opposite directions was promoted, and the recombination of electron–hole pairs could be delayed in 0D/3D-MCN-3.5% composite.
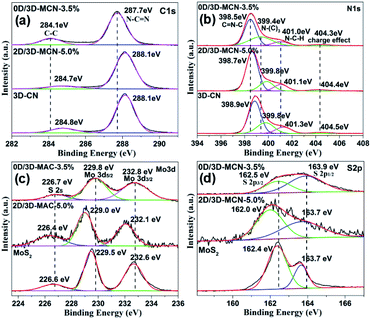 | ||
| Fig. 4 The high-resolution XPS spectra of (a) C 1s, (b) N 1s, (c) Mo 3d, and (d) S 2p in 0D/3D-MCN-3.5%, 2D/3D-MCN-5%, 3D-CN, and bulk MoS2, respectively. | ||
The UV-vis-DRS analysis of 3D-CN, 0D/3D-MCN-X, and 2D/3D-MCN-5% samples was performed to investigate their optical characteristics. As showed in Fig. 5a, the maximum light absorption edge for all samples are >460 nm. Additionally, the introduction of MoS2 can significantly enhance the visible light absorption capability of 3D-CN. Meanwhile, with the increase of 0D-MoS2 QDs amount, the response capability of the 0D/3D-MCN-X composites are enhanced in both the ultraviolet and visible light regions. Because of the black or dark color of MoS2, it could increase the background absorption.41 Therefore, it might be beneficial to generate more photoinduced carriers, resulting in higher photocatalytic performance. Besides, the spectrum of 2D/3D-MCN-5% shows slight difference compared with that of 0D/3D-MCN-X in visible light absorption region. There is an apparent arch located at between 600 and 700 nm in the spectrogram of 2D/3D-MCN-5%, which is related to the octahedral phase of MoS2.42 However, it is no detected in 0D/3D-MCN-X composites. This discovery was consistent with the above XRD results. In addition, base on the Kubelka–Munk method, the bandgap energy of 0D/3D-MCN-3.5% and 2D/3D-MCN-5% (Fig. 5b) are calculated to be 2.76 and 2.81 eV, respectively. The Eg of 0D/3D-MCN-3.5% is less than that of 2D/3D-MCN-5%, which could due to the interaction between 0D-MoS2 QDs and 3D-CN was stronger than that of 2D-MoS2 nanosheets and 3D-CN. Usually, the narrower bandgap could be beneficial to light absorption and more electron–hole pairs generation, thus the photocatalytic performance could be enhanced.43
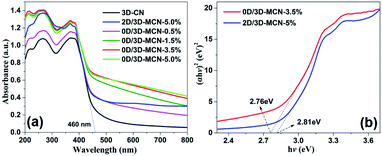 | ||
| Fig. 5 (a) UV-vis DRS spectra of 3D-CN, 2D/3D-MCN-5%, and 0D/3D-MCN with varying contents of MoS2, (b) the plots of the (αhν)2 vs. hν for 0D/3D-MCN-3.5% and 2D/3D-MCN-5%. | ||
3.2. Activity and stability of photocatalyst
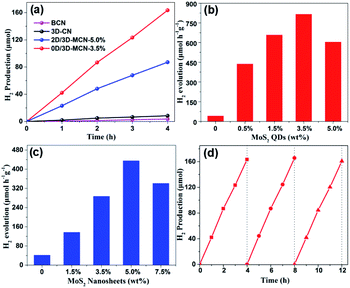
To explain whether the morphologies of MoS2 had effects on the photocatalytic performance of 3D-CN, the 0D/3D-MCN-X (X = 0.5%, 1.5%, 3.5%, 5%) composites, 2D/3D-MCN-5% hybrid, and 3D-CN were tested by photocatalytic H2 generation experiment. As shown in Fig. 6a, the H2 evolution experiments were conducted under visible light irradiation (λ > 400 nm) and 10 vol% lactic acid as hole acceptor. Compared with that of BCN, the H2 evolution rates of g-C3N4 was obviously enhanced after adding NH4Cl as gas template to fabricate 3D porous structure (3D-CN). The activity of 3D-CN (42.15 μmol h−1 g−1) is about 2.45 times higher than that of BCN (17.18 μmol h−1 g−1). However, the H2 evolution performance of single 3D-CN presented still a relatively low level and needed to be improved. After modifying the 3D-CN with 0D-MoS2 QDs or 2D-MoS2 nanosheets, the photocatalytic performance of 3D-CN was remarkably enhanced again. As shown in Fig. 6b and c, the H2 evolution rates change with the amounts of 0D-MoS2 QDs and 2D-MoS2 nanosheets. When 3.5 wt% 0D-MoS2 QDs or 5 wt% 2D-MoS2 nanosheets was introduced to 3D-CN, the 0D/3D-MCN-3.5% and 2D/3D-MCN-5% show the highest H2 evolution rate of 817.1 μmol h−1 g−1 (Fig. 6b) and 435.5 μmol h−1 g−1 (Fig. 6c), respectively. The activity of the former was approximately 1.88 and 19.4 times higher than that of the latter and 3D-CN. Besides, when the amount of 0D-MoS2 QDs and 2D-MoS2 nanosheets were more than 3.5 wt% and 5 wt%, respectively, the rate of H2 production would decrease with the amount of MoS2 increasing. This might be due to that the excess black MoS2 covering 3D-CN surface inhibited the incident light absorption of 3D-CN.25 In fact, the 0D/3D-MCN-3.5% showed the better photocatalytic H2 evolution activity than 2D/3D-MCN-5%, which could be attributed to the reasons as follows: (1) the 0D-MoS2 QDs could be dispersed more evenly on the porous structure of 3D-CN than 2D-MoS2 nanosheets, which was beneficial to the muti-point transfer of electrons on the interface of 3D-CN rather than limited sites; (2) the results of XRD and XPS showed that the interaction of 0D/3D (MoS2/3D-CN) was stronger than that of 2D/3D, and a weak internal electric field was formed in 0D/3D-MCN-3.5%, which could impel the electrons and holes to transfer in opposite direction. Hence, the 0D/3D-MCN-3.5% possessed the faster and more efficient separation rate between photo-generated electrons and holes, which made it to have the better photocatalytic performance under visible light irradiation. Besides, the photocatalytic H2 production activity of the other g-C3N4-based photocatalysts reported recently is displayed in Table S1† including our results of 0D/3D-MCN-3.5%. The results show that the photocatalytic performance of 0D/3D-MCN-3.5% was better than that of the MoS2/g-C3N4 composites (0D/2D, 2D/2D, and 2D/3D) listed in Table. S1.† In addition, the stability test of 0D/3D-MCN-3.5% was measured by three consecutive cycles of photocatalytic H2 production under the same operation method. As shown in Fig. 6d, the H2 production rate of 0D/3D-MCN-3.5% shows a negligible decrease after 12 hours reaction, suggesting the high physical (inherent structure) and chemical stability of 0D/3D-MCN-3.5% composite during photocatalytic reaction.3.3. Photocatalytic mechanism
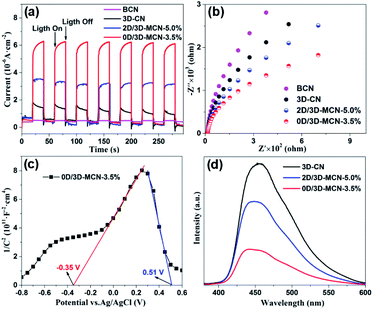
The photocatalytic mechanism about the charge transfer and separation efficiency of the interface between 3D-CN and (0D or 2D) MoS2 was explored by electrochemical characterization including transient photocurrent (i–t) curve, electrochemical impedance spectroscopy (EIS), and Mott–Schottky (M–S) curve. Fig. 7a displays the photocurrent i–t curves of BCN, 3D-CN, 2D/3D-MCN-5% and 0D/3D-MCN-3.5% under visible light illumination (>400 nm). The 0D/3D-MCN-3.5% composite exhibits the highest photocurrent density, almost twice as high as 2D/3D-MCN-5%, implying that the 0D/3D-MCN-3.5% possessed more efficient transfer and separation ability of interfacial photoinduced charge than 2D/3D-MCN-5%. These results were good in agreement with the increase of the photocatalytic H2 yield.Moreover, the EIS test was used to further acquire the interfacial charge transport resistances under light illumination. As shown in Fig. 7b, the arc radius for 0D/3D-MCN-3.5% is much smaller than those of other samples, implying that a smaller charge transfer resistance existed in the contact interface of 0D/3D MoS2/3D-CN composite.44 Generally, the arc radius is positively correlated with the resistance of the charge transfer, which can be affected by the physical properties of interface in composite. Hence, the smallest arc radius for 0D/3D-MCN-3.5% could be attributed to the formation of the internal electric field at the contact interface of 0D-MoS2 QDs and 3D-CN, which can accelerate the migration of the photoinduced carriers at interface, and thus reduced the charge transfer resistance.
Additionally, the M–S test was adopted to further reveal the interface characteristics (0D/3D and 2D/3D MoS2/3D-CN), and the type of semiconductor as well as to calculate the flat band potential (Efb). As shown in Fig. S3,† the Efb of 3D-CN is −1.42 V vs. Ag/AgCl (−1.22 V vs. NHE), which was calculated by the intercept of the plot tangents on X-axis. Usually, the slope of the tangent lines is related to the type of semiconductor; and the positive slope means that the semiconductor is n-type. Meanwhile, the conduction band (ECB) position of n-type semiconductor is generally lower than the Efb, about 0.3 V. Hence, the 3D-CN is an n-type semiconductor, and its ECB is estimated to be −1.52 V vs. NHE. Besides, according to the following equation: EVB = Eg + ECB (where Eg is bandgap energy, obtained by UV-vis DRS analysis), the EVB of 3D-CN could be calculated as 1.31 V vs. NHE. In addition, as shown in Fig. 7c, there is a distinct signal inverted “V-shape” appearing in M–S curve of 0D/3D-MCN-3.5%, indicating the formation of p–n heterojunction located at the contact interface between 0D-MoS2 QDs and 3D-CN. However, it does not appear in M–S curve of 2D/3D-MCN-5% (in Fig. S4†), indicating that no p–n heterojunction formed. Based on the distinction of the M–S curves for 0D/3D-MCN-3.5% and 2D/3D-MCN-5%, it could be seen that the morphologies of MoS2 affected the formation of heterojunction and further changed the efficiency of interfacial charge transfer. Therefore, combined with XPS analysis (the migration of electrons from 0D-MoS2 QDs to 3D-CN), an internal electrical field (Ein) would be established with a direction from p-type 0D-MoS2 to n-type 3D-CN in 0D/3D-MCN-3.5%, leading to more efficient separation of photogenerated electrons and holes. The efficient separation of photoinduced carriers is a main contributor to the enhancement of photocatalytic H2 production.
At the same time, the photoluminescence (PL) spectrum was applied to further confirm that the 0D/3D-MCN-3.5% possessed outstanding efficiency of the charge separation. As demonstrated in Fig. 7d, the 3D-CN exhibits the highest PL intensity. After introducing the (0D or 2D) MoS2, the PL intensity of 3D-CN decreases significantly; and the 0D/3D-MCN-3.5% shows the lower PL intensity compared with that of 2D/3D-MCN-5%, indicating the lower recombination rate of electron–hole pairs for 0D/3D-MCN-3.5%. This result was in good agreement with the above results of the photo-generated H2 efficiency and EIS.
Base on the results of UV-vis DRS, M–S, and XPS analysis, we proposed the possible photocatalytic mechanisms for 0D/3D-MCN and 2D/3D-MCN composites. As presented in Fig. 8, when 0D/3D-MCN composite was exposed to visible light irradiation (λ > 400 nm), the 3D-CN and 0D-MoS2 QDs could absorb the energy of Photon (hν, and hν > Eg) and be excited, simultaneously; then, the electrons in the valence band (VB) of 3D-CN and 0D-MoS2 QDs would migrate to their corresponding conduction band (CB), and the holes generated in the valence band, immediately. Subsequently, the photoinduced electrons in the conduction band of 0D-MoS2 QDs can be easily transferred to the conduction band of 3D-CN and then participate in the reaction of H+ reduction according to the mechanism of the charge movement (from M–S and XPS analysis) and the matched bandgap structure; and meanwhile, the holes remained in the valence band of 3D-CN would migrate to the valence band of 0D-MoS2 QDs for joining with lactic acid. Hence, the electrons and holes in space was separated easily, which could effectively prevent the rapid recombination of electron–hole pairs in 0D/3D-MCN composite. Whereas, the 2D/3D-MCN composite displayed different mechanism of charge transfer. According to the reported energy band structure of 2D-MoS2 nanosheets,20 its conduction-band position was lower than that of 3D-CN; and, as illustrated in Fig. 8, its valence band was higher than that of 3D-CN. Therefore, due to the above potential values of 2D-MoS2 nanosheets, the photo-generated holes and electrons would be easily gathered in its valence and conduction band to occur recombination. This type of charge transfer mechanism failed to achieve the separation of the electrons and holes in space, resulting in the probability of electron/hole recombination would increase. Therefore, the photocatalytic H2 evolution activity of 0D/3D-MCN-3.5% was superior to that of 2D/3D-MCN-5%.
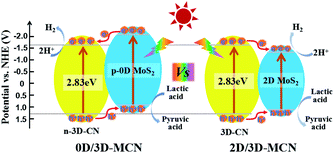 | ||
| Fig. 8 Proposed photocatalytic H2 production mechanisms for the 0D/3D-MCN-3.5% and 2D/3D-MCN-5% composites under visible light irradiation. | ||
According to the results of characterization and proposed mechanism, the reasons of enhanced photocatalytic activity for 0D/3D-MCN-3.5% composite could be summarized as the follows. Firstly, 3D-CN possessed highly porous spongy-like structure, which enabled H2O molecules to access more active sites, and enhanced the optical responsive capability in visible region as well as allowed 0D-MoS2 QDs to disperse uniformly. Secondly, the 0D-MoS2 QDs as co-catalyst were introduced to 3D-CN, which not only enhanced the light absorption of 3D-CN in visible region again, but also accelerated the separation of the charges. Moreover, after coupling 3D-CN with 0D-MoS2 QDs, a 0D/3D p–n heterojunction was formed, which was beneficial to the migration of the electrons and holes in opposite directions and meanwhile restrained their recombination. Therefore, 0D/3D-MCN-3.5% composite had the higher photocatalytic H2 production activity compared to that of 2D/3D-MCN-5% and 3D-CN.
4. Conclusions
In summary, g-C3N4 with three-dimension porous sponge-like structure had been successfully synthesized via simply co-pyrolysis of melamine and NH4Cl precursor. The specific surface area and light responsive capacity in visible region of 3D-CN were both dramatically enhanced compared with that of bulk g-C3N4. Then, the different morphologies of MoS2 (0D-MoS2 QDs and 2D-MoS2 nanosheets) as co-catalyst were loaded on 3D-CN for photocatalytic H2 production. The 0D/3D-MCN composite containing 3.5 wt% 0D-MoS2 QDs was prepared by facile in situ photodeposition method, which presented the highest photocatalytic activity of 817.1 μmol g−1 h−1 in H2 evolution. It was 1.9 and 19.4 times higher than that of 2D/3D-MCN-5% and 3D-CN, respectively. In addition, the XPS and electrochemical tests demonstrated that a p–n heterojunction was formed in 0D/3D-MCN-3.5% composite, which could force the electrons and holes to move in opposite direction. Therefore, the 0D/3D-MCN-3.5% composite possessed the highest separation efficiency of carriers in photocatalytic H2 production in this study. In addition, the possible photocatalytic mechanisms for 0D/3D-MCN and 2D/3D-MCN composite were proposed. This work confirms that the morphology of MoS2 can affect the photocatalytic H2 evolution performance and the formation of heterojunction; moreover, the 0D/3D MoS2/g-C3N4 with a p–n heterojunction exhibits great potential in visible-light-driven H2 evolution.Conflicts of interest
There are no any financial conflicts to declare.Acknowledgements
This study was supported by the National Natural Science Foundation of China (21777106, 51708356), and the National Major Science & Technology Program for Water Pollution Control & Treatment (2017ZX07202).References
- J. Liu, Y. Liu, N. Liu, Y. Z. Han, X. Zhang, H. Huang, Y. Lifshita, S. T. Lee, J. Zhong and Z. H. Kang, Science, 2015, 47, 970–974 CrossRef.
- X. C. Wang, K. Maeda, A. Thomas, K. Takanabe, G. Xin, J. M. Carlsson, K. Domen and M. Antonietti, Nat. Mater., 2009, 8, 76–80 CrossRef CAS PubMed.
- Z. B. Yu, Y. P. Xie, G. Liu, G. Q. Lu, X. L. Ma and H. M. Cheng, J. Mater. Chem. A, 2013, 1, 2773–2776 RSC.
- H. Q. Sun, G. L. Zhou, Y. X. Wang, A. Suvorova and S. Wang, ACS Appl. Mater. Interfaces, 2014, 6, 16745–16754 CrossRef CAS PubMed.
- J. H. Zhang, M. W. Zhang, C. Yang and X. C. Wang, Adv. Mater., 2014, 26, 4121–4126 CrossRef CAS PubMed.
- Q. Y. Guo, Y. H. Zhang, H. S. Zhang, Y. J. Liu, Y. J. Zhao, J. R. Qiu and G. P. Dong, Adv. Funct. Mater., 2017, 27, 1703711 CrossRef.
- W. Iqbal, B. Yang, X. Zhao, M. Ruaf, I. A. Mohamed, J. L. Zhang and Y. P. Mao, Catal. Sci. Technol., 2020, 10, 549–559 RSC.
- C. W. Yang, J. Q. Qin, Z. Xue, M. Z. Ma, X. Y. Zhang and R. P. Liu, Nano Energy, 2017, 41, 1–9 CrossRef CAS.
- G. G. Zhang, Z. A. Lan, L. H. Lin, S. Lin and X. C. Wang, Chem. Sci., 2016, 7, 3062–3066 RSC.
- Y. Z. Cao, Q. Gao, Q. Li, X. B. Jing, S. F. Wang and W. Wang, RSC Adv., 2017, 7, 40727 RSC.
- R. Y. Cao, H. C. Yang, S. W. Zhang and X. J. Xu, Appl. Catal., B, 2019, 258, 117997 CrossRef CAS.
- B. Zhou, M. Waqas, B. Yang, K. Xiao, S. Y. Wang, C. Z. Zhu, J. Y. Li and J. M. Zhang, Appl. Surf. Sci., 2020, 506, 145004 CrossRef.
- D. Q. Zeng, W. J. Ong, H. F. Zheng, M. D. Wu, Y. Z. Chen, D. L. Peng and M. Y. Han, J. Mater. Chem. A, 2017, 5, 16171–16178 RSC.
- X. Li, B. Wang, D. M. Wang, G. Q. Xu, X. Y. Zhang, J. Lv and Y. C. Wu, RSC Adv., 2019, 9, 15900–15909 RSC.
- D. D. Zheng, G. G. Zhang, Y. D. Hou and X. C. Wang, Appl. Catal., A, 2016, 521, 2–8 CrossRef CAS.
- H. Y. Joon and F. Takashi, ACS Nano, 2011, 5, 7576–7584 CrossRef PubMed.
- J. He, L. Chen, F. Wang, Y. Liu, P. Chen, C. T. Au and S. F. Yin, ChemSusChem, 2016, 9, 624–630 CrossRef CAS PubMed.
- K. Chang, Z. W. Mei, T. Wang, Q. Kang, S. X. Ouyang and J. H. Ye, ACS Nano, 2014, 8, 7078–7087 CrossRef CAS PubMed.
- X. Shi, M. Fujitsuka, S. Kim and T. Majima, Small, 2018, 14, 1703277 CrossRef PubMed.
- Y. J. Yuan, Z. K. Shen, S. T. Wu, Y. B. Su, L. Pei, Z. G. Ji, M. Y. Ding, W. F. Bai, Y. F. Chen, Z. T. Yu and Z. G. Zou, Appl. Catal., B, 2019, 246, 120–128 CrossRef CAS.
- Y. Z. Liu, X. Y. Xu, J. Q. Zhang, H. Y. Zhang, W. J. Tian, X. J. Li, M. O. Tade, H. Q. Sun and S. B. Wang, Appl. Catal., B, 2018, 239, 334–344 CrossRef CAS.
- X. H. Wu, H. Q. Ma, W. Zhong, J. J. Fan and H. G. Yu, Appl. Catal., B, 2020, 271, 118899 CrossRef CAS.
- D. D. Zheng, X. N. Cao and X. C. Wang, Angew. Chem., Int. Ed., 2016, 55, 11512–11516 CrossRef CAS PubMed.
- Q. Q. Jiang, L. Sun, J. H. Bi, S. J. Liang, L. Y. Li, Y. Yu and L. Wu, ChemSusChem, 2018, 11, 1108–1113 CrossRef CAS PubMed.
- H. Zhao, Y. M. Dong, P. P. Jiang, H. Y. Miao, G. L. Wang and J. L. Zhang, J. Mater. Chem. A, 2015, 3, 7375–7381 RSC.
- Y. D. Hou, A. B. Laursen, J. S. Zhang, G. G. Zhang, Y. Zhu, X. C. Wang, S. Dahl and I. B. Chorkendorf, Angew. Chem., Int. Ed., 2013, 52, 3621–3625 CrossRef CAS PubMed.
- Y. X. Li, H. Wang and S. Q. Peng, J. Phys. Chem. C, 2014, 118, 19842–19848 CrossRef CAS.
- Q. Li, N. Zhang, Y. Yang, G. Z. Wang and D. H. Ng, Langmuir, 2014, 30, 8965–8972 CrossRef CAS PubMed.
- Y. Z. Liu, H. Y. Zhang, J. Ke, J. Q. Zhang, W. J. Tian, X. Y. Xu, X. G. Duan, H. Q. Sun, M. O. Tade and S. B. Wang, Appl. Catal., B, 2018, 228, 64–74 CrossRef CAS.
- Q. H. Liang, Z. Li, X. L. Yu, Z. H. Huang, F. Y. Kang and Q. H. Yang, Adv. Mater., 2015, 27, 4634–4639 CrossRef CAS PubMed.
- Q. Y. Guo, Y. H. Zhang, J. R. Qiu and G. P. Dong, J. Mater. Chem. C, 2016, 4, 6839–6847 RSC.
- C. Y. Liu, H. W. Huang, L. Q. Ye, S. X. Yu, N. Tian, X. Du, T. R. Zhang and Y. H. Zhang, Nano Energy, 2017, 41, 738–748 CrossRef CAS.
- Z. Y. Zeng, Z. Y. Yin, X. Huang, H. Li, Q. Y. He, G. Lu, F. Boey and H. Zhang, Angew. Chem., Int. Ed., 2011, 50, 11093–11097 CrossRef CAS PubMed.
- X. W. Shi, M. Fujitsuka, Z. Z. Lou, P. Zhang and T. Majima, J. Mater. Chem. A, 2017, 5, 9671–9681 RSC.
- Y. Y. Jiao, Q. Z. Huang, J. S. Wang, Z. H. He and Z. J. Li, Appl. Catal., B, 2019, 247, 124–132 CrossRef CAS.
- X. H. Wu, D. D. Gao, H. G. Yu and J. G. Yu, Nanoscale, 2019, 11, 9608–9616 RSC.
- Y. Gong, X. Zhao, H. Zhang, B. Yang, K. Xiao, T. Guo, J. J. Zhang, H. X. Shao, Y. B. Wang and G. Yu, Appl. Catal., B, 2018, 233, 35–45 CrossRef CAS.
- C. Y. Zhai, M. S. Zhu, B. Duan, F. F. Ren, C. Q. Wang, Y. Ping and Y. K. Du, J. Power Sources, 2015, 275, 483–488 CrossRef CAS.
- Q. Xiang, J. Yu and J. Mietek, J. Am. Chem. Soc., 2012, 134, 6575–6578 CrossRef CAS PubMed.
- J. X. Low, C. J. Jiang, B. Cheng, S. Wageh, A. A. Al-Ghamdi and J. G. Yu, Small Methods, 2017, 1, 1700080 CrossRef.
- M. Q. Yang, C. Han and Y. J. Xu, J. Phys. Chem. C, 2015, 119, 27234–27246 CrossRef CAS.
- K. Chang, M. Li, T. Wang, S. X. Ouyang, P. Li, L. Q. Liu and J. H. Ye, Adv. Energy Mater., 2015, 5, 1402279 CrossRef.
- Y. S. Xu, X. He, H. Zhong, D. J. Singh, L. J. Zhang and R. H. Wang, Appl. Catal., B, 2019, 246, 349–355 CrossRef CAS.
- J. S. Zhang, X. F. Chen, K. Takanabe, K. Maeda, K. Domen, J. D. Epping, X. Z. Fu, M. Antonietti and X. C. Wang, Angew. Chem., Int. Ed., 2010, 49, 441–444 CrossRef CAS PubMed.
Footnote |
| † Electronic supplementary information (ESI) available. See DOI: 10.1039/d0ra03759a |
| This journal is © The Royal Society of Chemistry 2020 |

