
 Open Access Article
 This Open Access Article is licensed under a Creative Commons Attribution-Non Commercial 3.0 Unported Licence
A decoupler-free simple paper microchip capillary electrophoresis device for simultaneous detection of dopamine, epinephrine and serotonin†
Appan
Roychoudhury
ab,
Kevin Antony
Francis
ab,
Jay
Patel
c,
Sandeep Kumar
Jha
 ab and
Suddhasatwa
Basu
*d
ab and
Suddhasatwa
Basu
*d
aCentre for Biomedical Engineering, Indian Institute of Technology Delhi, Hauz Khas, New Delhi 110016, India
bDepartment of Biomedical Engineering, All India Institute of Medical Sciences, New Delhi 110029, India
cDepartment of Chemical Engineering, Visvesvaraya National Institute of Technology, Nagpur 440010, India
dDepartment of Chemical Engineering, Indian Institute of Technology Delhi, Hauz Khas, New Delhi 110016, India. E-mail: sbasu@iitd.ac.in
First published on 6th July 2020
Abstract
This paper demonstrates a new and simplified configuration for capillary electrophoresis-amperometric detection (CE-AD) using a paper microfluidic chip incorporating inexpensive wax printing and screen printing based methods and then used for electrophoretic separation and simultaneous in-channel amperometric detection of three clinically relevant neurochemicals in a single run without using any decouplers. Detection of neurochemicals e.g., dopamine, epinephrine and serotonin is crucial for early prediction of neurological disorders including Parkinson's, Alzheimer's, dementia, as well as progressive neuro-psychiatric conditions such as depression, anxiety, as well as certain cardiovascular diseases. The plasma concentrations of such neurochemicals are as important as those present in cerebrospinal fluid (CSF) and can be useful for rapid and convenient biosensing. However, simultaneous detection of such neurochemicals in a complex mixture such as human serum requires their separation prior to detection. With the developed microchip, separation and detection of the neurochemicals were exhibited within 650 seconds without pre-treatment and the procedure was validated with spiked fetal bovine serum samples. Beside this, the developed paper microfluidic chip has potential to be integrated in point-of-care diagnosis with onsite detection ability. Moreover, the use of a straight channel capillary, a screen-printed carbon electrode without decoupler, in-channel amperometric detection and low sample volume requirements (2 μL) are shown as additional advantages.
Introduction
Dopamine, epinephrine and serotonin exhibit significant roles as neurotransmitters to control the functions of central and peripheral nervous systems of humans and other mammals. Several psychiatric, neurological and cardiovascular diseases are associated with dopamine, epinephrine and serotonin levels and their concentrations in plasma are often useful for diagnosis and monitoring of therapeutic and pharmacodynamics effects.1–3 In particular, dopamine influences physiological conditions; attention, learning, behavior, mood, memory and movement while abnormal concentration leads to Parkinson's disease, attention deficit hyperactivity disorder (ADHD), senile dementia and schizophrenia.4–6 Epinephrine or adrenaline acts as a fight or flight hormone and excites a series of activities of the sympathetic nervous system and also plays a major role during mental and physical stress.7–9 Both dopamine and epinephrine are used in emergency medical conditions such as hypertension, myocardial infraction, bronchial asthma and during acute heart surgery.8,9 Serotonin or 5-hydroxytryptamine is widely known for controlling the feelings of well-being and happiness. Additionally, serotonin regulates cognitive and behavioral functions including mood, sleep, appetite, muscle contraction, depression and anxiety.10 With such relevance in human physiology, simultaneous detection of dopamine, epinephrine and serotonin is essential for monitoring and diagnosis of various neurological and cardiovascular disorders.Presently available analytical methods for separation and simultaneous determination of multiple neurochemicals are based on high performance liquid chromatography (HPLC)-mass spectrometry,11 gas chromatography (GC)-mass spectrometry,12 flow injection-chemiluminescence,13,14 capillary electrophoresis (CE)-chemiluminescence,15 HPLC-chemiluminescence,16 HPLC-fluorometry,17,18 HPLC-UV spectroscopy,17 HPLC-electrochemical analysis,19 liquid chromatography-electrospray tandem mass spectrometry,20 solid phase extraction-CE,21 CE-electrochemiluminescence22 and spectrophotometry23 techniques. However, most of the processes are cumbersome, time consuming, bulky, complicated due to complex instrumentation, expensive and often need pre-treatment steps and higher sample volume. Although, the methods based on HPLC,16–19 GC,12 flow injection analysis13,14 and electrophoresis in a long capillary channel15,22 are available and used since half a century but the processes are tedious, inconvenient and not possible to use in on-site applications or as point-of-care devices. Compared to those systems, capillary electrophoresis-amperometric detector (CE-AD) could be a prominent way-out due to fast separation and highly sensitive detection of multiple analytes in a single run.24,25 Furthermore, CE-AD procedure can be miniaturized and integrated to point-of-care diagnostics devices for their use in intensive care unit (ICU) and clinical laboratories. Additionally, the CE-AD microchip comprised with inexpensive and easy-to-fabricate methodology could be used more conveniently and effectively in disease diagnosis. On this subject, microfluidic paper-based analytical devices can be utilized efficiently for the development of point-of-care diagnostic devices that would be specifically well-suited in developing countries due to their low manufacturing cost and versatility. Beside this, paper microfluidic system has gained considerable interest owing to easy fabrication, simplicity and fast detection of the analytes with high sensitivity.26,27
For microchip capillary electrophoresis (MCE), there is a need to develop fully-integrated devices to obviate the issue of misalignment of electrodes in microchannel or reservoirs. In most of the previous studies,28–37 a separate placing of replaceable electrodes was observed in detection reservoir which may lead to inaccuracy in results because of manual or instrumental error in alignment for each devices. In this context, integration of all the detection and separation microelectrodes on MCE could help to improve the reproducibility of electrode-microchannel alignment and spacing and such arrangement has been made in the present study without using any clean room facilities, sophisticated instruments and specialized metallization systems. Moreover in microchip CE-AD processes, the working electrode is usually placed in detection reservoir with end-channel or end-column set-up.28,34–36,38,39 However, such configurations for amperometric detection of analytes can result in less sensitive detection due to diffusion dominant behavior of the separated compounds in the detection reservoir. Beside this, the detection peaks resulting from end-channel detection reveal unsymmetrical nature and tailing owing to diffusion of analyte molecules in multiple directions inside the reservoir with comparatively large volume.40 In contrast to such systems, the in-channel configuration could be highly useful to restrict the diffusion of analytes and thus to obtain relatively better peak symmetry with lower number of tailing peaks. Furthermore, the back pressure generated in end-column detection can be avoided with in-channel set-up and due to such advantages, the in-channel detection has been implemented in the current research. Apart from that, the use of decoupler is much common during fabrication of CE-AD microchip to diminish the effect of separation electric field on electrochemical detection.34,41–44 Though, the decoupler electrodes can adhere analyte molecules due to maintaining at ground potential and show less sensitivity during detection. Also, the fabrication process of decouplers in microchip format is complex and inconvenient. In this regards, non-inclusion of decouplers can make the microchip electrophoresis process faster by avoiding the diffusion of analytes from decoupler to detection electrodes and such systems also hold promises for better detection sensitivity. Moreover, the cost of the microfluidic chip and fabrication complexity can be minimized by not including the decouplers. Additionally, the paper capillary used in the present experiments instead of decouplers would be helpful to decrease the noise from the separation electric field.
The purpose of the present research was to develop a simple and inexpensive device for the determination of clinically relevant neurotransmitters, such as: dopamine, epinephrine and serotonin in plasma. Hence, a paper fluidics-based decoupler free CE-AD microchip has been developed for the analysis of multiple neurochemicals with commercial implication due to cost-effectiveness, miniaturized form factor and convenience for using in point-of-care diagnosis with on-site detection ability. The fully-integrated microchip was made by simple and inexpensive wax printing on paper strip for laying microchannel and electrode was screen-printed on the glass slide. The fabricated microchip was then used for separation and simultaneous in-channel measurement of multiple neurochemicals. Beforehand, a detailed off-chip electrochemical characterization of each neurochemical was conducted to obtain appropriate detection parameters for on-chip analysis. Besides, the developed system was tested with fetal bovine serum samples with different concentrations of spiked neurochemicals.
Experimental
Chemicals, reagents and equipment
Dopamine hydrochloride (C8H11NO2·HCl), epinephrine hydrochloride (C9H13NO3·HCl) and serotonin hydrochloride (C10H12N2O·HCl) were procured from Sigma-Aldrich (India). All the other reagents were of analytical grade and utilized without any further purification. Whatman grade 1 chromatography paper was purchased from GE healthcare (UK) and used for the preparation of microchannel. Microelectrodes were prepared by screen printing of carbon paste (Gwent Ltd., Singapore) on a microscope glass slide (75 mm × 38 mm). Aqueous solutions were prepared with deionised water (resistivity > 18 MΩ cm), collected from Milli-Q Direct8 water purification system (Merck Millipore, USA). Stock solutions of the neurochemicals were prepared in electrophoresis run buffer (phosphate buffer saline, 50 mM, pH 7, 0.9% NaCl) and the successive dilutions were made prior to experiments.The design of the microchannel was drawn using CorelDRAW Graphics Suite X7 software and used for wax printing on Whatman paper by Xerox ColorQube 8580 colour printer. The microelectrode design was made in AutoCAD 2016 student version software and utilized for screen printing. The electrochemical experiments including voltammetry and amperometry studies were carried out using a potentiostat (DropSens μStat400). For the purpose of capillary electrophoresis, a power supply (Keithley 2290E-5) was used to generate constant DC potential across the microchannel.
Preparation of microchannel
For the preparation of microchannel, Whatman grade 1 chromatography paper was used as a substrate owing to the presence of pure cellulose fibers, uniform thickness and wicking properties. Additionally, it provides a homogeneous, hydrophilic, cost-effective and biocompatible platform for biochemical analysis. The pattern of the microchannel on paper was created by wax printing and for such execution, first the design of microchannel was made in drawing software and then printed on surface of the paper using wax-based ink. After printing, the wax ink was cooled down and solidified immediately. For further penetration of wax throughout the entire thickness of paper, the printed paper microchannel was kept on a hotplate at 150 °C for 120 seconds. Thus, the wax served as hydrophobic barrier on the hydrophilic paper, which by itself a sieving medium. The fabricated paper microchannel had a separation length of 50 mm with two circular reservoirs of 3 mm diameter at both end of the channel. After wax spreading, the effective width of the channel was 200 μm and the thickness of paper (180 μm) was the defined height of the microchannel.Preparation of microelectrodes and microchip
The microelectrodes including working, reference, counter and separation electrodes were prepared by screen-printing of carbon paste on the cleaned glass substrate. The fabricated working, reference and counter electrode had a width of 250 μm each and placed with a gap of 250 μm from each-other, whereas the separation electrodes had a width of 1000 μm. The microelectrodes pattered glass substrate was rinsed with isopropanol alcohol and used for further studies after drying. Finally, the complete microchip with miniaturized size (75 mm × 38 mm) was developed by aligning and fixing of paper microchannel on carbon paste microelectrode-printed glass substrate using cellophane tape. The snapshot of the developed microchip is shown in Fig. 1.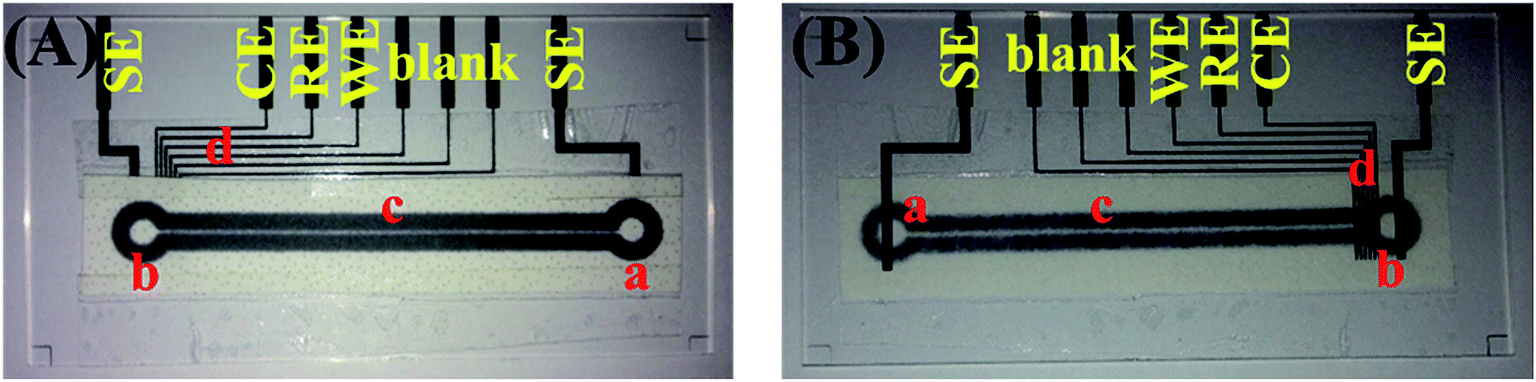 | ||
| Fig. 1 Developed microchip (A) front view and (B) rear view after alignment and fixing; (a) sample reservoir, (b) sample waste reservoir, (c) separation microchannel, and (d) microelectrodes [SE: separation electrode, CE: counter electrode, RE: reference electrode, WE: working electrode]. | ||
Assessment of sensing performances for developed microchip
Prior to analyzing analytes (dopamine, epinephrine and serotonin) on the developed microchip, first the off-chip conventional voltammetric studies were performed on the analytes in phosphate buffer saline (PBS) (50 mM, pH 7.0, 0.9% NaCl) with three electrode system comprising of glassy carbon working electrode, Ag/AgCl reference electrode and platinum wire counter electrode. Cyclic voltammograms (CV) were recorded for 100 μM and 500 μM solutions of dopamine, epinephrine and serotonin individually. The oxidation potentials of each compound obtained from CV were further confirmed from off-chip square wave voltammetry (SWV) and differential pulse voltammetry (DPV) studies. Afterwards, the detection potentials as obtained through off-chip voltammetry studies were applied on the developed microchip for pulsed chronoamperometry using the microelectrodes for simultaneous in-channel determination of three analytes after their separation through capillary electrophoresis. In order to obtain on-chip electropherograms, the paper microchannel of developed microchip was uniformly filled with PBS and then a constant DC potential of 100 V was applied across the separation microchannel. The detection potentials were applied in a pulse mode on the detection microelectrodes and after obtaining a stable baseline, 2 μL of sample containing equimolar concentration of dopamine, epinephrine and serotonin was placed on sample reservoir of the microchannel using micropipette. The electropherograms for separation and detection of three neurochemicals were obtained and the calibration curve of the respective neurochemicals was recorded by varying the analyte concentration between 0.1–50 μM. Moreover, the performance of the developed microchip was examined in fetal bovine serum sample by spiking known concentrations of the neurochemicals and comparing the results with standard samples comprising of identical neurochemical concentrations. The schematic of the entire procedure is shown in Fig. 2.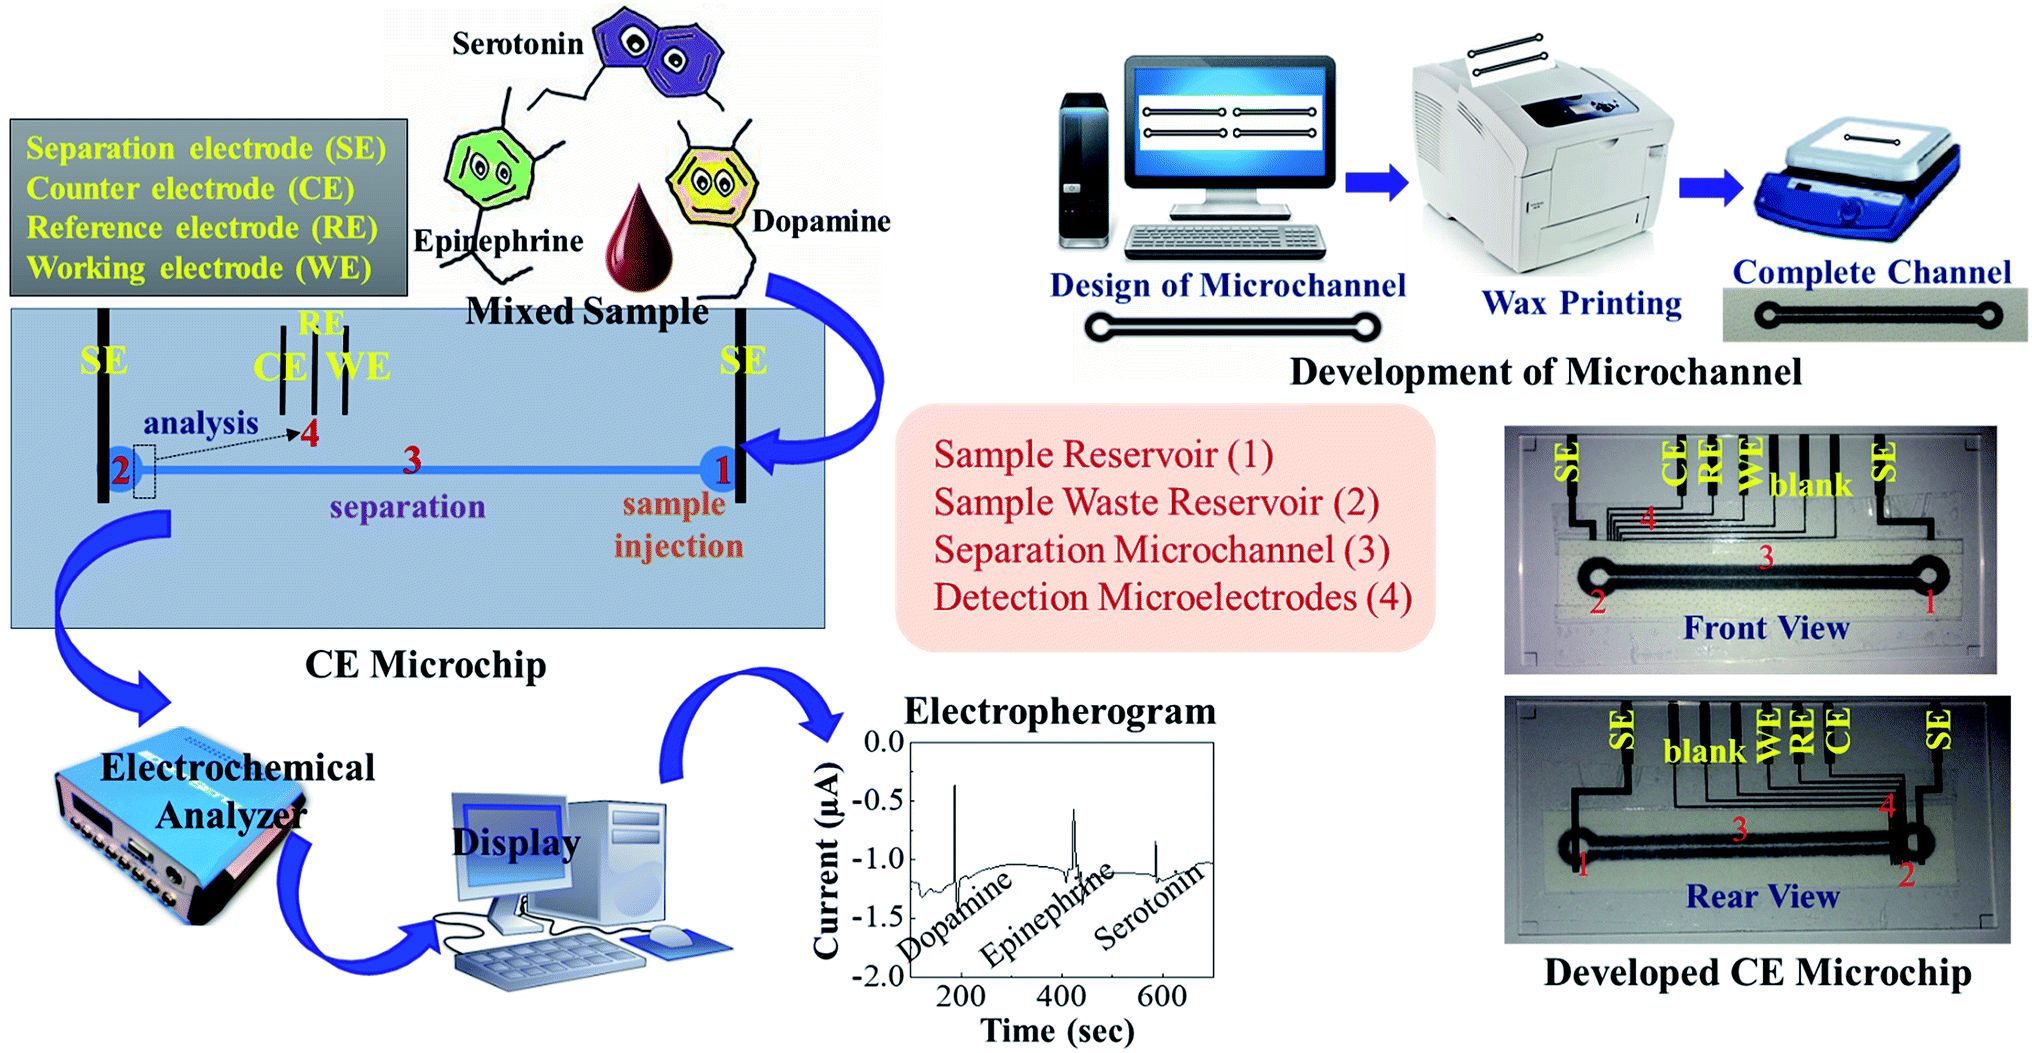 | ||
| Fig. 2 Schematic illustration of the set-up and procedure for simultaneous detection of dopamine, epinephrine and serotonin. | ||
Results and discussion
Off-chip voltammetry studies of dopamine, epinephrine and serotonin
The off-chip voltammetry studies were used to determine redox potentials of dopamine, epinephrine and serotonin. First, cyclic voltammetry (CV) studies on 100 μM and 500 μM solutions of dopamine, epinephrine and serotonin were conducted in PBS at 50 mV s−1 scan rate in the potential range of −0.5 V to +0.8 V. As shown in Fig. 3, oxidation peaks for dopamine, epinephrine and serotonin were obtained at 0.2, 0.22 and 0.37 V respectively. The positions of oxidation peaks for dopamine, epinephrine and serotonin were further cross-checked via off-chip square wave voltammetry (SWV) and differential pulse voltammetry (DPV) methods in the potential range of −0.4 V to +0.8 V. The results of the SWV studies (Fig. S1 in the ESI†) show oxidation peaks for dopamine, epinephrine and serotonin at 0.2, 0.22 and 0.37 V respectively. Furthermore, the differential pulse voltammograms (Fig. S2 in the ESI†) of dopamine, epinephrine and serotonin revealed oxidation peaks at 0.2, 0.22 and 0.37 V respectively. The obtained results of both SWV and DPV studies for dopamine, epinephrine and serotonin were well-matched with the results of the corresponding CV studies.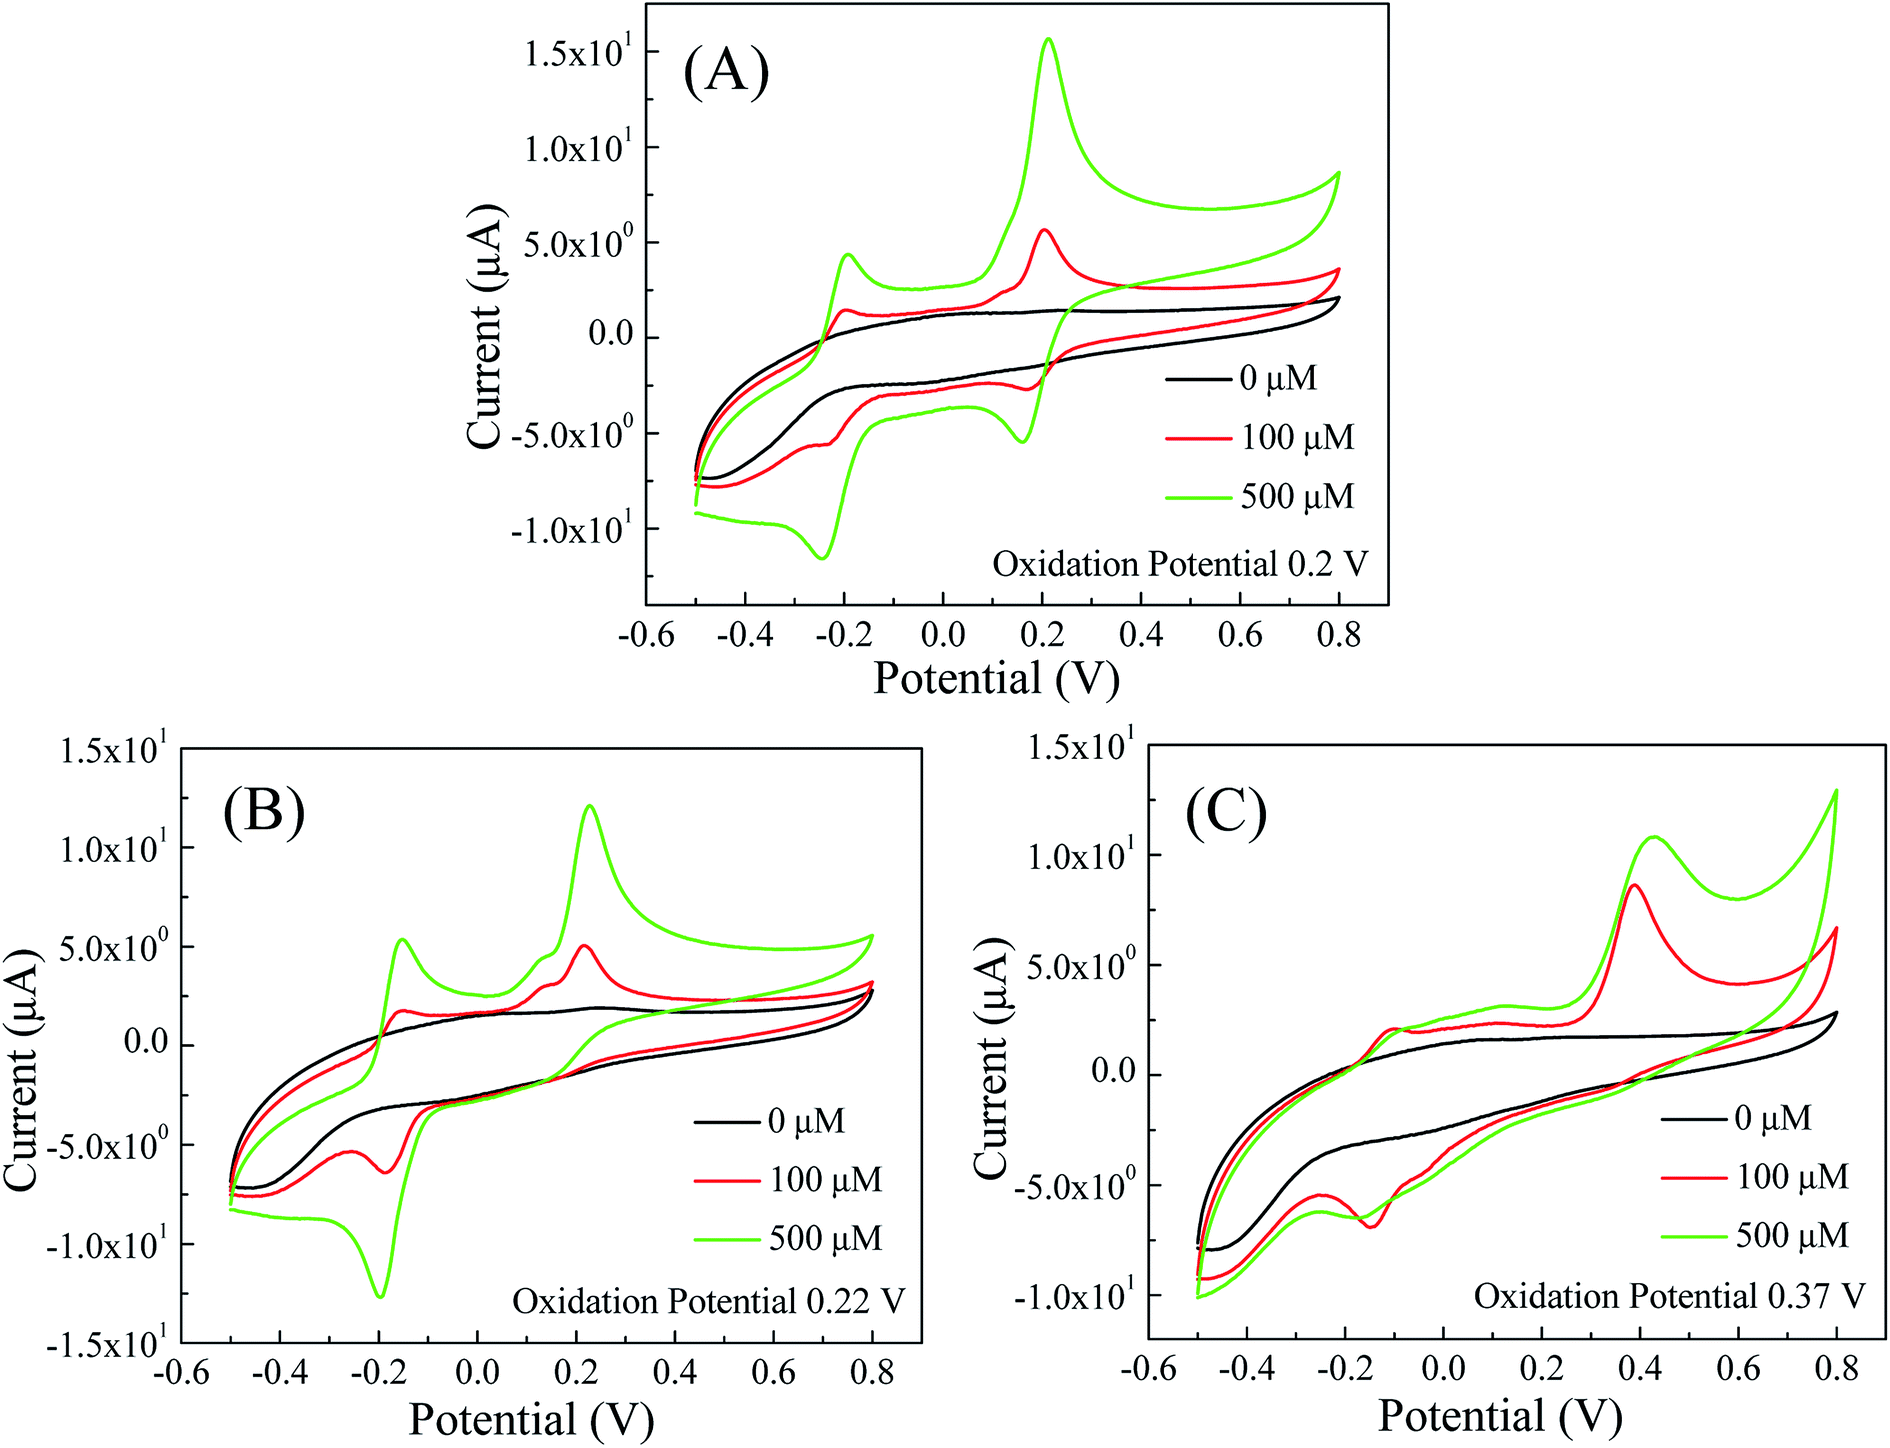 | ||
| Fig. 3 Cyclic voltammograms of (A) dopamine; (B) epinephrine; and (C) serotonin in PBS (50 mM, pH 7.0, 0.9% NaCl) with 50 mV s−1 scan rate. | ||
On-chip electropherogram for separation and simultaneous detection of dopamine, epinephrine and serotonin
The electropherograms for mixture containing dopamine, epinephrine and serotonin with the fabricated microchip were recorded by applying the obtained oxidation potentials of the respective compounds (0.2 V for dopamine, 0.22 V for epinephrine and 0.37 V for serotonin) through pulsed amperometric technique on the detection microelectrodes. Before that, the separation paper microchannel was filled with PBS and a constant DC separation potential of 100 V was provided across the separation microelectrodes. Though, in such studies involving CE, chronoamperometry is used often, however, as our aim was to simultaneously detect multiple analytes being separated in CE microchannel. For this reason, we used chrono-pulse-amperometry while applying the three distinct detection voltages one by one (for a span of 200 millisecond each) in alternate mode (with a gap of 100 millisecond from each other). Each waveform of pulsed amperometric detection (PAD) required 900 milliseconds and the process was continued repeatedly throughout the entire run. The benefit of such system or procedure was that, it can be upscaled to apply even 8–10 different voltages in pulsed mode on a single working electrode within a span of 1 second and such alternative waveform is useful in detecting more number of electrochemically active analytes. Even, with the help of pulsed amperometric technique, the problem of electrode fouling from phenolic compounds can be omitted due to the application of multiple potential waveforms which help in the oxidation of adsorbed phenolic products and subsequently reactivation of the electrode surface. In addition, the detection potentials of each analyte provide a better control over selectivity as other compounds either not respond to the detector under these conditions or respond so weakly that they do not interfere. Above all, electrochemical measurements offer a high utility in detection sensitivity and selectivity,6,43,45 while being applicable to miniaturization and thus for mass fabrication with a lower cost.After obtaining a stable baseline response in PBS, 2 μL of sample containing equimolar (0.1–50 μM) concentration of dopamine, epinephrine and serotonin was added on the sample reservoir to carry out the CE-AD process. The CE separation of three neurochemicals was exhibited due to different migration velocity of each compound depending upon their charge to mass ratio and when the separated compounds reached on the detection electrodes, they were detected through amperometry due to the application of characterization potentials in pulsed mode. As the dissociation constant/pKa values of dopamine, epinephrine and serotonin are 8.93, 8.59 and 9.8 respectively, hence at pH 7.0, all three neurochemicals were in protonated state. Therefore, negative potential was maintained at the separation electrode located at the buffer waste reservoir [Fig. 1(b)], whereas positive potential was provided at the separation electrode placed below the buffer reservoir [Fig. 1(a)], thus the positively charged molecules can drift towards oppositely charged electrode with different migration velocity and the separation of the molecules could be attained. Fig. 4D displays electropherogram for separation and detection of dopamine, epinephrine and serotonin with 50 μM concentration of each compound and reveals well-resolved peaks for the three neurochemicals, which were being detected simultaneously in same sample. Beforehand, the separate electropherograms for dopamine, epinephrine and serotonin were recorded by CE-AD analysis with pure sample of the respective compounds to identify the peak positions of the detected compounds. Fig. 4A–C show the individual electropherograms for dopamine, epinephrine and serotonin respectively. It can be seen from the obtained results that the first, second and third peaks appeared with different migration time in the electropherogram (Fig. 4D) which corresponded to dopamine, epinephrine and serotonin respectively. Though, a continuous drift was observed in the baseline of the captured electropherograms. Perhaps, such characteristics in electropherograms were observed due to non-insertion of decoupler in the fabricated microchip.
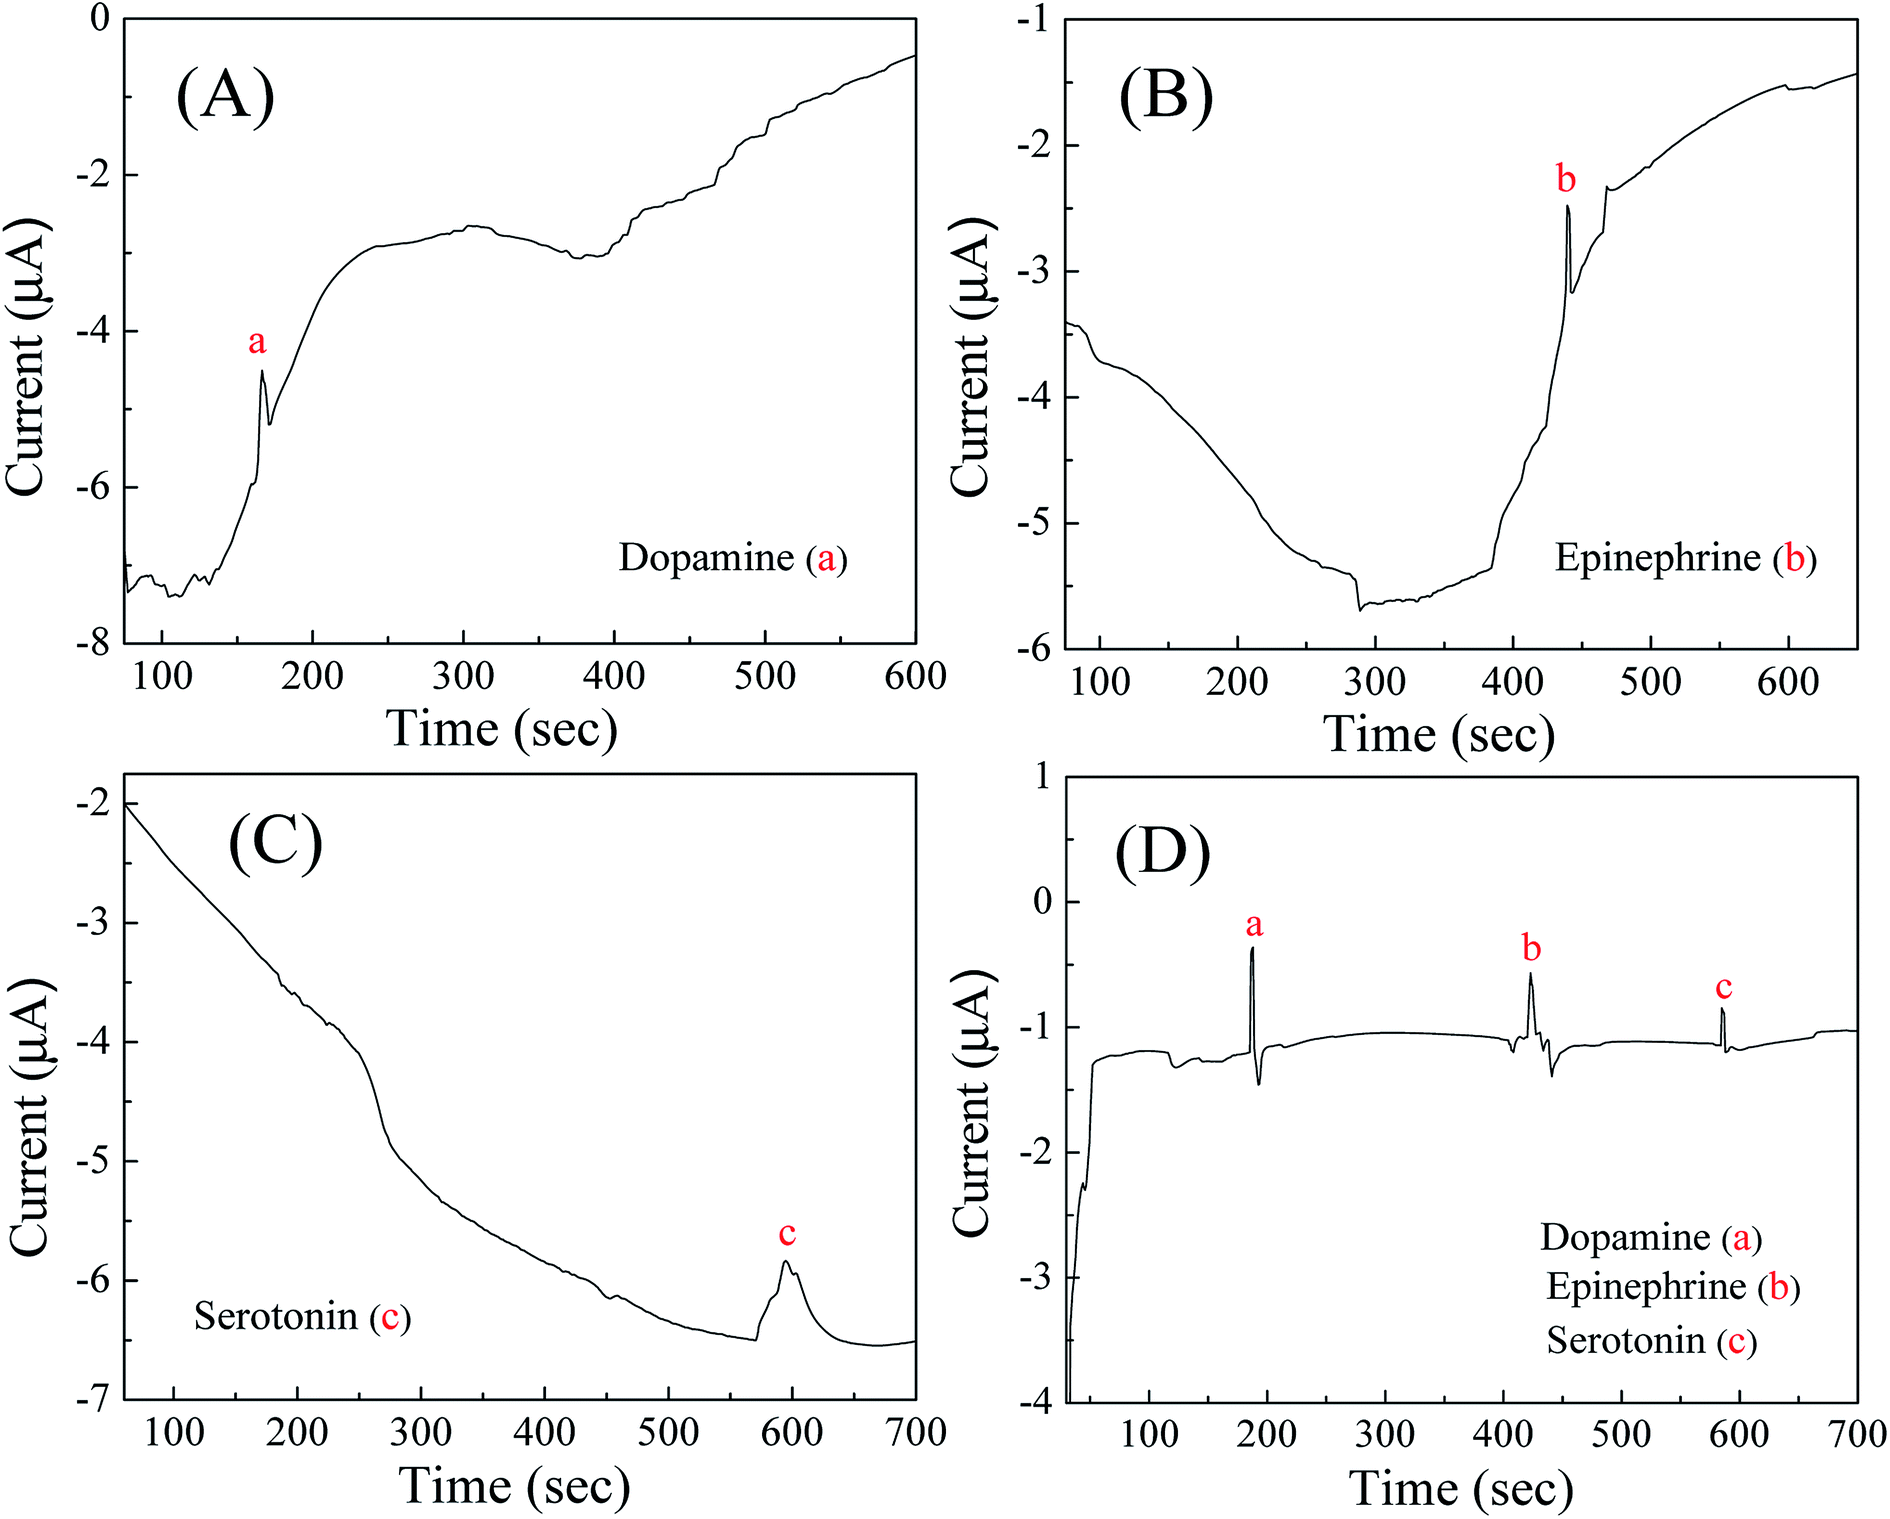 | ||
| Fig. 4 Electropherograms of (A) dopamine; (B) epinephrine; (C) serotonin; and (D) mixture solution comprising of dopamine, epinephrine and serotonin of concentration 50 μM each. | ||
Migration time profile and analytical performances of developed system for dopamine, epinephrine and serotonin
The migration time profile for dopamine, epinephrine and serotonin was observed with the developed microchip by executing repetitive CE-AD measurements (n = 19) for mixed sample containing equimolar concentration of the three analytes. Fig. 5A shows the migration time profile of the analytes and the average migration time for dopamine, epinephrine and serotonin were obtained as 158 ± 15, 388 ± 27 and 587 ± 16 seconds respectively with the fabricated microchip. The electrophoretic mobility of the respective analytes in CE separation were calculated using eqn (1):| μ = L/E × t | (1) |
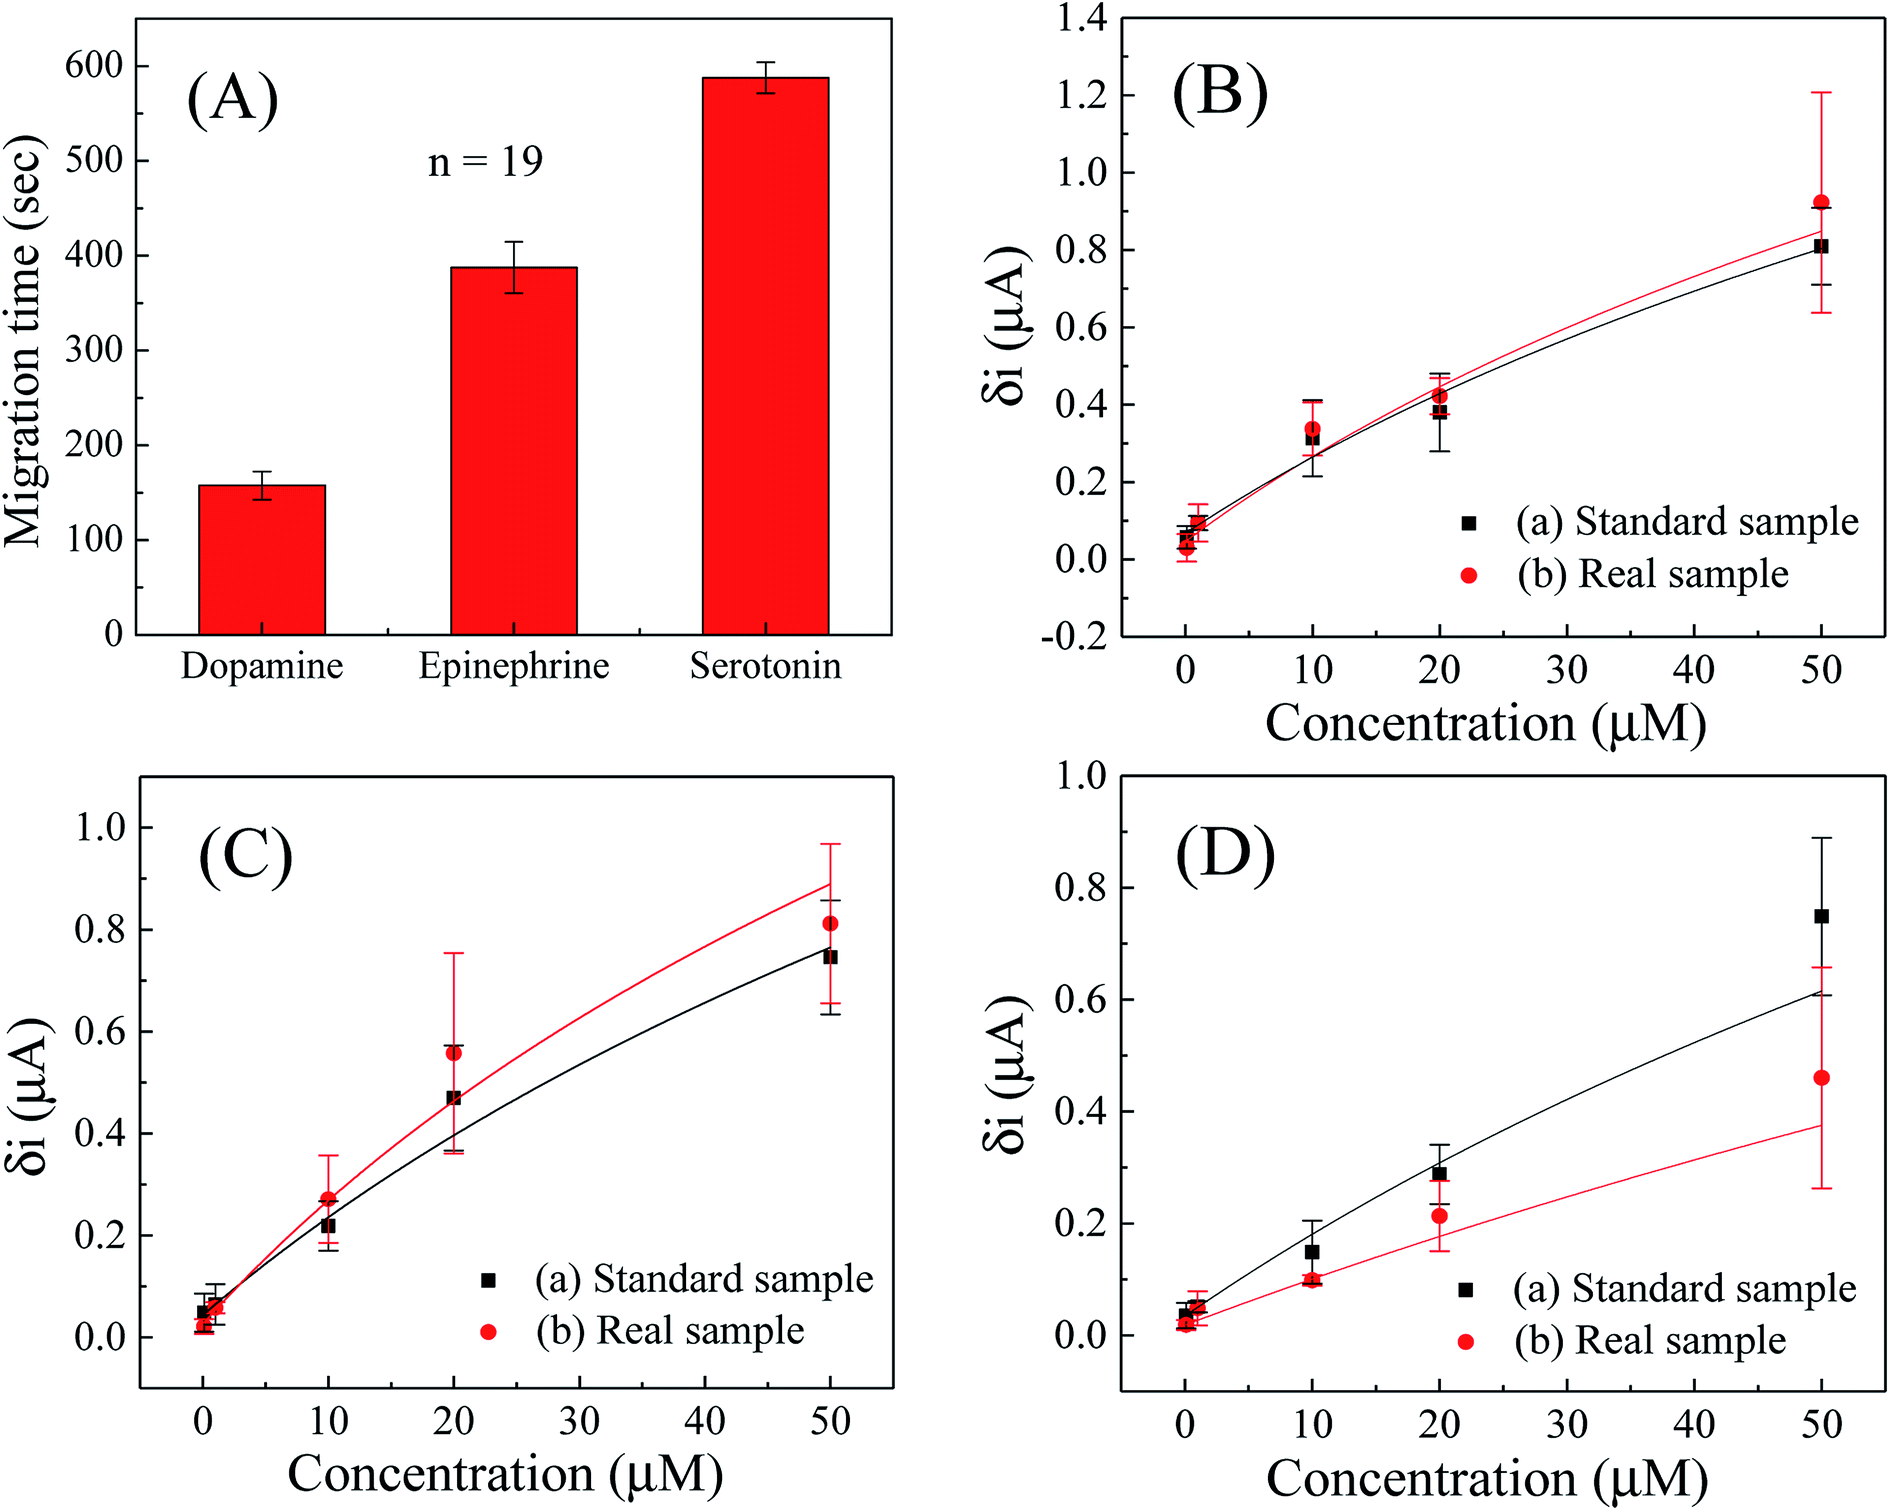 | ||
| Fig. 5 (A) Bar graph showing migration time profile for dopamine, epinephrine and serotonin; calibration curves of variation in peak current amplitude (baseline corrected) as a function of (B) dopamine; (C) epinephrine; and (D) serotonin concentration in the range of 0.1 to 50 μM in (a) standard and (b) real samples. | ||
Further, the CE-AD analysis were conducted on a mixture of analytes in which, concentration of all three compounds were varied between 0 to 50 μM. During evaluation of peak positions of the respective compounds, it was ensured that the mobility coefficients of each compound, as calculated earlier remained nearly identical (using peak detector in offline plot using Origin Software), and then the amplitude of the peaks were noted for each sample combination to plot the corresponding calibration curves. The calibration curves for dopamine, epinephrine and serotonin in the entire concentration range (0.1–50 μM) have been depicted in Fig. 5B–D respectively. The parameter ‘δi’ represents magnitude of peak current from baseline of recorded electropherogram for a particular concentration of the analyte, while the background noise was determined by measuring peak to peak difference in the current scale along the baseline. It can be seen from the calibration curves that the amplitude of peak current increased regularly with increasing concentrations and retained a logarithmic relationship in the entire concentration range (0.1–50 μM) for all three analytes.
The obtained calibration curves were fitted with logarithmic equation and the regression coefficients of 0.98, 0.98 and 0.96; with chi-square values of 0.247, 0.222 and 0.463 were found for dopamine, epinephrine and serotonin respectively in standard solution (PBS, 50 mM, pH 7, 0.9% NaCl). Furthermore, the limit of detection (LOD) for dopamine, epinephrine and serotonin in simultaneous detection of three analytes were calculated as 2.39, 3.59 and 4.56 μM respectively. Since volume of individual analyte was only 0.67 μL on the chip, these LODs correspond to 1.6, 2.4 and 3.05 pmol respectively. Absence of decoupler was also helpful in faster detection of neurochemicals in the paper microchannel which was required in such operation, otherwise detection of all three neurochemicals could not be completed as the paper microchannel started drying after 780–800 seconds. This was one of the demerits of the setup as heavier or less charged analyte would not be detected as channel would dry up before the analyte reaches the detection electrode. One solution was to enhance separation potential for even faster migration, but that would speed up drying due to Joule heating. Hence we continues with present setup for detection as it was still sensitive and fast enough for most neurochemicals. Moreover, all units of concentrations have been reported in terms of μM of stock analyte solution added to chip, as it was not possible to ascertain how much volume of travelling analyte actually reached detection electrode under evaporating condition and there would exist a tail of the sample as well while migrating. As another demerit, since we were not using a decoupler electrode, baseline drifts was observable, which could be mitigated by using an online or offline peakfinder algorithm in data analytics.
Besides, the simultaneous detection of dopamine, epinephrine and serotonin was conducted in model sample (mimicking real sample) by spiking known concentration of the analytes in fetal bovine serum samples using standard addition method to observe the applicability and to inspect matrix effect of biological fluids on the developed microchip. For such purposes, the fetal bovine serum sample was diluted for 10 times with PBS (50 mM, pH 7.0, 0.9% NaCl) and then five different concentrations (0.1, 1, 10, 20 and 50 μM) of dopamine, epinephrine and serotonin were added simultaneously to conduct real sample analysis in the whole concentration range (0.1–50 μM). The experiments were carried out by the developed CE-AD process and the current responses of the serum samples (Fig. S3 in the ESI†) added with particular concentrations of dopamine, epinephrine and serotonin were denoted. It can be seen form the obtained results (Fig. 5B–D for dopamine, epinephrine and serotonin respectively) that the current responses with serum samples were well comparable and nearly equivalent to the current responses of the corresponding standard samples. The results also reveal that the high content of protein in serum samples have not influenced significantly for neurochemicals detection with the developed CE-AD microchip. As the protein content in human serum, cerebrospinal fluid (CSF) and other body fluids is much lower than fetal bovine serum sample, therefore, the developed system has potential to simultaneously detect multiple neurochemicals in the real samples like human serum and CSF.
Most of the previous methods used for simultaneous analysis of multiple neurochemicals are based on HPLC, GC, flow injection analysis or electrophoresis in a long capillary channel. Besides, multiple studies have been carried out on miniaturization of system for the analysis of these neurochemicals, and these mainly involve MCE on polydimethylsiloxane (PDMS) based structure fabricated through microfabrication techniques. For example, the work by Schöning et al. wherein they detected dopamine and phenolic pollutant catechol42 involved microfabricated titanium, platinum and palladium electrodes and they used decoupler electrodes to obtain a linear range of 20–100 μM with a sensitivity of 16.1 pA μM−1 and 2.7 pA μM−1 for dopamine and catechol respectively. As compared to this method, our present work uses paper microfluidics, which is sieving medium in itself and does not involve microfabrication. Besides, by avoiding decoupler we could achieve faster migration time and obtained nearly 1000 times better sensitivity of 17.1 nA μM−1, 19.4 nA μM−1 and 7.7 nA μM−1 for dopamine, serotonin and epinephrine respectively in comparison of previously reported values.42 Such high detection sensitivity can be also attributed to low joule heating due to use of pulsed amperometry and open structure (though sample drying up beyond 800 seconds of analysis could be a demerit) and sieving nature of paper to separate the analyte properly rather than just relying on electrokinetic41,44,46 or electroosmotic35 forces in a PDMS channel or use of in-channel detection rather than end-channel34,36,39 or in-the-well detection followed by other groups. Besides, the systems mentioned in literature are prone to be giving less accurate results because of issues related to electrode alignment.34 Other than amperometric detection, Zhang et al. separated dopamine, epinephrine and serotonin using MCE device and the in-channel simultaneous detection was performed by laser induced fluorescence.37 The cross-type microchannel was prepared in a glass substrate by etching and platinum electrodes were inserted in reservoirs for on-chip injection and zone electrophoretic separation of sample. As compared to this method, our developed process used simple straight microchannel on paper substrate for separation and simultaneous electrochemical determination of dopamine, epinephrine and serotonin and the detection of the analytes was exhibited via pulsed amperometric technique using screen-printed carbon microelectrodes.
In similar developments, to improve separation efficiency for neurotransmitters: dopamine and epinephrine in the fabricated microchannel, Wang et al. modified the surface of PDMS engraved channel by citrate-labeled gold nanoparticles after incorporating a layer of linear polyethylenimine (LPEI),32 by cationic polyelectrolyte (chitosan)-gold nanoparticles-proteins (albumin, lysozyme)31 and by poly(diallyldimethylammonium chloride)-silica nanoparticles.33 In all these cases, the cross-type microchannel was prepared in PDMS through lithography and negative moulding methods and bonded with another PDMS plate to make PDMS/PDMS microchip. The electrode arrangement in the microchip was done by using carbon fiber working, Ag/AgCl reference, platinum auxiliary and platinum ground electrodes. As compared to these methods, our study used paper microchannel with hydrophilic cellulose fiber that can give a better efficiency for separation of the analytes while the detection has been exhibited more accurately with fully integrated screen-printed carbon microelectrodes.
Conclusions
In conclusion, a paper fluidics based capillary electrophoresis microchip has been made for simultaneous analysis of multiple neurochemicals in a single run. With the developed microchip, separation and detection of three clinically relevant neurotransmitters: dopamine, epinephrine and serotonin were executed within 650 seconds and most significantly, the analysis was performed using a small sample volume of just 2 μL. Besides, the use of paper fluidics, straight channel capillary, in-channel detection, screen-printed carbon electrode without decoupler and no requirement of sample pre-treatment were the key advantages of the developed system. The developed procedure for neurochemical detection can be performed with a tiny drop of blood (which can be derived through tiny finger-prick) and shall be thus very less painful as compared to conventional way of extracting cerebrospinal fluid (CSF) from neurodegenerative or neurological disorder patients. Apart from that, present setup may be scaled up to detect even more analytes simultaneously in future research.Conflicts of interest
The authors declare no conflict of interest.Acknowledgements
This study was supported by a research grant from IIT Delhi FIRP project (Project no. MI01437, ‘Paper Fluidics Based Dopamine Detector’). The author Appan Roychoudhury was a recipient of Senior Research Fellowship (SRF) from IIT Delhi. An Indian patent (application no. 201811000669 dated January 06, 2018) has been filed for the present work.References
- A. S. A. Dias, J. C. A. Pinto, M. Magalhães, V. M. Mendes and B. Manadas, J. Pharm. Biomed. Anal., 2020, 187, 113323 CrossRef PubMed.
- K. Imai, S. Higashidate, P. Prados, T. Santa, S. Akachiakahane and T. Nagao, Biol. Pharm. Bull., 1994, 17, 907–910 CrossRef CAS PubMed.
- Y. Wang, D. S. Fice and P. K. Yeung, J. Pharm. Biomed. Anal., 1999, 21, 519–525 CrossRef CAS PubMed.
- S. Palit, K. Singh, B.-S. Lou, J.-L. Her, S.-T. Pang and T.-M. Pan, Sens. Actuators, B, 2020, 310, 127850 CrossRef CAS.
- A. Roychoudhury, S. Basu and S. K. Jha, Biosens. Bioelectron., 2016, 84, 72–81 CrossRef CAS PubMed.
- A. Roychoudhury, A. Prateek, N. Chauhan, D. S. Kumar, S. Basu and S. K. Jha, ChemistrySelect, 2017, 2, 6118–6128 CrossRef CAS.
- F. H. Cincotto, T. C. Canevari, A. M. Campos, R. Landers and S. A. Machado, Analyst, 2014, 139, 4634–4640 RSC.
- L. C. Figueiredo-Filho, T. A. Silva, F. C. Vicentini and O. Fatibello-Filho, Analyst, 2014, 139, 2842–2849 RSC.
- A. Roychoudhury, A. Prateek, S. Basu and S. K. Jha, J. Nanopart. Res., 2018, 20, 70 CrossRef.
- K. G. Commons, in Handbook of Behavioral Neuroscience, ed. C. P. Müller and K. A. Cunningham, Elsevier, 2020, vol. 31, pp. 41–48 Search PubMed.
- V. Carrera, E. Sabater, E. Vilanova and M. A. Sogorb, J. Chromatogr. B: Anal. Technol. Biomed. Life Sci., 2007, 847, 88–94 CrossRef CAS PubMed.
- J. A. Eckstein, G. M. Ammerman, J. M. Reveles and B. L. Ackermann, J. Mass Spectrom., 2008, 43, 782–790 CrossRef CAS PubMed.
- N. T. Deftereos, A. C. Calokerinos and C. E. Efstathiou, Analyst, 1993, 118, 627–632 RSC.
- H. Yao, Y. Y. Sun, X. Lin, J. Cheng and L. Huang, Luminescence, 2006, 21, 112–117 CrossRef CAS PubMed.
- Y. Zhao, S. Zhao, J. Huang and F. Ye, Talanta, 2011, 85, 2650–2654 CrossRef CAS PubMed.
- F. N. Chen, Y. X. Zhang and Z. J. Zhang, Chin. J. Chem., 2007, 25, 942–946 CrossRef CAS.
- C. Muzzi, E. Bertocci, L. Terzuoli, B. Porcelli, I. Ciari, R. Pagani and R. Guerranti, Biomed. Pharmacother., 2008, 62, 253–258 CrossRef CAS PubMed.
- X. Zhu, P. N. Shaw and D. A. Barrett, Anal. Chim. Acta, 2003, 478, 259–269 CrossRef CAS.
- S. Sarre, Y. Michotte, P. Herregodts, D. Deleu, N. De Klippel and G. Ebinger, J. Chromatogr. B: Anal. Technol. Biomed. Life Sci., 1992, 575, 207–212 CrossRef CAS.
- A. El-Beqqali, A. Kussak and M. Abdel-Rehim, J. Sep. Sci., 2007, 30, 421–424 CrossRef CAS PubMed.
- J. R. Thabano, M. C. Breadmore, J. P. Hutchinson, C. Johns and P. R. Haddad, J. Chromatogr. A, 2009, 1216, 4933–4940 CrossRef CAS PubMed.
- J. Kang, X. B. Yin, X. Yang and E. Wang, Electrophoresis, 2005, 26, 1732–1736 CrossRef CAS PubMed.
- M. R. Hormozi Nezhad, J. Tashkhourian and J. Khodaveisi, J. Iran. Chem. Soc., 2010, 7, S83–S91 CrossRef.
- K. Islam, S. K. Jha, R. Chand, D. Han and Y.-S. Kim, Microelectron. Eng., 2012, 97, 391–395 CrossRef CAS.
- K. M. Schilly, S. M. Gunawardhana, M. B. Wijesinghe and S. M. Lunte, Anal. Bioanal. Chem., 2020 DOI:10.1007/s00216-020-02647-z.
- S. R. Chinnadayyala, J. Park, H. T. N. Le, M. Santhosh, A. N. Kadam and S. Cho, Biosens. Bioelectron., 2019, 126, 68–81 CrossRef CAS PubMed.
- A. W. Martinez, S. T. Phillips, G. M. Whitesides and E. Carrilho, Anal. Chem., 2010, 82, 3–10 CrossRef CAS PubMed.
- M. Johirul, A. Shiddiky, R. E. Kim and Y. B. Shim, Electrophoresis, 2005, 26, 3043–3052 CrossRef CAS PubMed.
- M. A. Schwarz, B. Galliker, K. Fluri, T. Kappes and P. C. Hauser, Analyst, 2001, 126, 147–151 RSC.
- M. Vlčková and M. A. Schwarz, J. Chromatogr. A, 2007, 1142, 214–221 CrossRef PubMed.
- A.-J. Wang, J.-J. Xu and H.-Y. Chen, J. Chromatogr. A, 2006, 1107, 257–264 CrossRef CAS PubMed.
- A.-J. Wang, J.-J. Xu, Q. Zhang and H.-Y. Chen, Talanta, 2006, 69, 210–215 CrossRef CAS PubMed.
- W. Wang, L. Zhao, J.-R. Zhang, X.-M. Wang, J.-J. Zhu and H.-Y. Chen, J. Chromatogr. A, 2006, 1136, 111–117 CrossRef CAS PubMed.
- Y. Wu, J.-M. Lin, R. Su, F. Qu and Z. Cai, Talanta, 2004, 64, 338–344 CrossRef CAS PubMed.
- H. Yu, F.-Y. He, Y. Lu, Y.-L. Hu, H.-Y. Zhong and X.-H. Xia, Talanta, 2008, 75, 43–48 CrossRef CAS PubMed.
- Y. Zeng, H. Chen, D.-W. Pang, Z.-L. Wang and J.-K. Cheng, Anal. Chem., 2002, 74, 2441–2445 CrossRef CAS PubMed.
- Y. Zhang, Y. Zhang, G. Wang, W. Chen, Y. Li, Y. Zhang, P. He and Q. Wang, J. Chromatogr. B: Anal. Technol. Biomed. Life Sci., 2016, 1025, 33–39 CrossRef CAS PubMed.
- R. P. Baldwin, T. J. Roussel, M. M. Crain, V. Bathlagunda, D. J. Jackson, J. Gullapalli, J. A. Conklin, R. Pai, J. F. Naber and K. M. Walsh, Anal. Chem., 2002, 74, 3690–3697 CrossRef CAS PubMed.
- M. Castaño-Álvarez, M. T. Fernández-Abedul, A. Costa-García, M. Agirregabiria, L. J. Fernández, J. M. Ruano-López and B. Barredo-Presa, Talanta, 2009, 80, 24–30 CrossRef PubMed.
- R. S. Martin, K. L. Ratzlaff, B. H. Huynh and S. M. Lunte, Anal. Chem., 2002, 74, 1136–1143 CrossRef CAS PubMed.
- N. A. Lacher, S. M. Lunte and R. S. Martin, Anal. Chem., 2004, 76, 2482–2491 CrossRef CAS PubMed.
- M. J. Schöning, M. Jacobs, A. Muck, D.-T. Knobbe, J. Wang, M. Chatrathi and S. Spillmann, Sens. Actuators, B, 2005, 108, 688–694 CrossRef.
- J. A. Vickers and C. S. Henry, Electrophoresis, 2005, 26, 4641–4647 CrossRef CAS PubMed.
- C.-C. Wu, R.-G. Wu, J.-G. Huang, Y.-C. Lin and H.-C. Chang, Anal. Chem., 2003, 75, 947–952 CrossRef CAS PubMed.
- A. Roychoudhury, S. Basu and S. K. Jha, Anal. Sci., 2018, 34, 1163–1169 CrossRef CAS PubMed.
- A. Dawoud, T. Kawaguchi, Y. Markushin, M. Porter and R. Jankowiak, Sens. Actuators, B, 2006, 120, 42–50 CrossRef CAS.
Footnote |
| † Electronic supplementary information (ESI) available. See DOI: 10.1039/d0ra03526b |
| This journal is © The Royal Society of Chemistry 2020 |